
7.5 KiB
Name
修正相对强弱指数趋势跟踪策略-Modified-Relative-Strength-Index-Trend-Following-Strategy
Author
ChaoZhang
Strategy Description
[trans]
概述
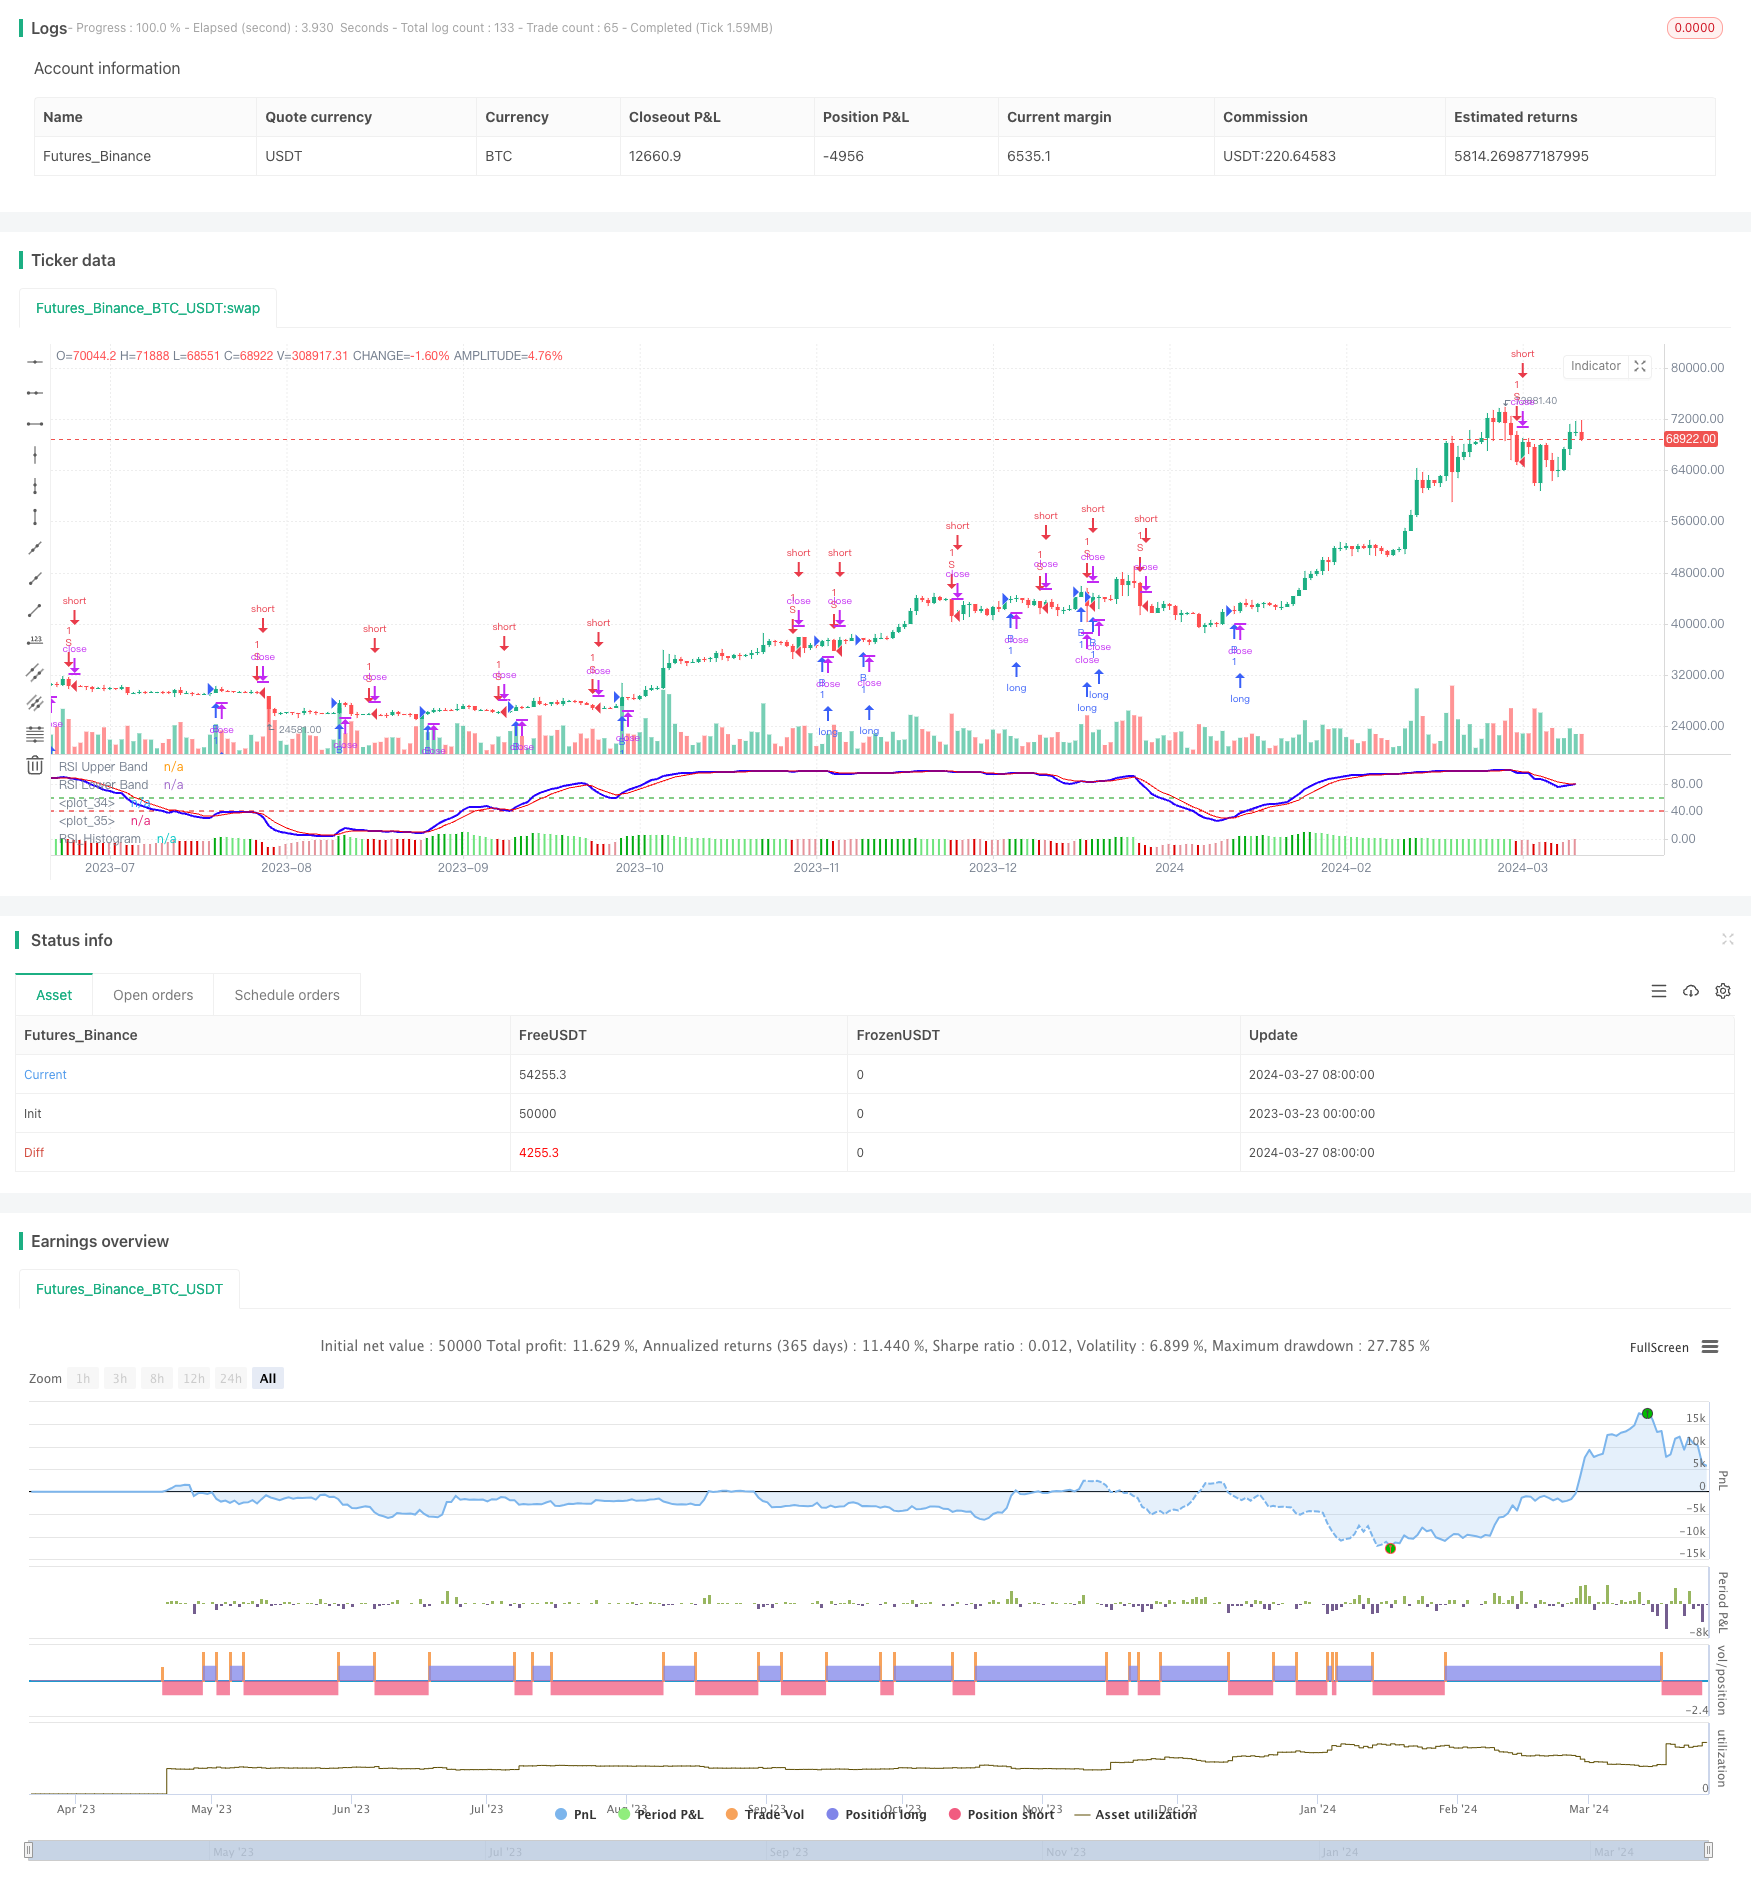
该策略基于修正的相对强弱指数(Modified RSI)来捕捉市场趋势。策略的主要思路是利用Modified RSI指标的交叉信号和直方图信号来判断市场趋势,并根据趋势方向进行交易。
策略原理
- 计算价格的EMA作为Modified RSI的输入
- 计算Modified RSI指标
- 计算Modified RSI的EMA作为信号线
- 计算Modified RSI和信号线的差值作为直方图
- 当Modified RSI上穿信号线且直方图大于0时,产生买入信号
- 当Modified RSI下穿信号线且直方图小于0时,产生卖出信号
策略优势
- Modified RSI指标相比传统RSI指标,能更好地捕捉趋势
- 结合Modified RSI的交叉信号和直方图信号,能有效过滤假信号
- 参数可调,适用于不同的市场和周期
- 程序简洁,计算效率高
策略风险
- Modified RSI指标在震荡市容易产生错误信号
- 趋势转折点的捕捉可能存在滞后
- 单一指标容易受到价格噪音干扰
策略优化方向
- 可以结合其他趋势指标如移动平均线等,提高信号可靠性
- 可以加入止损止盈模块,控制单笔交易风险
- 可以根据不同市场特点,优化参数
- 可以加入仓位管理模块,动态调整仓位
总结
该策略利用Modified RSI指标的特性,从趋势跟踪的角度构建交易系统。Modified RSI指标克服了传统RSI指标的部分缺陷,趋势捕捉能力相对较强。但是单一指标的策略往往存在局限性,需要结合其他技术手段来改进。通过优化策略参数、丰富信号来源、加入风控模块等方法,可以进一步提升该策略的稳定性和盈利能力。
||
Overview
This strategy captures market trends based on the Modified Relative Strength Index (Modified RSI). The main idea of the strategy is to use the crossover signals and histogram signals of the Modified RSI indicator to determine the market trend and make trades according to the trend direction.
Strategy Principle
- Calculate the EMA of price as the input for Modified RSI
- Calculate the Modified RSI indicator
- Calculate the EMA of Modified RSI as the signal line
- Calculate the difference between Modified RSI and signal line as the histogram
- When Modified RSI crosses above the signal line and the histogram is greater than 0, generate a buy signal
- When Modified RSI crosses below the signal line and the histogram is less than 0, generate a sell signal
Strategy Advantages
- The Modified RSI indicator can better capture trends compared to the traditional RSI indicator
- Combining the crossover signals and histogram signals of Modified RSI can effectively filter out false signals
- Parameters are adjustable and applicable to different markets and timeframes
- The program is concise and computationally efficient
Strategy Risks
- The Modified RSI indicator is prone to generating false signals in range-bound markets
- The capture of trend turning points may have a lag
- A single indicator is easily affected by price noise
Strategy Optimization Directions
- It can be combined with other trend indicators such as moving averages to improve signal reliability
- A stop-loss and take-profit module can be added to control single transaction risk
- Parameters can be optimized based on different market characteristics
- A position management module can be added to dynamically adjust positions
Summary
This strategy utilizes the characteristics of the Modified RSI indicator to build a trading system from the perspective of trend following. The Modified RSI indicator overcomes some of the defects of the traditional RSI indicator and has relatively strong trend capture ability. However, strategies based on a single indicator often have limitations and need to be improved in combination with other technical means. By optimizing strategy parameters, enriching signal sources, adding risk control modules, and other methods, the stability and profitability of this strategy can be further improved. [/trans]
Strategy Arguments
| Argument | Default | Description |
|---|---|---|
| v_input_int_1 | 13 | Price_EMA |
| v_input_int_2 | 14 | RSI_Period |
| v_input_int_3 | 5 | RSI_Avg_EMA |
| v_input_int_4 | 20 | Fast_EMA |
| v_input_int_5 | 50 | Slow_EMA |
| v_input_source_1_close | 0 | Source: close |
| v_input_1 | #02ac11 | (?Histogram)Above Grow |
| v_input_2 | #6ee47d | Fall |
| v_input_3 | #e5939b | Below Grow |
| v_input_4 | #dd0000 | Fall |
Source (PineScript)
/*backtest
start: 2023-03-23 00:00:00
end: 2024-03-28 00:00:00
period: 1d
basePeriod: 1h
exchanges: [{"eid":"Futures_Binance","currency":"BTC_USDT"}]
*/

// This source code is subject to the terms of the Mozilla Public License 2.0 at https://mozilla.org/MPL/2.0/
// © YogirajDange

//@version=5


// Verical lines


// // Define the times
// t1 = timestamp(year, month, dayofmonth, 09, 15) // 9:15
// t2 = timestamp(year, month, dayofmonth, 11, 15) // 11:15
// t3 = timestamp(year, month, dayofmonth, 13, 15) // 1:15
// t4 = timestamp(year, month, dayofmonth, 15, 25) // 3:25

// // Check if the current bar is on the current day
// is_today = (year(time) == year(timenow)) and (month(time) == month(timenow)) and (dayofmonth(time) == dayofmonth(timenow))

// // Draw a vertical line at each time
// if is_today and (time == t1 or time == t2 or time == t3 or time == t4)
//     line.new(x1 = bar_index, y1 = low, x2 = bar_index, y2 = high, extend = extend.both, color=color.red, width = 1)

strategy('Modified RSI')
col_grow_above = input(#02ac11, "Above   Grow", group="Histogram", inline="Above")
col_fall_above = input(#6ee47d, "Fall", group="Histogram", inline="Above")
col_grow_below = input(#e5939b, "Below Grow", group="Histogram", inline="Below")
col_fall_below = input(#dd0000, "Fall", group="Histogram", inline="Below")
EMA_length = input.int(13, 'Price_EMA', minval=1)
RSI_length = input.int(14, 'RSI_Period', minval=1)
Avg_length = input.int(5, 'RSI_Avg_EMA', minval=1)
fastMA = ta.ema(close, EMA_length)
modrsi = ta.rsi(fastMA, RSI_length)
RSIAVG = ta.ema(modrsi, Avg_length)
plot(modrsi, color=color.rgb(38, 0, 255), linewidth=2)
plot(RSIAVG, color=color.rgb(247, 0, 0))
rsiUpperBand = hline(60, 'RSI Upper Band', color=#099b0e)
//hline(50, "RSI Middle Band", color=color.new(#787B86, 50))
rsiLowerBand = hline(40, 'RSI Lower Band', color=#e90101)

RSI_hist = modrsi - RSIAVG

//plot(RSI_hist,"RSI_Histogram", color = #c201e9, style = plot.style_columns,linewidth= 5)

plot(RSI_hist, title="RSI_Histogram", style=plot.style_columns, color=(RSI_hist>=0 ? (RSI_hist[1] < RSI_hist ? col_grow_above : col_fall_above) : (RSI_hist[1] < RSI_hist ? col_grow_below : col_fall_below)))


/////// Moving Averages 20 50 EMA

fast_ma = input.int(20, minval=2, title="Fast_EMA")
slow_ma = input.int(50, minval=2, title="Slow_EMA")

src = input.source(close, title="Source")

out = ta.ema(src, fast_ma)
out1 = ta.ema(src, slow_ma)

//plot(out, title="20 EMA", color=color.rgb(117, 71, 247), linewidth = 2)
//plot(out1, title="50 EMA", color=color.rgb(0, 0, 0), linewidth = 2)


longCondition = ((ta.crossover(modrsi, RSIAVG)) and (RSI_hist > 0))
if longCondition
    strategy.entry('B', strategy.long)

shortCondition = ((ta.crossunder(modrsi, RSIAVG)) and (RSI_hist < 0))
if shortCondition
    strategy.entry('S', strategy.short)
Detail
https://www.fmz.com/strategy/446553
Last Modified
2024-03-29 16:16:37