
258 lines
18 KiB
Markdown
258 lines
18 KiB
Markdown
|
|
> Name
|
|
|
|
交叉突破型双均线系统策略-Cross-Breakout-Dual-EMA-System-Strategy
|
|
|
|
> Author
|
|
|
|
ianzeng123
|
|
|
|
> Strategy Description
|
|
|
|
|
|
|
|
|
|
|
|
|
|
|
|
|
|
[trans]
|
|
|
|
#### 概述
|
|
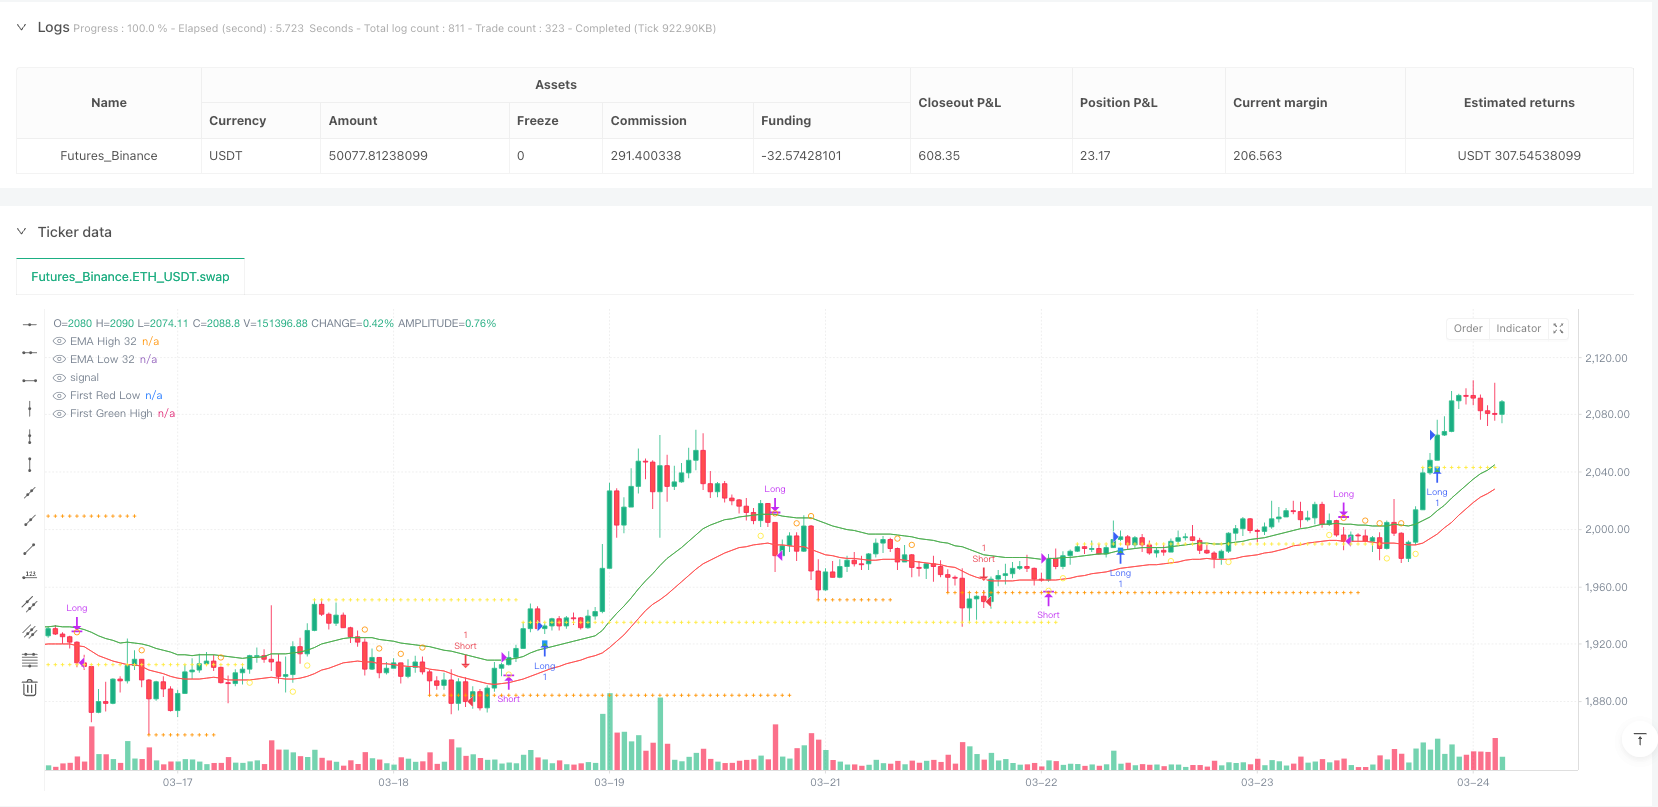
交叉突破型双均线系统策略是一种基于32周期指数移动平均线(EMA)的高点和低点的技术分析策略。该策略核心思想是通过识别价格与32周期EMA的交叉点以及特殊的"无接触蜡烛"形态来确认趋势方向,并在关键价格突破确认后入场交易。该策略专为5分钟时间框架设计,通过严格的入场条件和明确的出场规则,使交易者能够捕捉短期趋势变化带来的机会。
|
|
|
|
#### 策略原理
|
|
该策略的运作基于以下几个关键步骤:
|
|
|
|
1. 计算32周期EMA的高点(ema_high_32)和低点(ema_low_32)作为主要参考线。
|
|
2. 识别价格与EMA的关键交叉:当收盘价向上穿越高点EMA时,标记潜在的做多机会;当收盘价向下穿越低点EMA时,标记潜在的做空机会。
|
|
3. 寻找"无接触蜡烛"形态:做多方向上,识别完全位于高点EMA之上的阳线;做空方向上,识别完全位于低点EMA之下的阴线。
|
|
4. 记录第一个"无接触蜡烛"的高点或低点作为突破参考点。
|
|
5. 当价格突破该参考点且下一根同向蜡烛出现时,触发入场信号。
|
|
6. 出场策略:当价格收盘低于低点EMA时平仓多头;当价格收盘高于高点EMA时平仓空头。
|
|
|
|
该策略的核心逻辑在于,它不仅要求价格与EMA发生交叉,还需要通过"无接触蜡烛"和突破确认来过滤假信号,提高交易的准确性。这种多重确认机制有效减少了盘整市场中的误入场风险。
|
|
|
|
#### 策略优势
|
|
通过深入分析代码,该策略具有以下显著优势:
|
|
|
|
1. 双重确认机制:策略不仅需要价格与EMA交叉,还需要"无接触蜡烛"和价格突破的确认,大大降低了假突破的风险。
|
|
2. 趋势跟踪与反转兼顾:虽然主要是趋势跟踪策略,但通过捕捉EMA交叉点,也能及时发现潜在的趋势反转。
|
|
3. 明确的入场和出场规则:策略有严格定义的入场和出场条件,减少了主观判断,便于程序化实现和回测。
|
|
4. 视觉辅助丰富:策略在图表上提供了多种视觉指示器,包括EMA线、突破点、各种交易信号标记,帮助交易者更直观地理解市场状况。
|
|
5. 状态管理完善:代码中使用多个布尔变量严格跟踪交易状态,确保不会出现重复入场或混乱的信号。
|
|
6. 适应短期波动:专为5分钟时间框架设计,能够有效捕捉短期市场波动带来的交易机会。
|
|
|
|
#### 策略风险
|
|
尽管该策略设计精巧,但仍存在以下潜在风险:
|
|
|
|
1. 反复横盘风险:在价格频繁穿越EMA的震荡市场中,可能导致频繁交易和连续亏损。解决方法是增加额外的市场环境过滤条件,如波动率指标或趋势强度指标。
|
|
2. 参数敏感性:32周期EMA参数是策略的核心,不同市场或时间框架可能需要不同的参数设置。建议通过回测优化来确定最适合特定交易品种的参数。
|
|
3. 延迟风险:由于策略需要多重确认,在快速趋势变化中可能出现入场延迟,错过部分行情。可以考虑在强趋势环境中适当放宽入场条件。
|
|
4. 假突破风险:尽管有多重确认,市场仍可能出现假突破后迅速回撤的情况。可以考虑添加止损策略或使用更保守的仓位管理。
|
|
5. 时间框架局限:策略专为5分钟框架设计,直接应用于其他时间框架可能效果不佳。在应用到其他时间框架时需要重新优化参数。
|
|
6. 缺乏止盈机制:当前策略只有止损没有明确的止盈规则,可能导致在趋势结束前过早出场或错失利润。建议添加基于波动率或支撑阻力的动态止盈机制。
|
|
|
|
#### 策略优化方向
|
|
基于代码分析,以下是该策略可以优化的几个主要方向:
|
|
|
|
1. 动态EMA周期:可以考虑基于市场波动率动态调整EMA周期,在高波动市场使用较短的EMA,低波动市场使用较长的EMA,以适应不同市场环境。
|
|
2. 加入趋势强度过滤:可以引入ADX等趋势强度指标,只在趋势强度足够的情况下开仓,避免在横盘市场频繁交易。
|
|
3. 优化止盈策略:增加基于ATR或关键价格水平的动态止盈机制,在趋势有利发展时保护利润。
|
|
4. 时间过滤:添加时间过滤条件,避免在市场开盘、收盘或低流动性时段交易。
|
|
5. 多时间框架分析:整合更高时间框架的趋势方向作为过滤条件,只在多时间框架趋势一致时交易。
|
|
6. 仓位管理优化:基于市场波动率或账户风险比例动态调整仓位大小,而不是固定仓位。
|
|
7. 增加交易持续时间限制:如果交易在一定时间内未达到预期收益,自动平仓以避免长期套牢。
|
|
|
|
这些优化方向主要是为了提高策略的鲁棒性和适应性,减少在不利市场环境下的亏损。
|
|
|
|
#### 总结
|
|
交叉突破型双均线系统策略是一个精心设计的技术分析交易系统,通过32周期EMA高低点、价格交叉、无接触蜡烛和突破确认等多重机制来识别高概率交易机会。该策略在趋势明确的市场中表现出色,通过严格的入场确认和清晰的出场规则,有效降低了误入场风险。
|
|
|
|
然而,任何交易策略都有其局限性,该策略在横盘或高波动市场中可能面临挑战。通过引入趋势强度过滤、动态参数调整、多时间框架分析等优化措施,可以进一步提升策略的稳定性和适应性。
|
|
|
|
作为一个5分钟时间框架的短线交易系统,该策略特别适合日内交易者和短线交易者。最后,良好的风险管理始终是成功应用任何交易策略的关键,建议交易者在实盘应用前进行充分的回测和模拟交易,并结合个人风险承受能力制定合理的仓位管理规则。 ||
|
|
|
|
#### Overview
|
|
The Cross-Breakout Dual EMA System Strategy is a technical analysis approach based on the 32-period Exponential Moving Average (EMA) of highs and lows. The core concept involves identifying price crossovers with the 32-period EMA and special "no-touch candle" formations to confirm trend direction, entering trades after key price breakout confirmations. Specifically designed for the 5-minute timeframe, this strategy employs strict entry conditions and clear exit rules, enabling traders to capture opportunities from short-term trend changes.
|
|
|
|
#### Strategy Principles
|
|
The strategy operates based on the following key steps:
|
|
|
|
1. Calculate the 32-period EMA of highs (ema_high_32) and lows (ema_low_32) as primary reference lines.
|
|
2. Identify critical price-EMA crossovers: When closing price crosses above the high EMA, mark potential long opportunities; when closing price crosses below the low EMA, mark potential short opportunities.
|
|
3. Look for "no-touch candle" formations: For long positions, identify bullish candles completely above the high EMA; for short positions, identify bearish candles completely below the low EMA.
|
|
4. Record the high or low of the first "no-touch candle" as a breakout reference point.
|
|
5. When price breaks through this reference point and the next candle in the same direction appears, trigger an entry signal.
|
|
6. Exit strategy: Close long positions when price closes below the low EMA; close short positions when price closes above the high EMA.
|
|
|
|
The core logic of this strategy lies in requiring not only price-EMA crossovers but also "no-touch candle" and breakout confirmation to filter false signals, improving trading accuracy. This multi-confirmation mechanism effectively reduces the risk of incorrect entries in ranging markets.
|
|
|
|
#### Strategy Advantages
|
|
Through in-depth code analysis, this strategy demonstrates the following significant advantages:
|
|
|
|
1. Dual confirmation mechanism: The strategy requires not only price-EMA crossovers but also "no-touch candle" and price breakout confirmations, greatly reducing the risk of false breakouts.
|
|
2. Balances trend-following and reversal: While primarily a trend-following strategy, it can promptly identify potential trend reversals by capturing EMA crossover points.
|
|
3. Clear entry and exit rules: The strategy has strictly defined entry and exit conditions, reducing subjective judgment and facilitating algorithmic implementation and backtesting.
|
|
4. Rich visual assistance: The strategy provides various visual indicators on charts, including EMA lines, breakout points, and trade signal markers, helping traders intuitively understand market conditions.
|
|
5. Comprehensive state management: Multiple boolean variables in the code strictly track trading states, ensuring no duplicate entries or confusing signals occur.
|
|
6. Adaptation to short-term fluctuations: Specifically designed for the 5-minute timeframe, effectively capturing trading opportunities from short-term market movements.
|
|
|
|
#### Strategy Risks
|
|
Despite its sophisticated design, the strategy still presents the following potential risks:
|
|
|
|
1. Consolidation risk: In oscillating markets where prices frequently cross EMAs, it may lead to frequent trading and consecutive losses. Solution: Add additional market environment filtering conditions, such as volatility indicators or trend strength indicators.
|
|
2. Parameter sensitivity: The 32-period EMA parameter is central to the strategy; different markets or timeframes may require different parameter settings. Recommendation: Optimize through backtesting to determine parameters best suited for specific trading instruments.
|
|
3. Delay risk: Due to multiple confirmation requirements, entry delays may occur during rapid trend changes, missing partial price movements. Consider relaxing entry conditions in strong trend environments.
|
|
4. False breakout risk: Despite multiple confirmations, markets may still show false breakouts followed by quick retracements. Consider adding stop-loss strategies or using more conservative position management.
|
|
5. Timeframe limitation: The strategy is specifically designed for the 5-minute framework; direct application to other timeframes may yield suboptimal results. Parameters need re-optimization when applied to other timeframes.
|
|
6. Lack of profit-taking mechanism: The current strategy has stop-losses but no clear profit-taking rules, potentially leading to premature exits before trend completion or missed profits. Recommend adding dynamic profit-taking mechanisms based on volatility or support/resistance.
|
|
|
|
#### Strategy Optimization Directions
|
|
Based on code analysis, here are several main directions for strategy optimization:
|
|
|
|
1. Dynamic EMA periods: Consider dynamically adjusting EMA periods based on market volatility, using shorter EMAs in high-volatility markets and longer EMAs in low-volatility markets, adapting to different market environments.
|
|
2. Add trend strength filtering: Incorporate trend strength indicators like ADX, only entering positions when trend strength is sufficient, avoiding frequent trading in ranging markets.
|
|
3. Optimize profit-taking strategy: Add dynamic profit-taking mechanisms based on ATR or key price levels, protecting profits when trends develop favorably.
|
|
4. Time filtering: Add time filtering conditions to avoid trading during market opening, closing, or low-liquidity sessions.
|
|
5. Multi-timeframe analysis: Integrate higher timeframe trend directions as filtering conditions, only trading when multi-timeframe trends align.
|
|
6. Position management optimization: Dynamically adjust position sizes based on market volatility or account risk proportions, rather than fixed positions.
|
|
7. Add trade duration limits: Automatically close positions if trades don't reach expected returns within a certain timeframe, avoiding long-term trapped positions.
|
|
|
|
These optimization directions primarily aim to enhance strategy robustness and adaptability, reducing losses in unfavorable market environments.
|
|
|
|
#### Summary
|
|
The Cross-Breakout Dual EMA System Strategy is a meticulously designed technical analysis trading system that identifies high-probability trading opportunities through multiple mechanisms including 32-period EMA highs and lows, price crossovers, no-touch candles, and breakout confirmations. This strategy performs excellently in markets with clear trends, effectively reducing false entry risks through strict entry confirmations and clear exit rules.
|
|
|
|
However, like any trading strategy, it has limitations and may face challenges in ranging or highly volatile markets. By introducing trend strength filtering, dynamic parameter adjustments, multi-timeframe analysis, and other optimization measures, the strategy's stability and adaptability can be further enhanced.
|
|
|
|
As a short-term trading system for the 5-minute timeframe, this strategy is particularly suitable for intraday and short-term traders. Finally, good risk management remains key to successfully applying any trading strategy. Traders are advised to conduct thorough backtesting and simulated trading before live implementation, developing reasonable position management rules based on individual risk tolerance.[/trans]
|
|
|
|
|
|
|
|
> Source (PineScript)
|
|
|
|
``` pinescript
|
|
/*backtest
|
|
start: 2024-03-26 00:00:00
|
|
end: 2025-03-25 00:00:00
|
|
period: 1h
|
|
basePeriod: 1h
|
|
exchanges: [{"eid":"Futures_Binance","currency":"ETH_USDT"}]
|
|
*/
|
|
|
|
//@version=5
|
|
strategy("TrophyFighter 32 EMA HL", overlay=true)
|
|
|
|
// 32 EMA for high and low
|
|
ema_high_32 = ta.ema(high, 32)
|
|
ema_low_32 = ta.ema(low, 32)
|
|
|
|
// Detect crossover and crossunder
|
|
cross_above_high_ema = ta.crossover(close, ema_high_32)
|
|
cross_below_low_ema = ta.crossunder(close, ema_low_32)
|
|
|
|
// Identify no-touch candles
|
|
no_touch_green = close > open and low > ema_high_32
|
|
no_touch_red = close < open and high < ema_low_32
|
|
|
|
// Track the high and low of no-touch candles
|
|
var float first_green_high = na
|
|
var float first_red_low = na
|
|
var bool waiting_for_long = false
|
|
var bool waiting_for_short = false
|
|
var bool in_long_trade = false // Whether a long trade is active
|
|
var bool in_short_trade = false // Whether a short trade is active
|
|
var bool first_no_touch_green_shown = false // First green diamond shown
|
|
var bool first_no_touch_red_shown = false // First red diamond shown
|
|
|
|
if (cross_above_high_ema and not in_long_trade and not in_short_trade)
|
|
first_green_high := na
|
|
waiting_for_long := true
|
|
first_no_touch_green_shown := false // Reset
|
|
|
|
if (cross_below_low_ema and not in_long_trade and not in_short_trade)
|
|
first_red_low := na
|
|
waiting_for_short := true
|
|
first_no_touch_red_shown := false // Reset
|
|
|
|
if (no_touch_green and waiting_for_long and ta.valuewhen(cross_above_high_ema, bar_index, 0) > ta.valuewhen(no_touch_green, bar_index, 1))
|
|
first_green_high := high
|
|
first_no_touch_green_shown := true // Set first green diamond
|
|
|
|
if (no_touch_red and waiting_for_short and ta.valuewhen(cross_below_low_ema, bar_index, 0) > ta.valuewhen(no_touch_red, bar_index, 1))
|
|
first_red_low := low
|
|
first_no_touch_red_shown := true // Set first red diamond
|
|
|
|
// Identify breakout (on the previous candle) - using na() function
|
|
long_breakout_check = high > ta.valuewhen(not na(first_green_high), first_green_high, 0) and not na(first_green_high) and waiting_for_long
|
|
short_breakout_check = low < ta.valuewhen(not na(first_red_low), first_red_low, 0) and not na(first_red_low) and waiting_for_short
|
|
|
|
// Buy and sell conditions (on the next same-colored candle)
|
|
long_condition = long_breakout_check[1] and close > open and not in_long_trade and not in_short_trade // Next green candle
|
|
short_condition = short_breakout_check[1] and close < open and not in_long_trade and not in_short_trade // Next red candle
|
|
|
|
// Breakout check (only on the signal candle)
|
|
long_breakout = long_condition // Blue square only for signal
|
|
short_breakout = short_condition // White square only for signal
|
|
|
|
// Signal for the first no-touch candle
|
|
first_no_touch_green = no_touch_green and not first_no_touch_green_shown and waiting_for_long and ta.valuewhen(cross_above_high_ema, bar_index, 0) > ta.valuewhen(no_touch_green, bar_index, 1)
|
|
first_no_touch_red = no_touch_red and not first_no_touch_red_shown and waiting_for_short and ta.valuewhen(cross_below_low_ema, bar_index, 0) > ta.valuewhen(no_touch_red, bar_index, 1)
|
|
|
|
// When a trade starts
|
|
if (long_condition)
|
|
waiting_for_long := false
|
|
in_long_trade := true // Start long trade
|
|
|
|
if (short_condition)
|
|
waiting_for_short := false
|
|
in_short_trade := true // Start short trade
|
|
|
|
// New exit rules
|
|
long_exit = close < ema_low_32 and in_long_trade // Price drops below EMA low
|
|
short_exit = close > ema_high_32 and in_short_trade // Price rises above EMA high
|
|
|
|
// Reset when trade closes
|
|
if (long_exit)
|
|
in_long_trade := false
|
|
|
|
if (short_exit)
|
|
in_short_trade := false
|
|
|
|
// Plot EMA and levels (cross style)
|
|
plot(ema_high_32, color=color.green, title="EMA High 32")
|
|
plot(ema_low_32, color=color.red, title="EMA Low 32")
|
|
plot(first_green_high, color=color.yellow, style=plot.style_cross, linewidth=1, title="First Green High")
|
|
plot(first_red_low, color=color.orange, style=plot.style_cross, linewidth=1, title="First Red Low")
|
|
|
|
// Debugging signals
|
|
plotshape(cross_above_high_ema, title="Cross Above EMA", location=location.belowbar, color=color.yellow, style=shape.circle, size=size.tiny)
|
|
plotshape(cross_below_low_ema, title="Cross Below EMA", location=location.abovebar, color=color.orange, style=shape.circle, size=size.tiny)
|
|
plotshape(first_no_touch_green, title="No Touch Green", location=location.belowbar, color=color.lime, style=shape.diamond, size=size.tiny)
|
|
plotshape(first_no_touch_red, title="No Touch Red", location=location.abovebar, color=color.purple, style=shape.diamond, size=size.tiny)
|
|
plotshape(long_breakout, title="Long Breakout", location=location.belowbar, color=color.blue, style=shape.square, size=size.tiny)
|
|
plotshape(short_breakout, title="Short Breakout", location=location.abovebar, color=color.white, style=shape.square, size=size.tiny)
|
|
plotshape(long_condition, title="Buy Signal", location=location.belowbar, color=color.green, style=shape.triangleup, size=size.small)
|
|
plotshape(short_condition, title="Sell Signal", location=location.abovebar, color=color.red, style=shape.triangledown, size=size.small)
|
|
|
|
// Execute trades
|
|
if (long_condition)
|
|
strategy.entry("Long", strategy.long)
|
|
if (short_condition)
|
|
strategy.entry("Short", strategy.short)
|
|
if (long_exit)
|
|
strategy.close("Long", comment="Long Exit")
|
|
if (short_exit)
|
|
strategy.close("Short", comment="Short Exit")
|
|
|
|
```
|
|
|
|
> Detail
|
|
|
|
https://www.fmz.com/strategy/488244
|
|
|
|
> Last Modified
|
|
|
|
2025-03-26 11:14:18
|