
181 lines
6.9 KiB
Markdown
181 lines
6.9 KiB
Markdown
|
||
> Name
|
||
|
||
一种移动平均线指标策略-Moving-Average-Indicator-Strategy
|
||
|
||
> Author
|
||
|
||
ChaoZhang
|
||
|
||
> Strategy Description
|
||
|
||
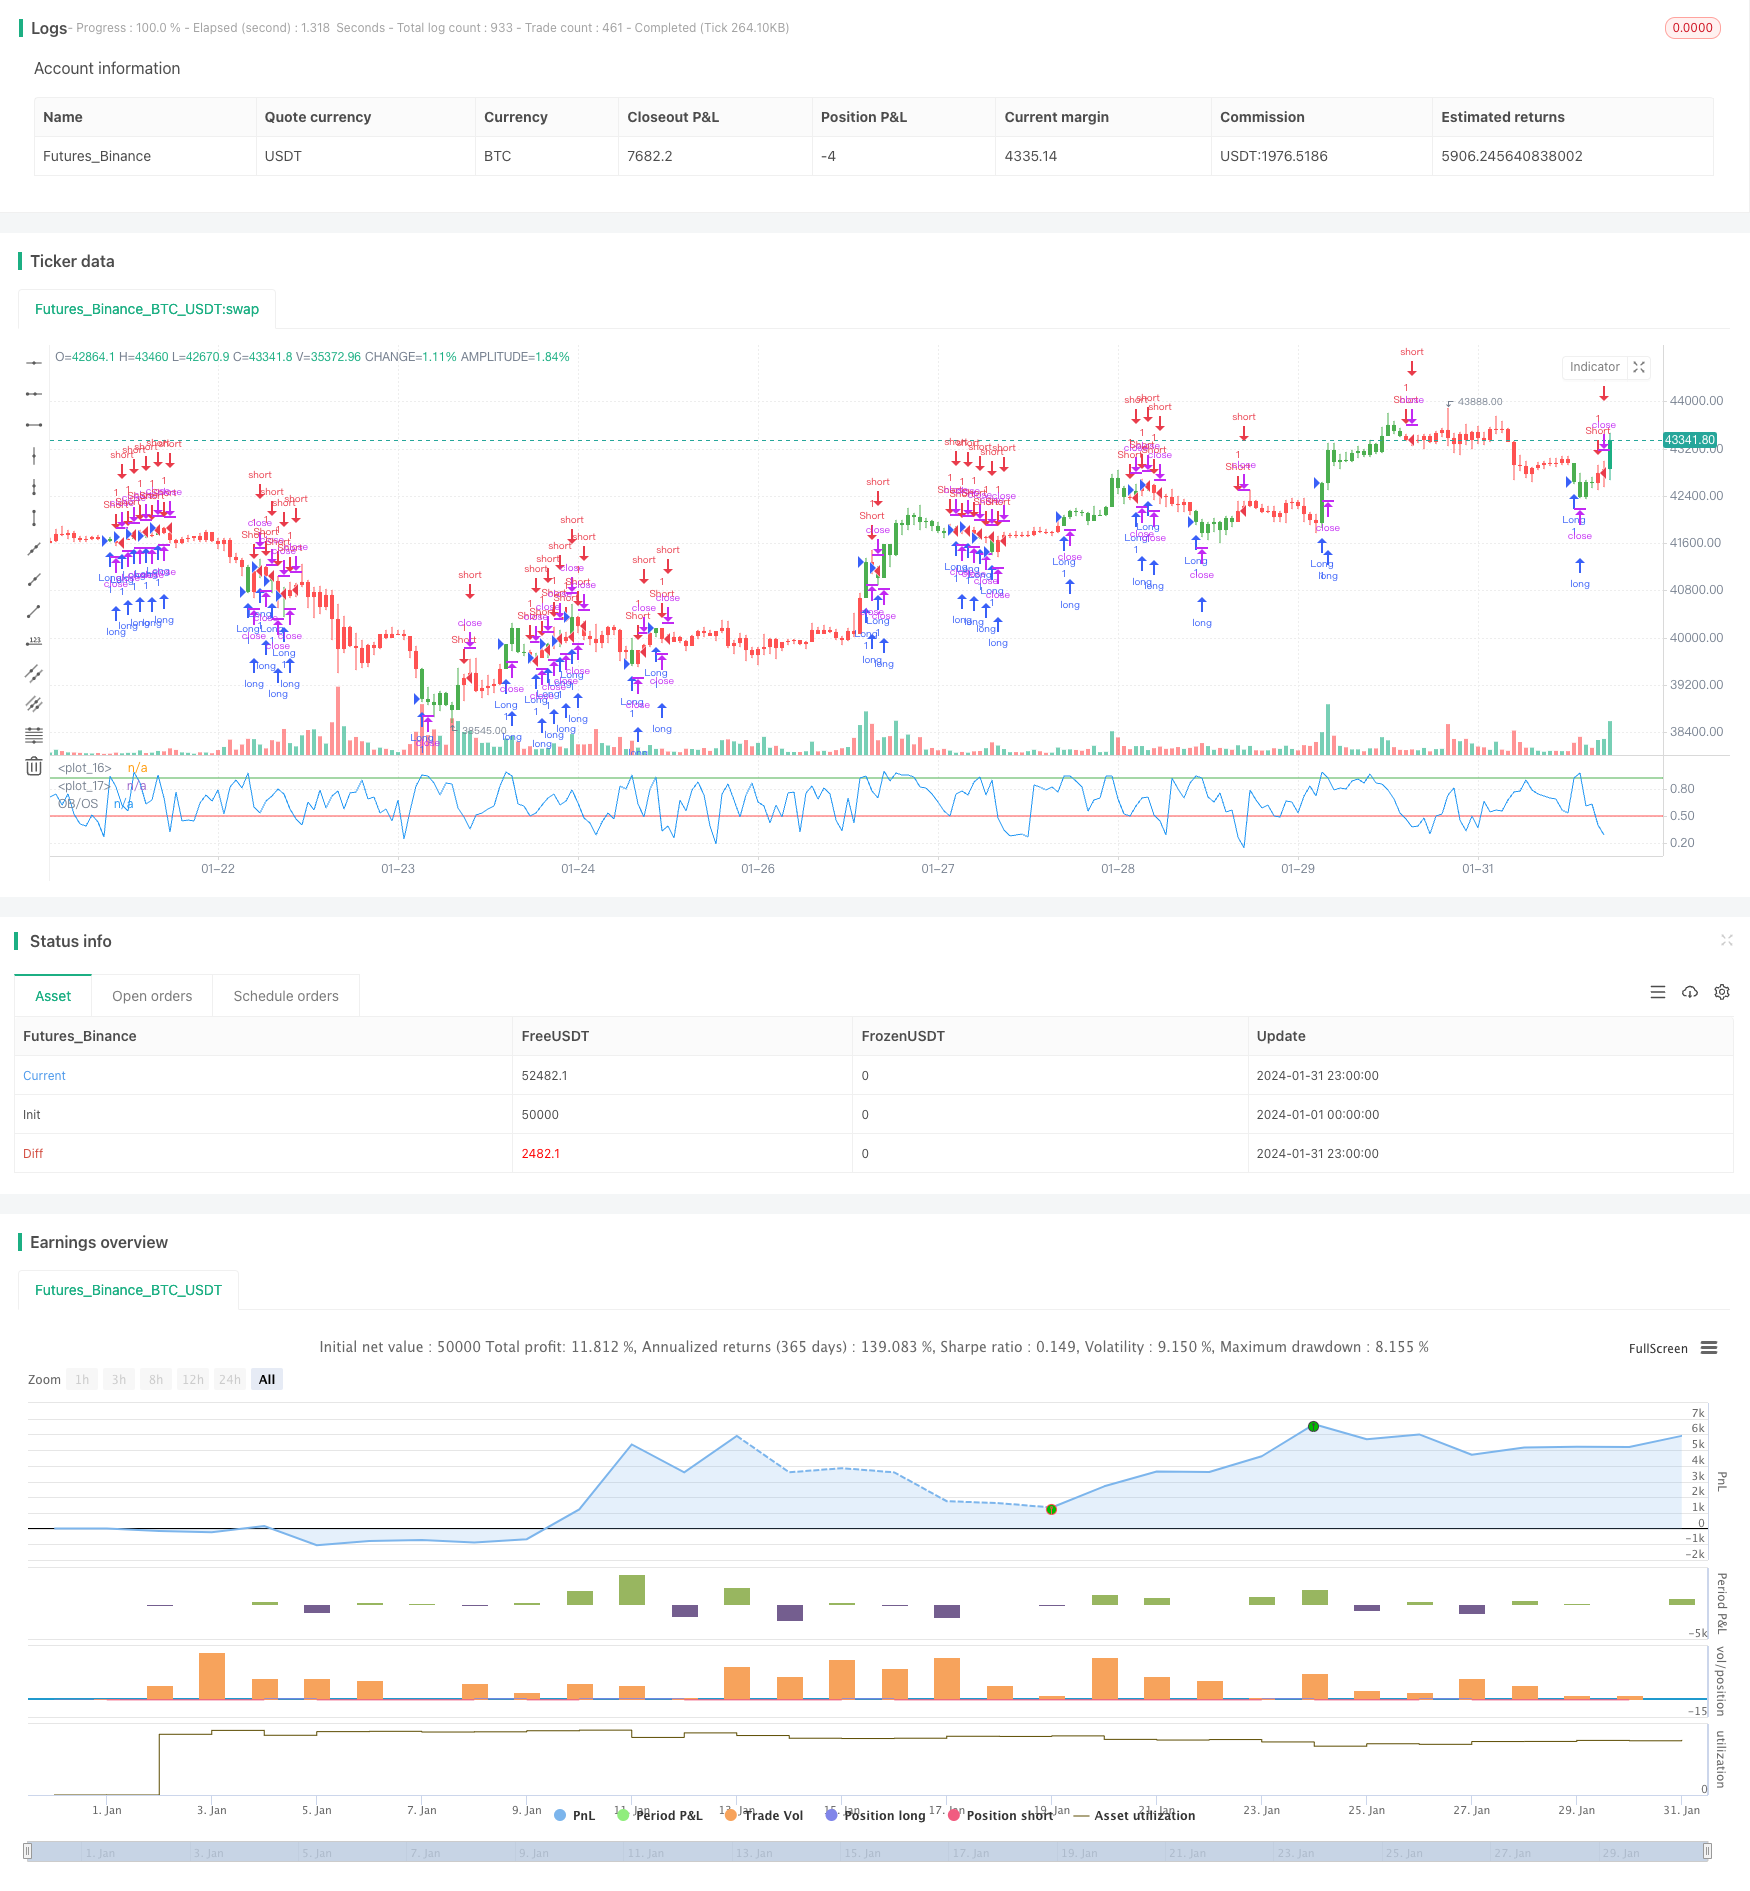
|
||
[trans]
|
||
## 概述
|
||
|
||
移动平均线指标策略是一种根据移动平均线判断市场趋势,并进行长仓或短仓操作的量化交易策略。该策略通过计算一定周期的收盘价平均值,判断市场是否处在超买或超卖状态,以捕捉价格反转机会。
|
||
|
||
## 策略原理
|
||
|
||
该策略的核心指标是随机指数移动平均线(Stochastic Oscillator)。其计算方法是:
|
||
|
||
```
|
||
低点 = 最近N天的最低价中的最低值
|
||
高点 = 最近N天的最高价中的最高值
|
||
K值 = (当前close - 低点)/(高点 - 低点)* 100
|
||
```
|
||
|
||
其中,N值即为长度Length。该指标大体反映了当前收盘价相对最近N天价格范围的位置。
|
||
|
||
当K值大于超买线(BuyBand),表示股价可能超买,将发生回调;当K值小于超卖线(SellBand),表示股价可能超卖,将发生反弹。
|
||
|
||
根据这一判断规则,该策略会在超买区卖出开仓,在超卖区买入开仓。平仓条件则是指标线重新进入中间区域((SellBand, BuyBand))。
|
||
|
||
## 优势分析
|
||
|
||
该策略具有以下优势:
|
||
|
||
1. 使用移动平均线指标判断市场趋势,回测效果较好,容易形成交易信号
|
||
2. 通过调整参数,可以灵活适应不同周期和品种
|
||
3. 策略思路简单清晰,容易理解和优化
|
||
|
||
## 风险分析
|
||
|
||
该策略也存在一些风险:
|
||
|
||
1. 移动平均线容易产生错触现象,可能出现超买超卖信号被“甩”的情况
|
||
2. 参数设置不当可能导致交易频繁或信号不明显
|
||
3. 只考虑单一指标,可优化空间有限
|
||
|
||
可以通过适当优化指标参数,或增加过滤条件来减少这些风险。
|
||
|
||
## 优化方向
|
||
|
||
该策略主要可以从以下几个方面进行优化:
|
||
|
||
1. 增加volume或ATR等指标过滤,确保交易信号更可靠
|
||
2. 加入多个周期的Stoch指标,进行组合运算生成信号
|
||
3. 增加附加判断指标,如MACD、KDJ等,实现多指标聚合
|
||
4. 对交易品种、周期、参数进行遍历优化,寻找最佳配置
|
||
|
||
## 总结
|
||
|
||
移动平均线指标策略整体思路简单,使用广泛,回测效果较为稳定,适合作为量化交易的入门策略之一。但该策略考虑因素单一,可优化空间有限,仅适合短期操作。未来可通过多指标聚合、机器学习等手段进行升级。
|
||
|
||
||
|
||
|
||
## Overview
|
||
|
||
The Moving Average Indicator strategy is a quantitative trading strategy that judges market trends based on moving averages and conducts long or short position operations. By calculating the average closing price over a period of time, this strategy determines whether the market is overbought or oversold in order to capture price reversal opportunities.
|
||
|
||
## Strategy Principle
|
||
|
||
The core indicator of this strategy is the Stochastic Oscillator. Its calculation method is:
|
||
|
||
```
|
||
Low = the lowest low of the most recent N days
|
||
High = the highest high of the most recent N days
|
||
K value = (Current close – Low)/(High – Low)*100
|
||
```
|
||
|
||
Where N is the length Length. This indicator roughly reflects the position of the current closing price relative to the price range over the most recent N days.
|
||
|
||
When the K value is greater than the overbought line (BuyBand), it indicates that the stock may be overbought and a callback will occur. When the K value is less than the oversold line (SellBand), it indicates that the stock may be oversold and a rebound will occur.
|
||
|
||
According to this judgment rule, the strategy will sell to open a position in the overbought zone and buy to open a position in the oversold zone. The closing condition is that the indicator line re-enters the intermediate zone ((SellBand, BuyBand)).
|
||
|
||
## Advantage Analysis
|
||
|
||
This strategy has the following advantages:
|
||
|
||
1. Using moving average indicators to determine market trends, good backtesting results, easy to form trading signals
|
||
2. Flexible to adapt to different cycles and varieties by adjusting parameters
|
||
3. The strategy idea is simple and clear, easy to understand and optimize
|
||
|
||
## Risk Analysis
|
||
|
||
The strategy also poses some risks:
|
||
|
||
1. Moving averages are prone to false touches, possibly being "whipsawed”
|
||
2. Improper parameter settings can lead to frequent trading or unclear signals
|
||
3. Only one indicator is considered, limited optimization space
|
||
|
||
These risks can be reduced by appropriately optimizing indicator parameters or adding filter conditions.
|
||
|
||
## Optimization Directions
|
||
|
||
The main aspects that this strategy can be optimized include:
|
||
|
||
1. Add volume or ATR and other indicators to ensure more reliable trading signals
|
||
2. Add Stoch indicators of multiple cycles, generate signals through composite operations
|
||
3. Increase additional judgment indicators such as MACD and KDJ to achieve multi-indicator aggregation
|
||
4. Traverse and optimize trading varieties, cycles, parameters to find the optimal configuration
|
||
|
||
## Conclusion
|
||
|
||
The overall idea of the Moving Average Indicator strategy is simple and widely used with relatively stable backtesting results, making it suitable as a beginner’s quantitative trading strategy. However, this strategy has limited optimization space as it considers limited factors and is only suitable for short-term operations. Future upgrades can be made through multi-indicator aggregation, machine learning, etc.
|
||
|
||
[/trans]
|
||
|
||
> Strategy Arguments
|
||
|
||
|
||
|
||
|Argument|Default|Description|
|
||
|----|----|----|
|
||
|v_input_1|10|Length|
|
||
|v_input_2|0.92|BuyBand|
|
||
|v_input_3|0.5|SellBand|
|
||
|v_input_4|false|Trade reverse|
|
||
|
||
|
||
> Source (PineScript)
|
||
|
||
``` pinescript
|
||
/*backtest
|
||
start: 2024-01-01 00:00:00
|
||
end: 2024-01-31 23:59:59
|
||
period: 1h
|
||
basePeriod: 15m
|
||
exchanges: [{"eid":"Futures_Binance","currency":"BTC_USDT"}]
|
||
*/
|
||
|
||
//@version=2
|
||
////////////////////////////////////////////////////////////
|
||
// Copyright by HPotter v1.0 25/09/2017
|
||
// Simple Overbought/Oversold indicator
|
||
//
|
||
// You can change long to short in the Input Settings
|
||
// WARNING:
|
||
// - For purpose educate only
|
||
// - This script to change bars colors.
|
||
////////////////////////////////////////////////////////////
|
||
strategy(title="Overbought/Oversold", shorttitle="OB/OS")
|
||
Length = input(10, minval=1)
|
||
BuyBand = input(0.92, step = 0.01)
|
||
SellBand = input(0.5, step = 0.01)
|
||
reverse = input(false, title="Trade reverse")
|
||
hline(BuyBand, color=green, linestyle=line)
|
||
hline(SellBand, color=red, linestyle=line)
|
||
xOBOS = stoch(close, high, low, Length)
|
||
nRes = iff(close > close[Length], xOBOS / 100, (100 - xOBOS) / 100)
|
||
pos = iff(nRes < SellBand, -1,
|
||
iff(nRes > BuyBand, 1, nz(pos[1], 0)))
|
||
possig = iff(reverse and pos == 1, -1,
|
||
iff(reverse and pos == -1, 1, pos))
|
||
if (possig == 1)
|
||
strategy.entry("Long", strategy.long)
|
||
if (possig == -1)
|
||
strategy.entry("Short", strategy.short)
|
||
barcolor(possig == -1 ? red: possig == 1 ? green : blue )
|
||
plot(nRes, color=blue, title="OB/OS")
|
||
```
|
||
|
||
> Detail
|
||
|
||
https://www.fmz.com/strategy/442815
|
||
|
||
> Last Modified
|
||
|
||
2024-02-26 11:10:23
|