
15 KiB
Name
基于ATR和MA组合的超级趋势交易策略Supertrend-Trading-Strategy-Based-on-ATR-and-MA-Combination
Author
ChaoZhang
Strategy Description
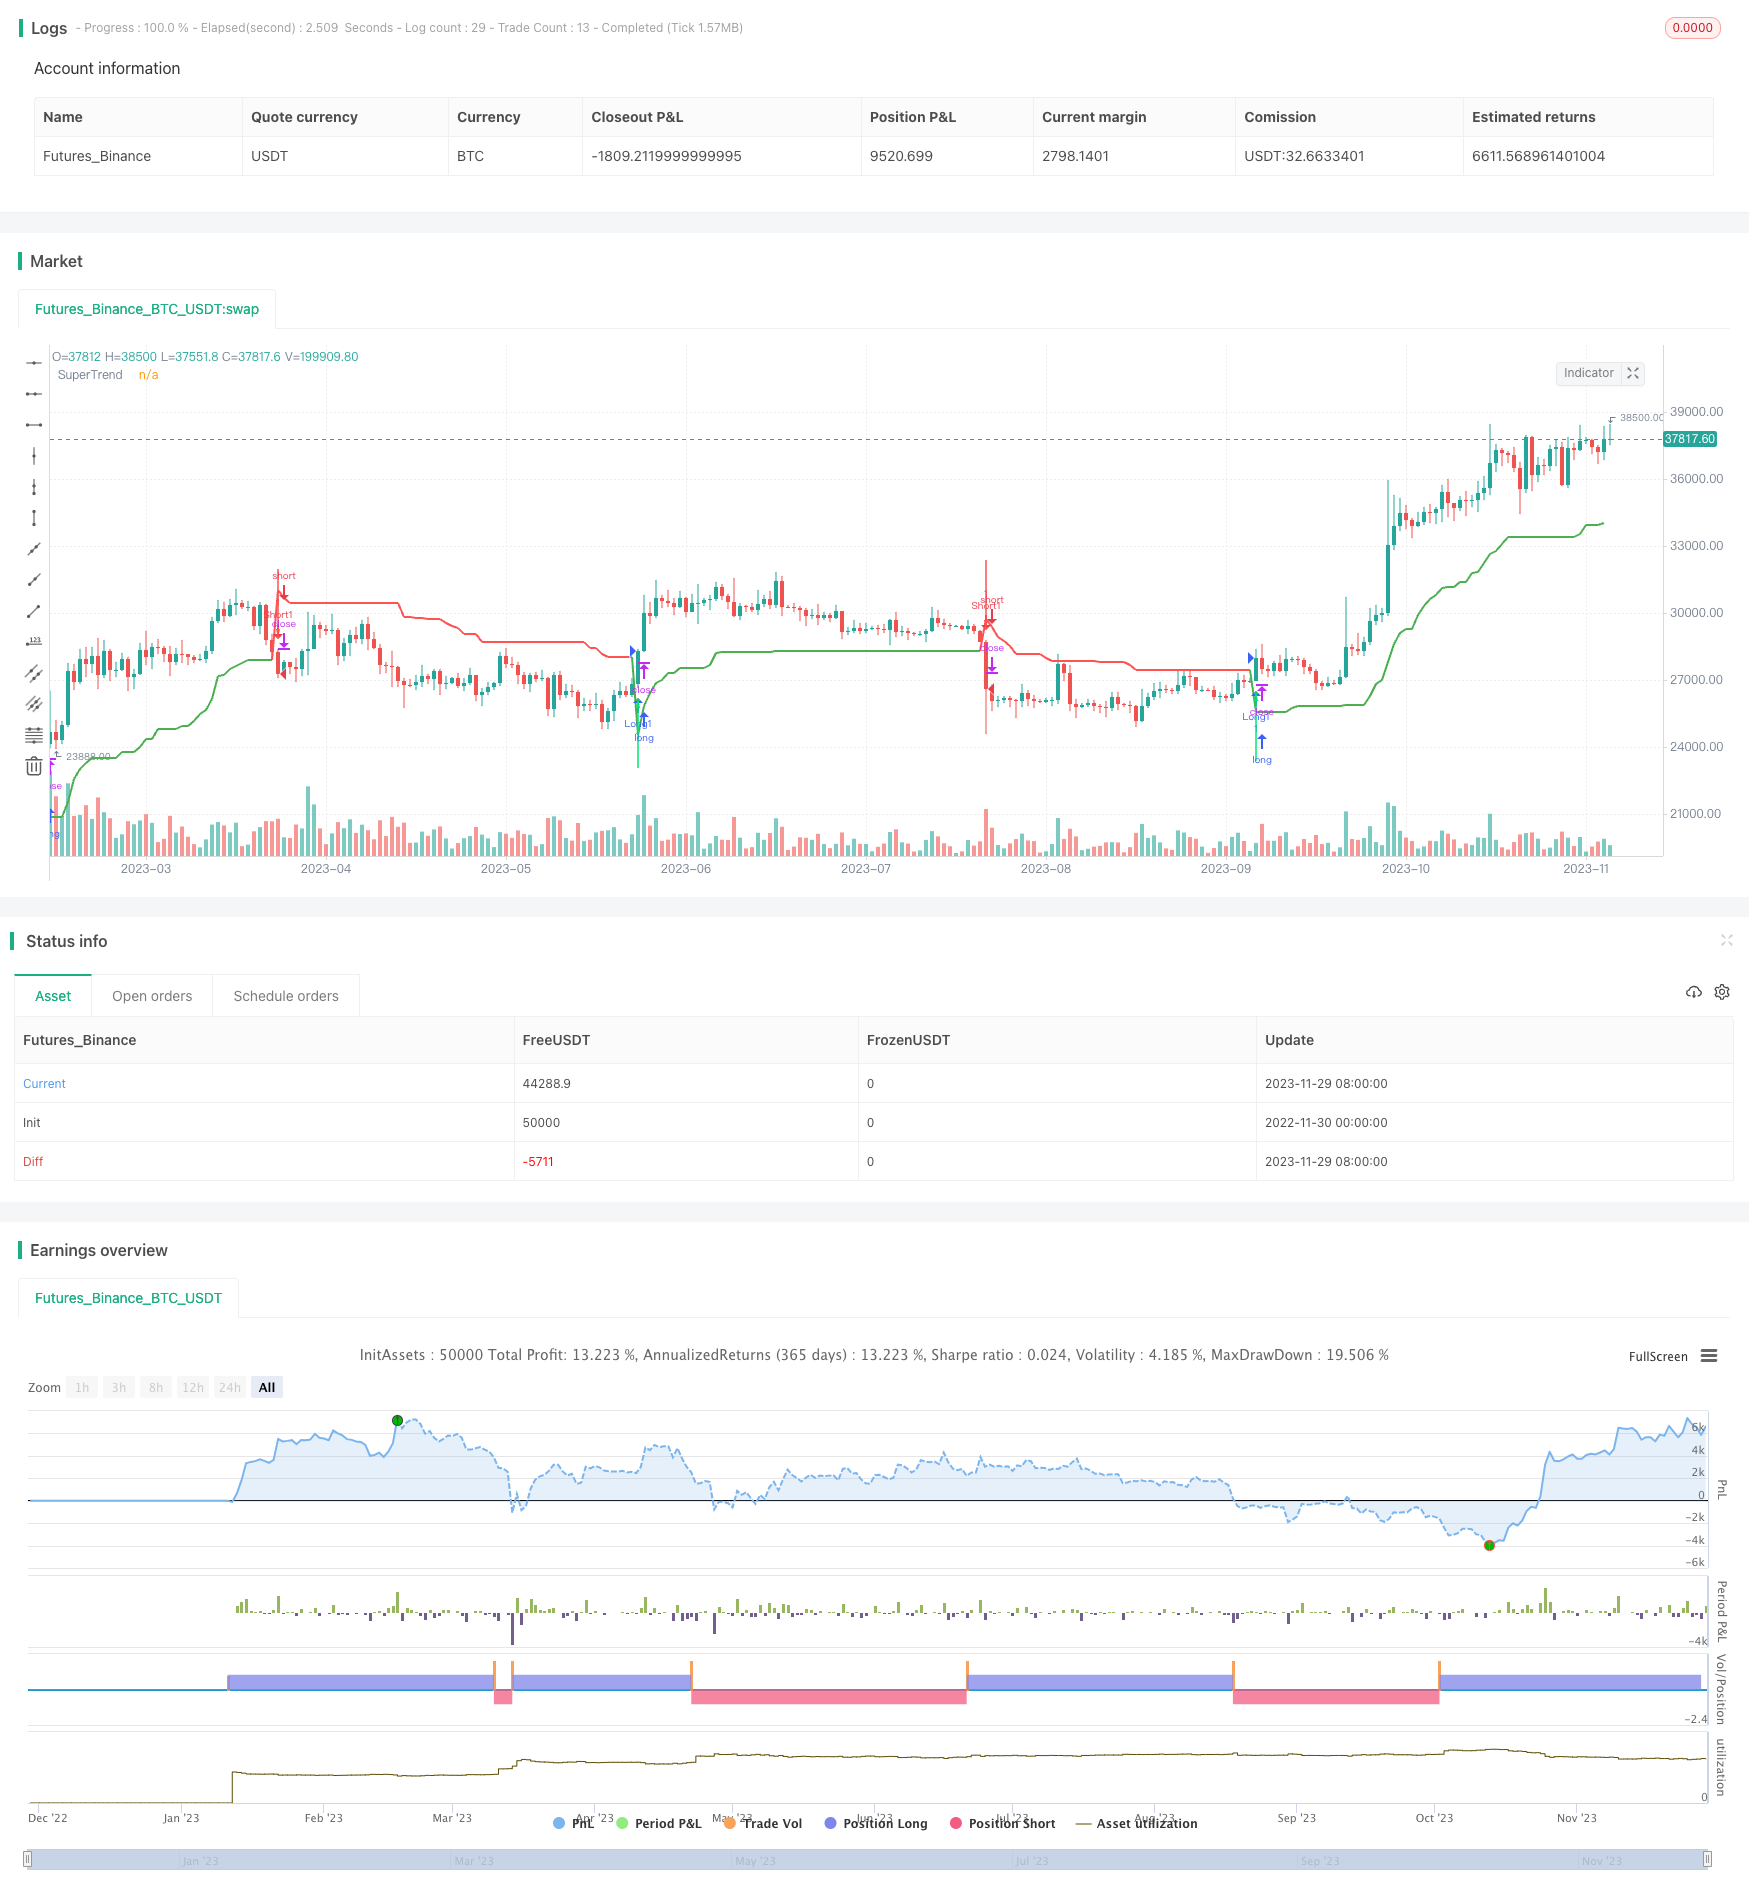
[trans]
概述
超级趋势交易策略(Supertrend Trading Strategy)是一种基于平均真实范围(ATR)和移动平均线(MA)的趋势跟踪策略。它融合了趋势跟随和突破交易的优点,旨在识别中期趋势方向并根据趋势变化生成交易信号。
该策略的主要思想是,当价格突破超级趋势通道时,表明趋势发生反转,这时进行买入或卖出。它同时设置了止损和止盈水平,以锁定收益和控制风险。
策略原理
超级趋势策略的计算过程分为以下几步:
- 计算ATR。ATR反映了一段时间内的平均波动幅度。
- 根据最高价和最低价计算通道中线。通道中线的计算公式为:(最高价+最低价)/2
- 根据ATR和用户设定的ATR乘数,计算通道上限和下限。通道上限的计算公式为:中线+(ATR×ATR乘数);通道下限的计算公式为:中线-(ATR×ATR乘数)。
- 比较收盘价与通道上下限的关系,判断趋势方向。收盘价高于通道上限为趋势向上,收盘价低于通道下限为趋势向下。
- 当价格突破趋势通道时,进行反向交易。如价格从下向上突破通道上限,产生买入信号;价格从上向下跌破通道下限,产生卖出信号。
该策略的优势在于,它同时结合了趋势跟随与趋势反转的交易方式。它既能判断大趋势方向,又能及时捕捉反转机会。此外,它还设置了止损止盈机制来控制风险。
优势分析
超级趋势策略具有以下优势:
1. 跟踪中期趋势
超级趋势通道基于ATR计算,能够有效反映中期价格波动范围。它比普通移动平均线更能跟踪中期趋势。
2. 及时捕捉趋势反转
价格突破通道时,快速发出交易信号,可以及时捕捉大趋势的反转。这为适当调整头寸,减少超期持有提供了保证。
3. 有止损止盈机制
该策略同时设定了止损位和止盈位,可以自动止损止盈。这在很大程度上减少了泛滥止损的风险,有利于把握趋势行情。
4. 实现方式简单
该策略主要运用均线和ATR指标,实现比较简单,容易掌握。这降低了实盘操作的难度。
5. 资金利用效率高
超级趋势策略追踪中期趋势,并控制单笔滑点,整体资金利用效率较高。
风险分析
超级趋势策略也存在一些潜在风险:
1. 震荡趋势机会成本较高
超级趋势策略侧重跟踪中长期趋势,在震荡整理的市场中,成本较高,可能错过部分做空机会。
2. 参数优化影响效果
ATR周期和ATR乘数的选择会对交易策略的效果产生较大影响。如果参数设置不当,会使交易信号的效果打折扣。
3. 存在一定的滞后性
超级趋势通道计算会存在一定的滞后性,这可能导致信号产生不及时。这是该策略主要需要解决的问题。
4. 需要严格的止损控制
如果止损位置设定过大或风控规避不完善,在极端行情中可能会带来较大亏损。所以必须严格执行止损策略,才能获得稳定收益。
优化方向
该超级趋势策略还具有进一步优化的空间,主要包括:
1. 结合多个ATR周期
可以结合例如10日、20日等多个ATR周期,形成组合ATR指标。这样可以提高指标的灵敏度,改善滞后问题。
2. 增加止损策略模块
此外,通过增加像三重止损、振荡止损、顺序止损等策略模块,可以进一步加强止损控制,从而降低亏损风险。
3. 优化参数设置
优化ATR周期、ATR乘数等参数设置,寻找最优参数组合,可以进一步提升策略收益。此外,参数也可以做动态优化,根据不同品种和行情阶段选择合适的数值。
4. 集成机器学习模型
最后,还可以尝试集成机器学习模型,实现趋势判断和信号产生的自动化。这可以减少主观因素的干扰,有可能进一步提高策略系统的稳定性。
总结
超级趋势交易策略综合运用均线指标和ATR指标判断中期趋势,并在趋势反转点产生交易信号,实现自动止盈止损。该策略捕捉大趋势的同时,也能及时抓住部分反转机会。它的优势主要体现在中期趋势跟踪、趋势反转识别和止损止盈控制三个方面。
但该策略也存在一定的不足,主要是对震荡行情把握不足和滞后的问题。这需要从多方面入手进行优化,比如组合ATR周期、增强止损模块、参数优化以及引入机器学习等方法。这无疑能够进一步增强该超级趋势策略的稳定性和黄金率。
||
Overview
The Supertrend trading strategy is a trend-following strategy based on Average True Range (ATR) and Moving Average (MA). It incorporates the advantages of both trend tracking and breakout trading to identify the intermediate trend direction and generate trading signals based on trend changes.
The main idea behind this strategy is to go long or short when the price breaks through the Supertrend channel, indicating a trend reversal. It also sets stop loss and take profit levels to lock in gains and control risks.
How This Strategy Works
The Supertrend calculation involves several steps:
- Calculate the ATR. The ATR reflects the average volatility over a period of time.
- Calculate the midline based on highest high and lowest low. The midline is calculated as: (Highest High + Lowest Low)/2
- Calculate the upper and lower channel based on ATR and ATR multiplier set by trader. The upper channel is calculated as: Midline + (ATR × Multiplier). The lower channel is calculated as: Midline - (ATR × Multiplier).
- Compare closing price with the upper/lower channel to determine trend direction. If close is above upper channel, trend is up. If close is below lower channel, trend is down.
- A breakout above or below the channel generates reverse trading signals. For example, a breakout above upper channel signals long entry while a breakdown below lower channel signals short entry.
The advantage of this strategy is it combines both trend following and trend reversal techniques. It identifies major trend while also being able to capture reversal opportunities in a timely manner. In addition, the stop loss/take profit mechanism helps control risks.
Strengths
The Supertrend strategy has the following strengths:
1. Track intermediate trend
The Supertrend channel is calculated based on ATR, which effectively reflects the intermediate price fluctuation range. It tracks intermediate trend better than simple moving averages.
2. Capture reversals timely
Price breakouts from the channel quickly generate trading signals so that major trend reversals can be captured in time. This allows proper repositioning to avoid overholding.
3. Have stop loss and take profit
The strategy sets predefined stop loss and take profit levels for automatic exit with risk control. This significantly reduces the risk of excessive stop loss and allows better trend following.
4. Simple to implement
The strategy mainly uses basic indicators like MA and ATR. This makes it fairly simple to understand and implement for live trading.
**5. High capital efficiency **
By tracking intermediate trends and controlling individual slippage, the Supertrend strategy provides overall high capital efficiency.
Risk Analysis
The Supertrend strategy also has some potential weaknesses:
1. Underperforms in ranging market
The strategy focuses on intermediate to long term trend trading. In ranging or consolidating markets, it tends to underperform with higher opportunity cost of missing short trades.
2. Sensitive to parameter optimization
The values chosen for ATR period and multiplier have relatively big impacts on strategy performance. Inappropriate tuning of the parameters may compromise the effectiveness of trading signals.
3. Lagging issues may exist
There can be some lagging issues with Supertrend channel calculation, causing untimely signal generation. Fixing the lagging problem should be a priority.
4. Strict stop loss management required
In extreme market conditions, improperly large stop loss allowance or inadequate risk management could lead to heavy losses. Strictly following stop loss rules is critical for consistent profitability.
Improvement Areas
There is further room to optimize this Supertrend strategy:
1. Combine multiple ATR periods
Combining ATR readings over different periods like 10-day and 20-day forms a composite indicator, which helps improve sensitivity and lagging issues.
2. Add stop loss modules
Adding more sophisticated stop loss mechanisms like triple stop loss, volatility stop loss and sequential stop loss could strengthen risk control and drawdown reduction.
3. Parameter optimization
Optimizing values for ATR period, multiplier and other inputs through quantitative methods would further lift strategy performance. Parameters can also be dynamically tuned based on different products and market regimes.
4. Integrate machine learning models
Finally, integrating machine learning models may realize automated trend recognition and signal generation, reducing reliance on subjective decisions and improving system stability.
Conclusion
The Supertrend trading strategy identifies intermediate trend direction using MA and ATR indicators, and generates trade entry and exit signals around trend reversals with automated stop loss/take profit implementation. While keeping with major trends, it also captures some reversal opportunities. The main advantages lie in intermediate trend tracking, trend reversal identification and risk control through stop loss/take profit.
However, some deficiencies also exist regarding insufficient range-bound market capture and lagging problems. Further optimizations can be explored across multiple dimensions, including using composite ATR, strengthening stop loss modules, tuning parameters, and integrating machine learning models. These enhancements will likely improve the stability and efficiency of the Supertrend strategy.
[/trans]
Strategy Arguments
| Argument | Default | Description |
|---|---|---|
| v_input_1 | 3 | Factor |
| v_input_2 | 7 | Pd |
| v_input_3 | 14 | ATR Length: |
| v_input_4 | 1.5 | Stop_Loss_Factor |
| v_input_5 | true | factor_profit |
| v_input_6 | 4 | From Month |
| v_input_7 | 10 | From Day |
| v_input_8 | 2016 | From Year |
| v_input_9 | 4 | To Month |
| v_input_10 | 10 | To Day |
| v_input_11 | 2039 | To Year |
Source (PineScript)
/*backtest
start: 2022-11-30 00:00:00
end: 2023-11-30 00:00:00
period: 1d
basePeriod: 1h
exchanges: [{"eid":"Futures_Binance","currency":"BTC_USDT"}]
*/

//@version=3
strategy("Supertrend V1.0 - Buy or Sell Signal",overlay=true)
Factor=input(3, minval=1,maxval = 100)
Pd=input(7, minval=1,maxval = 100)
//Calculating ATR
atrLength = input(title="ATR Length:",  defval=14, minval=1)
Stop_Loss_Factor = input(1.5, minval=0,step=0.01)
factor_profit = input(1.0, minval=0,step=0.01)

// === INPUT BACKTEST RANGE ===
FromMonth = input(defval = 4, title = "From Month", minval = 1, maxval = 12)
FromDay   = input(defval = 10, title = "From Day", minval = 1, maxval = 31)
FromYear  = input(defval = 2016, title = "From Year", minval = 2009)
ToMonth   = input(defval = 4, title = "To Month", minval = 1, maxval = 12)
ToDay     = input(defval = 10, title = "To Day", minval = 1, maxval = 31)
ToYear    = input(defval = 2039, title = "To Year", minval = 2017)

// === FUNCTION EXAMPLE ===
start     = timestamp(FromYear, FromMonth, FromDay, 00, 00)  // backtest start window
finish    = timestamp(ToYear, ToMonth, ToDay, 23, 59)        // backtest finish window
window()  => time >= start and time <= finish ? true : false // create function "within window of time"


// Calculate ATR
atrValue=atr(atrLength)
decimals = abs(log(syminfo.mintick) / log(10))
Atr = atrValue
if(decimals == 5)
    Atr := atrValue * 10000
if(decimals == 4)
    Atr := atrValue * 1000
if(decimals == 3)
    Atr := atrValue * 100
if(decimals == 2)
    Atr := atrValue * 10


//VJ2 Supertrend

Up=hl2-(Factor*atr(Pd))
Dn=hl2+(Factor*atr(Pd))

TrendUp = 0.0
TrendUp:=close[1]>TrendUp[1]? max(Up,TrendUp[1]) : Up
TrendDown = 0.0
TrendDown:=close[1]<TrendDown[1]? min(Dn,TrendDown[1]) : Dn

Trend = 0.0
Trend := close > TrendDown[1] ? 1: close< TrendUp[1]? -1: nz(Trend[1],1)
Tsl = 0.0
Tsl := Trend==1? TrendUp: TrendDown

linecolor = Trend == 1 ? green : red

plot(Tsl, color = linecolor , style = line , linewidth = 2,title = "SuperTrend")

plotshape(cross(close,Tsl) and close>Tsl , "Up Arrow", shape.triangleup,location.belowbar,green,0,0)
plotshape(cross(Tsl,close) and close<Tsl , "Down Arrow", shape.triangledown , location.abovebar, red,0,0)
//plot(Trend==1 and Trend[1]==-1,color = linecolor, style = circles, linewidth = 3,title="Trend")

plotarrow(Trend == 1 and Trend[1] == -1 ? Trend : na, title="Up Entry Arrow", colorup=lime, maxheight=60, minheight=50, transp=0)
plotarrow(Trend == -1 and Trend[1] == 1 ? Trend : na, title="Down Entry Arrow", colordown=red, maxheight=60, minheight=50, transp=0)


//Strategy
Trend_buy = Trend == 1
Trend_buy_prev = Trend[1] == -1
algo_buy_pre = Trend_buy and Trend_buy_prev
algo_buy = algo_buy_pre == 1 ? 1 : na
Trend_sell= Trend == -1
Trend_sell_prev = Trend[1] == 1
algo_sell_pre = Trend_sell and Trend_sell_prev
algo_sell = algo_sell_pre == 1 ? 1:na

strategy.entry("Long1", strategy.long, when= window() and algo_buy==1)

strategy.entry("Short1", strategy.short, when=window() and algo_sell==1)

bought = strategy.position_size > strategy.position_size
sold = strategy.position_size < strategy.position_size

longStop = Stop_Loss_Factor * valuewhen(bought, Atr, 0)
shortStop = Stop_Loss_Factor * valuewhen(sold, Atr, 0)
longProfit = factor_profit * longStop
shortProfit = factor_profit * shortStop


if(decimals == 5)
    longStop := longStop *100000
    longProfit := longProfit *100000
if(decimals == 4)
    longStop := longStop * 10000
    longProfit := longProfit * 10000
if(decimals == 3)
    longStop := longStop * 1000
    longProfit := longProfit * 1000
if(decimals == 2)
    longStop := longStop * 100
    longProfit := longProfit *100
if(decimals == 5)
    shortStop := shortStop * 100000
    shortProfit := shortProfit * 100000
if(decimals == 4)
    shortStop := shortStop * 10000
    shortProfit := shortProfit * 10000
if(decimals == 3)
    shortStop := shortStop * 1000
    shortProfit := shortProfit * 1000
if(decimals == 2)
    shortStop := shortStop * 100
    shortProfit := shortProfit * 100

strategy.exit("Exit Long", from_entry = "Long1", loss =longStop, profit = longProfit)
strategy.exit("Exit Short", from_entry = "Short1", loss =shortStop, profit = shortProfit)
Detail
https://www.fmz.com/strategy/433946
Last Modified
2023-12-01 16:40:27