
9.7 KiB
Name
TAM日内RSI交易策略TAM-Intraday-RSI-Trading-Strategy
Author
ChaoZhang
Strategy Description
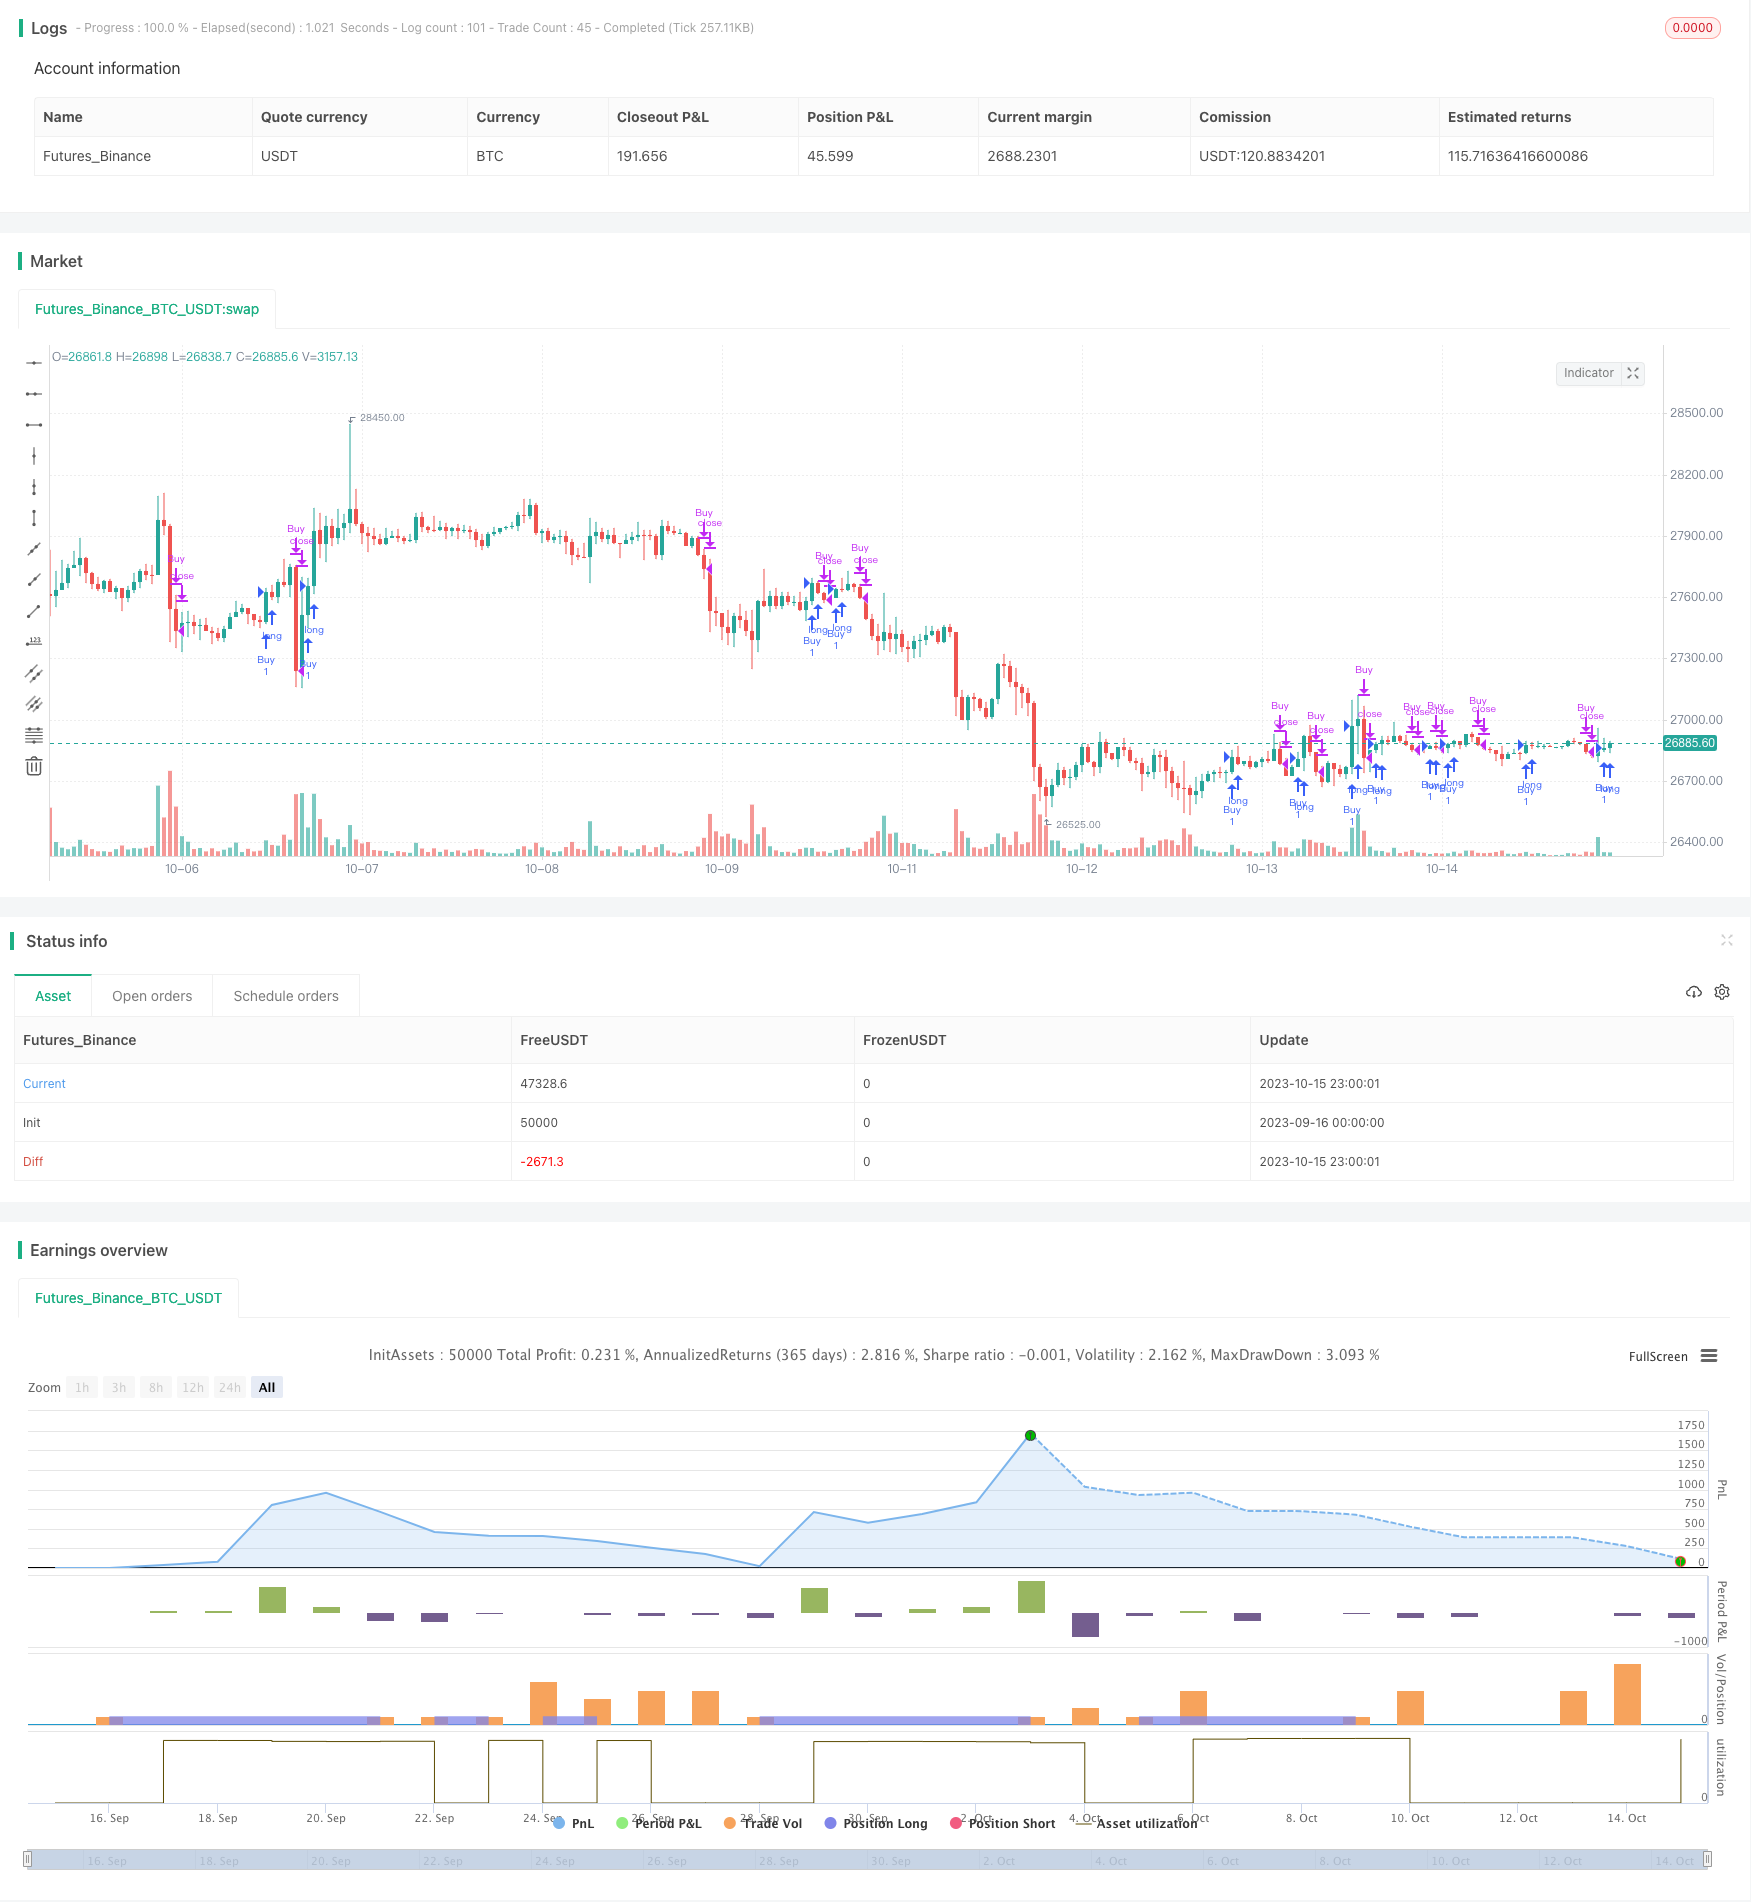
[trans]
概述
TAM日内RSI交易策略利用RSI指标的多周期交叉实现日内交易入场和出场。策略在多空环境下都表现不俗,能够有效利用RSI指标捕捉市场的超买超卖现象,在行情出现反转时进行逆势操作。
策略原理
该策略使用两个RSI指标实现买入和卖出信号。买入信号使用短周期2日RSI和中周期14日RSI,当短周期或中周期RSI上穿50时产生买入信号。卖出信号使用短周期7日RSI和中周期50日RSI,当短周期或中周期RSI下破50时产生卖出信号。
策略同时要求RSI值实际上穿过50,而不仅仅是产生交叉,这可以过滤掉许多假信号。具体来说,买入需要同时满足以下条件:
- 2日RSI上穿50
- 2日RSI实际大于50
- 14日RSI上穿50
- 14日RSI实际大于50
卖出条件也类似:
- 7日RSI下穿50
- 7日RSI实际小于50
- 50日RSI下穿50
- 50日RSI实际小于50
这样的多重过滤可以确保只在RSI显示超买超卖迹象时才发出信号,不会被小幅震荡误导。
策略优势分析
TAM日内RSI策略具有以下优势:
-
使用双RSI实现多时间框架分析,可以有效过滤市场噪音,只在显著趋势转换点才入场。
-
仅在RSI实际越过关键阈值时才发出信号,避免被假突破误导。
-
采用不同参数的RSI判断入场和出场,可以更精确地捕捉反转点位。
-
日内交易时间段内,RSI指标表现较为稳定可靠,适合日内交易策略。
-
可配置参数灵活,可以针对不同市场调整RSI参数,获得更好的绩效。
-
逻辑清晰简单,容易理解实现,适合量化交易。
风险分析
该策略也存在一些风险:
-
日内交易具有过夜 gaps 的风险,gaps 会直接跳过策略的止损设置。
-
RSI容易发生背离,必须 combine 其他指标进行验证。
-
日内时间段市场波动较大,止损设置需要宽松但又不宽松过头。
-
参数优化存在过优化风险,必须在不同市场中进行验证。
-
量化回测不能完全反映实盘交易效果,实盘时需适当调整策略。
优化方向
该策略可以从以下方面进行优化:
-
结合其他指标确认RSI信号,例如KDJ、MACD等。
-
增加成交量的过滤,只在成交量放大的情况下考虑信号。
-
优化策略参数,针对更短的日内周期进行参数测试。
-
增加机器学习模型辅助决策,利用算法自动发现更好的参数。
-
策略艺术化,结合关键支撑阻力位、图形形态等技术分析方法。
-
优化止损策略,利用ATR、振幅等方法设置动态止损。
总结
TAM日内RSI策略整体来说是一个非常实用的量化策略。它利用RSI指标的多时间框架评估有效判断超买超卖情况,配合严格的入场出场规则可以过滤假信号。在参数优化和风险管理到位的情况下,该策略可以产生稳定的交易信号,实现良好的交易效果。总的来说,该策略逻辑清晰易于实现,值得量化交易者进行测试验证。
||
Overview
The TAM intraday RSI trading strategy utilizes the crossover of RSI indicators across different periods to generate intraday entry and exit signals. The strategy performs well in both bull and bear environments by effectively capitalizing on overbought and oversold conditions revealed by the RSI indicator and making counter trend trades when the market shows signs of reversal.
Strategy Logic
The strategy employs two RSI indicators to generate buy and sell signals. The buy signal uses a short period 2-day RSI and a medium period 14-day RSI, triggering a buy when either the short or medium RSI crosses above 50. The sell signal uses a short period 7-day RSI and a medium period 50-day RSI, triggering a sell when either the short or medium RSI crosses below 50.
The strategy also requires the RSI to actually move past the 50 threshold, not just cross it, which helps filter out many false signals. Specifically, a buy requires meeting the following conditions:
- 2-day RSI crosses above 50
- 2-day RSI is greater than 50
- 14-day RSI crosses above 50
- 14-day RSI is greater than 50
The sell conditions are similar:
- 7-day RSI crosses below 50
- 7-day RSI is less than 50
- 50-day RSI crosses below 50
- 50-day RSI is less than 50
Such multi-layer filtering ensures signals are only triggered when RSI shows clear overbought/oversold indications, and will not be misled by minor oscillations.
Advantage Analysis
The TAM intraday RSI strategy has the following advantages:
-
Utilizing dual RSI provides multi timeframe analysis, filtering market noise effectively and only entering at significant trend reversal points.
-
Requiring actual RSI value to breach key threshold avoids false breakout signals.
-
Adopting RSI of differing parameters for entry and exit can pinpoint reversal timing more precisely.
-
RSI exhibits relatively stable performance within intraday trading windows, suitable for intraday strategies.
-
Customizable parameters allow adjusting RSI inputs for different markets and better results.
-
Simple and clear logic makes it easy to understand and implement for algo trading.
Risk Analysis
Some risks also exist with the strategy:
-
Intraday trading has overnight gap risk that can skip stop loss settings.
-
RSI divergence occurs frequently and must be validated with other indicators.
-
High volatility in intraday periods means stop loss must be wide yet not too wide.
-
Parameter optimization risks overfitting, requiring testing across varying markets.
-
Backtesting limitations cannot fully reflect real trading, requiring tuning for live performance.
Optimization Directions
The strategy can be improved in the following aspects:
-
Add confirmation with other indicators like KDJ, MACD etc.
-
Implement volume filter to only consider signals on increasing volume.
-
Optimize parameters for even shorter intraday cycles.
-
Assist decision with machine learning models to find optimal parameters algorithmically.
-
Artistic touch combining key S/R levels, chart patterns from technical analysis.
-
Improve stop loss with dynamic ATR, volatility based methods.
Conclusion
Overall the TAM intraday RSI strategy is a very practical quant strategy. It effectively assesses overbought and oversold conditions using the multi timeframe RSI evaluation and generates solid signals when combined with strict entry/exit rules to filter out false signals. With proper optimization and risk management, the strategy can produce stable trade signals and achieve good results. Its clear and straightforward logic makes it easy to implement and test for algo traders.
[/trans]
Strategy Arguments
| Argument | Default | Description |
|---|---|---|
| v_input_bool_1 | true | (?Backtest Time Period)Filter Date Range of Backtest |
| v_input_1 | timestamp(2020-01-01) | Start date |
| v_input_2 | 2 | (?Buy configuration)RSI Buy Length 1 (default 2) |
| v_input_3 | 14 | RSI Buy Length 2 (default 14) |
| v_input_4 | 50 | RSI Buy Value Signal (default 50) |
| v_input_5 | 7 | (?Close configuration)RSI Close Length 1 (default 7) |
| v_input_6 | 50 | RSI Close Length 2 (default 50) |
| v_input_7 | 50 | RSI Close Value Signal (default 50) |
Source (PineScript)
/*backtest
start: 2023-09-16 00:00:00
end: 2023-10-16 00:00:00
period: 1h
basePeriod: 15m
exchanges: [{"eid":"Futures_Binance","currency":"BTC_USDT"}]
*/

// This source code is subject to the terms of the Mozilla Public License 2.0 at https://mozilla.org/MPL/2.0/
// © DvKel

//@version=5
strategy("TAM - RSI Strategy", overlay = true)

// Input parameters
useDateFilter = input.bool(true, title="Filter Date Range of Backtest",  group="Backtest Time Period")
startDate = input(timestamp("2020-01-01"), title = "Start date", group = "Backtest Time Period")
buyRsiLength1 = input(2, title = "RSI Buy Length 1 (default 2)", group="Buy configuration")
buyRsiLength2 = input(14, title = "RSI Buy Length 2 (default 14)", group="Buy configuration")
buyRsiValue = input(50, title = "RSI Buy Value Signal (default 50)", group="Buy configuration")
closeRsiLength1 = input(7, title = "RSI Close Length 1 (default 7)", group="Close configuration")
closeRsiLength2 = input(50, title = "RSI Close Length 2 (default 50)", group="Close configuration")
closeRsiValue = input(50, title = "RSI Close Value Signal (default 50)", group="Close configuration")

// Check timeframe
inTradeWindow = true

// Calculate RSI
rsiBuy1Value =  ta.rsi(close, buyRsiLength1)
rsiBuy2Value = ta.rsi(close, buyRsiLength2)
rsiClose1Value =  ta.rsi(close, closeRsiLength1)
rsiClose2Value = ta.rsi(close, closeRsiLength2)

// Strategy conditions
//(ta.crossover(rsiBuy1Value, buyRsiValue) or ta.crossover(rsiBuy2Value, buyRsiValue)) and
//8ta.crossunder(rsiClose1Value, closeRsiValue) or ta.crossunder(rsiClose2Value, closeRsiValue)) and
buyCondition = (ta.crossover(rsiBuy1Value, buyRsiValue) or ta.crossover(rsiBuy2Value, buyRsiValue)) and rsiBuy1Value > buyRsiValue and rsiBuy2Value > buyRsiValue
closeCondition = (ta.crossunder(rsiClose1Value, closeRsiValue) or ta.crossunder(rsiClose2Value, closeRsiValue)) and rsiClose1Value < closeRsiValue and rsiClose2Value < closeRsiValue


// Strategy actions
if (inTradeWindow  and buyCondition)
    strategy.entry("Buy", strategy.long)


if (inTradeWindow and closeCondition)
    strategy.close("Buy")

// Plot RSI and overbought/oversold levels
plotchar(rsiBuy1Value, title = "RSI-Buy1", color = color.green)
plotchar(rsiBuy2Value, title = "RSI-Buy2", color = color.lime)
plotchar(rsiClose1Value, title = "RSI-Close1", color = color.red)
plotchar(rsiClose2Value, title = "RSI-Close2", color = color.fuchsia)
Detail
https://www.fmz.com/strategy/429504
Last Modified
2023-10-17 16:58:46