
14 KiB
Name
SAR动态追踪突破三均线策略Parabolic-SAR-Dynamic-Breakout-Triple-SMMA-Strategy
Author
ChaoZhang
Strategy Description
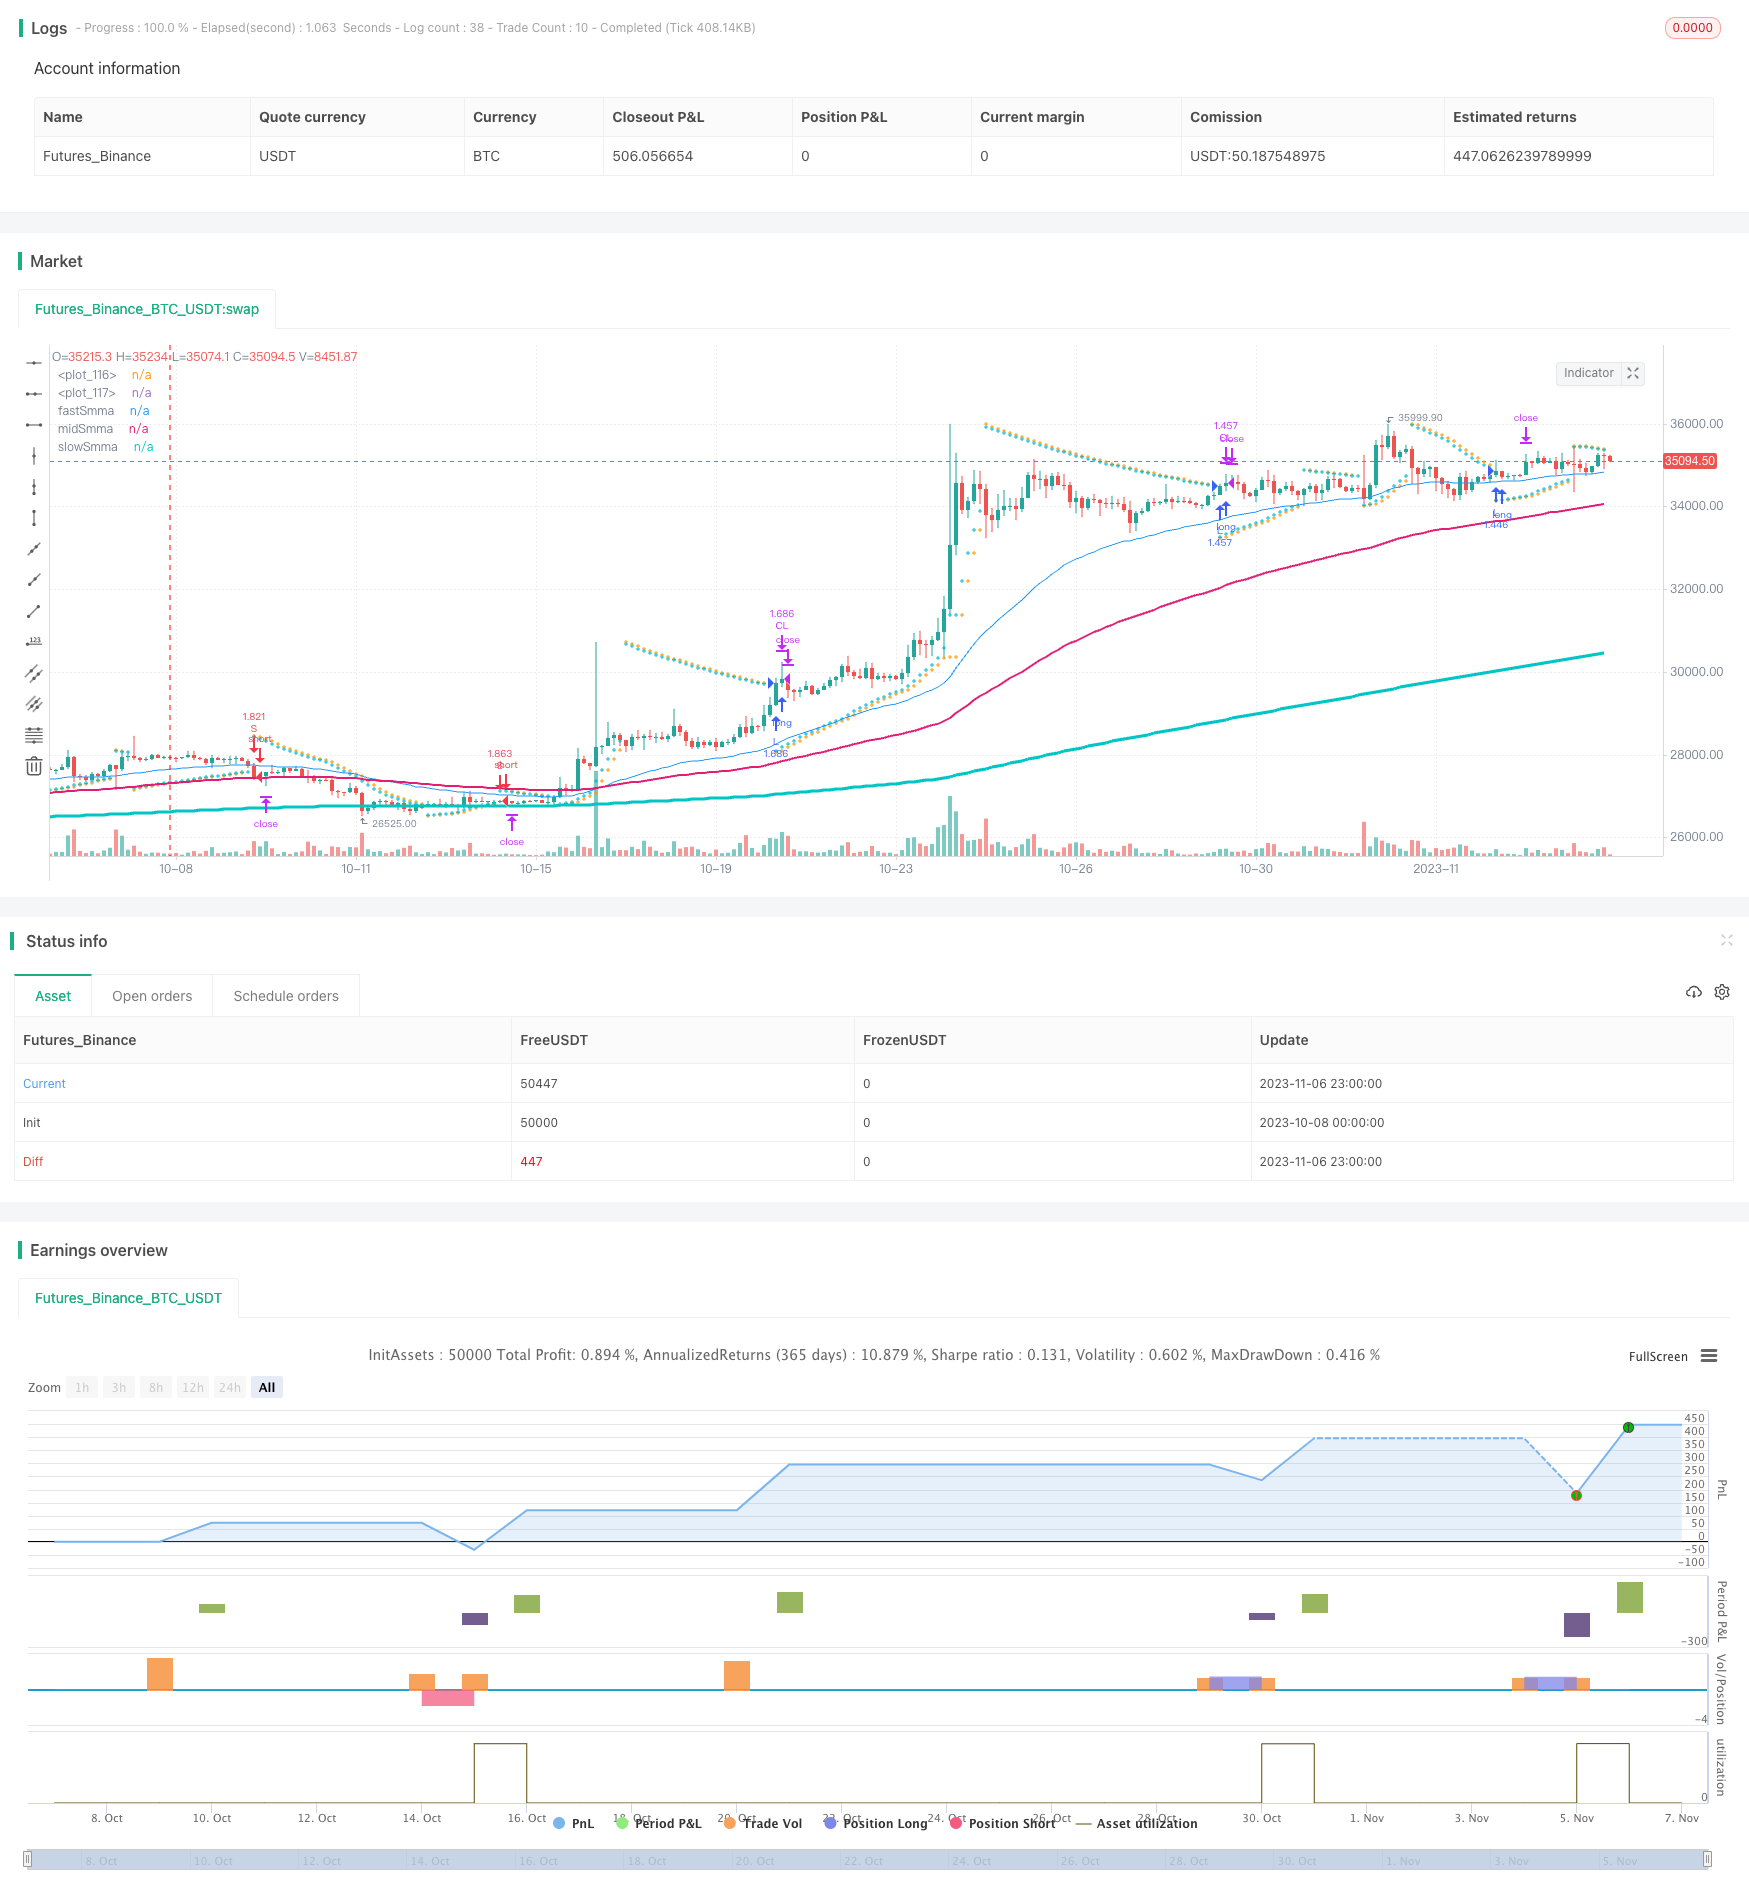 [trans]
概述
这是一个将抛物线SAR指标与三条不同周期的SMMA均线相结合的突破交易策略。它在三条均线全面上涨时做多,三条均线全面下跌时做空,同时结合SAR指标判断趋势方向,在SAR指标转向时进行反向开仓。该策略同时支持止损和止盈。
策略原理
该策略主要基于以下几点:
-
使用抛物线SAR指标判断当前趋势方向。SAR指标能够动态追踪价格变化,判断多头趋势和空头趋势。
-
设置三条不同周期的SMMA均线(快线21周期、中线50周期、慢线200周期)。当三条均线全部上涨时,视为多头趋势形成;当三条均线全部下跌时,视为空头趋势形成。
-
在SAR指标发生向下转向时,如果三条均线全面上涨,则做多入场。
-
在SAR指标发生向上转向时,如果三条均线全面下跌,则做空入场。
-
设置止损和止盈。止损以SAR指标作为动态止损位,止盈设置为入场价格的一定比例。
具体来说,策略首先判断当前BAR的SAR指标是否发生转向。如果SAR从向上转向向下,并且三条均线全面上涨,则做多;如果SAR从向下转向向上,并且三条均线全面下跌,则做空。
在持有头寸后,止损线设置为下一个BAR的SAR指标价位,以SAR作为动态追踪止损。止盈设置为入场价格的10%。当价格达到止盈或止损水平时,平仓退出。
优势分析
这种策略结合趋势判断指标和多时间周期均线的优点,可以在趋势发生转折时及时入场,同时通过均线过滤假突破。主要优势有:
-
SAR指标能够动态判断趋势转向,快速捕捉趋势转换机会。
-
三条均线能够有效过滤市场噪音,避免假突破。
-
采用SMMA均线,曲线更平滑,减少均线震荡对交易的干扰。
-
结合止损止盈设置,可以控制单次亏损,同时锁定部分利润。
-
策略参数设置灵活,可针对不同市场调整参数,优化策略效果。
风险分析
该策略也存在一些风险,主要包括:
-
在震荡趋势中,SAR指标可能发生多次频繁转向,导致过于频繁交易而增加交易费用。
-
三条均线 Settings 可能不一定完全适合所有品种,需要根据具体品种行情进行调整。
-
止损设置为下一个BAR的SAR价位存在时间滞后,可能扩大损失。
-
稳定趋势中假突破使SAR转向的问题,可以通过调整参数平滑SAR曲线来缓解。
-
均线Settings不当也可能错过趋势或产生错误信号,需要仔细测试优化。
对应风险,可以从以下几点进行优化:
-
根据不同品种波动程度调整SAR参数,降低频繁转向概率。
-
调整三条均线的参数,使其更贴近不同品种的特点。
-
优化止损策略,例如采用小止损、移动止损等方式。
-
在交易频繁市场使用限价单止损,避免滑点扩大损失。
-
做好参数调优测试,评估均线和SAR参数对策略效果的影响。
优化方向
根据以上分析,该策略可以从以下几个方面进行优化:
-
优化SAR参数设置,平滑SAR曲线,降低曲线转向频率,避免过度交易。
-
调整三条均线的长度,使其更符合具体交易品种的特性,发挥更好的趋势过滤作用。
-
采用动态止损策略,例如移动止损、挂单小止损等,减少止损带来的损失。
-
在高频交易市场使用限价单止损,降低止损滑点损失。
-
添加其他指标进行过滤,如RSI,KD等,提高信号质量,减少假突破概率。
-
优化入场条件,可考虑在SAR转向时同时检验K线形态,避免低质量信号。
-
添加重新入场条件,在止损后价格继续向有利方向运行时再次入场。
-
完善止盈策略,例如移动止盈、部分止盈、级差止盈等,提高盈利能力。
-
基于回测结果对参数进行优化,评估参数对整体策略效果的影响。
总结
总的来说,这是一个结合趋势跟踪指标SAR和均线的简单实用的突破策略。它利用SAR判断趋势转向的灵敏度,以及均线的滤波作用,在趋势转折点快速入场。同时设置止损止盈来控制风险和锁定利润。通过调整参数 SETTINGS 及优化入场出场条件,可以获得较好的策略效果。但交易者需要注意控制过度交易和假突破等问题,针对不同品种进行参数调优和策略测试,从而获得稳定的交易系统。
||
Overview
This is a breakout trading strategy combining the parabolic SAR indicator and triple SMMA lines with different periods. It goes long when all three SMMA lines are rising and goes short when all are falling, while using the SAR indicator to determine the trend direction and taking counter trend entries when SAR flips directions. The strategy also incorporates stop loss and take profit.
Strategy Logic
The strategy is based on the following key points:
-
Using the parabolic SAR indicator to determine the current trend direction. SAR can dynamically track price changes and identify uptrends and downtrends.
-
Setting up three SMMA lines with different periods (fast line 21, mid line 50, slow line 200). When all three lines are rising, it signals an uptrend. When all are falling, it signals a downtrend.
-
Going long when SAR flips down while all three SMMA lines are rising.
-
Going short when SAR flips up while all three SMMA lines are falling.
-
Incorporating stop loss based on SAR and take profit at certain percentage of entry price.
Specifically, the strategy first checks if SAR flips directions on the current bar. If SAR flips from up to down while SMMAs are rising, it goes long. If SAR flips from down to up while SMMAs are falling, it goes short.
After entry, the stop loss is set at the SAR price on the next bar, using SAR as a dynamic trailing stop loss. Take profit is set at 10% of the entry price. When price reaches either take profit or stop loss levels, the position is closed.
Advantage Analysis
This strategy combines the advantage of a trend-following indicator and multiple time frame moving averages, allowing timely entries at trend reversals while filtering out false breaks with SMMAs. The main advantages are:
-
SAR can quickly detect trend changes and capture reversal opportunities.
-
The triple SMMAs effectively filter out market noise and avoid false breaks.
-
Using SMMA results in smoother curves and less interference from MA whipsaws.
-
Incorporating stop loss and take profit helps control single trade loss and lock in partial profits.
-
Flexible parameter settings allow optimization for different markets.
Risk Analysis
There are also some risks to consider:
-
SAR may flip frequently during choppy trends, increasing costs from excessive trading.
-
SMMA settings may not fit all instruments well, requiring individual optimization.
-
SAR stop loss has time lag, potentially increasing losses.
-
SAR may flip on false breaks in steady trends. Smoothening SAR parameters can help.
-
Poor SMMA settings may cause missed trends or bad signals. Careful testing is needed.
To address the risks, optimizations can focus on:
-
Adjusting SAR parameters based on volatility to reduce flips.
-
Tuning SMMA periods to fit instrument characteristics.
-
Improving stop loss, e.g. with trailing or limit orders.
-
Using limit orders for stop loss in active trading.
-
Extensive testing and tuning of parameters.
Optimization Directions
Based on the above analysis, optimizations may involve:
-
Optimizing SAR parameters for smoother curves and fewer flips.
-
Adjusting SMMA lengths to match trading instruments.
-
Employing dynamic stop loss like trailing stops or limit orders.
-
Using limit orders for stop loss in high-frequency trading.
-
Adding filters like RSI, KD to improve signal quality.
-
Improving entry conditions, e.g. checking candle patterns with SAR flips.
-
Adding re-entry conditions after stop loss triggers.
-
Enhancing take profit with trailing, partial close, staggering levels.
-
Parameter tuning based on backtest results and sensitivity analysis.
Summary
In summary, this is a simple and practical breakout strategy combining the sensitivity of SAR in catching trend changes and the filtering effect of moving averages. It can identify trend reversal points fast. The use of stop loss and take profit helps control risks and lock in profits. Further optimizations on parameter settings, entry/exit rules, and robustness against false breaks can enhance strategy performance for different trading instruments.
[/trans]
Strategy Arguments
| Argument | Default | Description |
|---|---|---|
| v_input_float_1 | 0.02 | (?SAR)start |
| v_input_float_2 | 0.02 | increment |
| v_input_float_3 | 0.2 | maximum |
| v_input_float_4 | 0.1 | (?Stop Loss and Take Profit)Take Profit (%) |
| v_input_float_5 | true | StopLoss (%) |
| v_input_int_1 | 21 | (?Smooth Moving Average)Fast Length |
| v_input_int_2 | 50 | Mid Length |
| v_input_int_3 | 200 | Slow Length |
| v_input_1_close | 0 | Source: close |
Source (PineScript)
/*backtest
start: 2023-10-08 00:00:00
end: 2023-11-07 00:00:00
period: 3h
basePeriod: 15m
exchanges: [{"eid":"Futures_Binance","currency":"BTC_USDT"}]
*/

//@version=5
strategy(title="SAR + 3SMMA with SL & TP", overlay=true, calc_on_order_fills=false, calc_on_every_tick=false, default_qty_type=strategy.percent_of_equity, default_qty_value=100, currency=currency.USD, commission_type= strategy.commission.percent, commission_value=0.03)
start = input.float(0.02, step=0.01, group="SAR")
increment = input.float(0.02, step=0.01, group="SAR")
maximum = input.float(0.2, step=0.01, group="SAR")

//Take Profit Inputs
take_profit = input.float(title="Take Profit (%)", minval=0.0, step=0.1, defval = 0.1, group="Stop Loss and Take Profit", inline="TP") * 0.01

//Stop Loss Inputs
stop_loss = input.float(title="StopLoss (%)", minval=0.0, step=0.1, defval=1, group="Stop Loss and Take Profit", inline="SL") * 0.01

// Smooth Moving Average
fastSmmaLen = input.int(21, minval=1, title="Fast Length", group = "Smooth Moving Average")
midSmmaLen = input.int(50, minval=1, title="Mid Length", group = "Smooth Moving Average")
slowSmmaLen = input.int(200, minval=1, title="Slow Length", group = "Smooth Moving Average")

src = input(close, title="Source", group = "Smooth Moving Average")

smma(ma, src, len) =>
    smma = 0.0
    smma := na(smma[1]) ? ma : (smma[1] * (len - 1) + src) / len
    smma

fastSma = ta.sma(src, fastSmmaLen)
midSma = ta.sma(src, midSmmaLen)
slowSma = ta.sma(src, slowSmmaLen)

fastSmma = smma(fastSma, src, fastSmmaLen)
midSmma = smma(midSma, src, midSmmaLen)
slowSmma = smma(slowSma, src, slowSmmaLen)

isSmmaUpward = ta.rising(fastSmma, 1) and ta.rising(midSmma, 1) and ta.rising(slowSmma, 1)

var bool uptrend = na
var float EP = na
var float SAR = na
var float AF = start
var float nextBarSAR = na

if bar_index > 0
	firstTrendBar = false
	SAR := nextBarSAR
	if bar_index == 1
		float prevSAR = na
		float prevEP = na
		lowPrev = low[1]
		highPrev = high[1]
		closeCur = close
		closePrev = close[1]
		if closeCur > closePrev
			uptrend := true
			EP := high
			prevSAR := lowPrev
			prevEP := high
		else
			uptrend := false
			EP := low
			prevSAR := highPrev
			prevEP := low
		firstTrendBar := true
		SAR := prevSAR + start * (prevEP - prevSAR)
	if uptrend
		if SAR > low
			firstTrendBar := true
			uptrend := false
			SAR := math.max(EP, high)
			EP := low
			AF := start
	else
		if SAR < high
			firstTrendBar := true
			uptrend := true
			SAR := math.min(EP, low)
			EP := high
			AF := start
	if not firstTrendBar
		if uptrend
			if high > EP
				EP := high
				AF := math.min(AF + increment, maximum)
		else
			if low < EP
				EP := low
				AF := math.min(AF + increment, maximum)
	if uptrend
		SAR := math.min(SAR, low[1])
		if bar_index > 1
			SAR := math.min(SAR, low[2])
	else
		SAR := math.max(SAR, high[1])
		if bar_index > 1
			SAR := math.max(SAR, high[2])
	nextBarSAR := SAR + AF * (EP - SAR)

sarIsUpTrend = uptrend ? true : false

sarFlippedDown = sarIsUpTrend and not sarIsUpTrend[1] ? true : false
sarFlippedUp = not sarIsUpTrend and sarIsUpTrend[1] ? true : false


longEntryCondition = isSmmaUpward and sarFlippedDown
shortEntryCondition = not isSmmaUpward and sarFlippedUp

if(longEntryCondition)
    strategy.entry("L", strategy.long, stop=nextBarSAR, comment="L")

if(shortEntryCondition)
    strategy.entry("S", strategy.short, stop=nextBarSAR, comment="S")


strategy.exit("CL", when=strategy.position_size > 0, limit=strategy.position_avg_price * (1+take_profit), stop=strategy.position_avg_price*(1-stop_loss))
strategy.exit("CS", when=strategy.position_size < 0, limit=strategy.position_avg_price * (1-take_profit), stop=strategy.position_avg_price*(1+stop_loss))


plot(SAR, style=plot.style_cross, linewidth=1, color=color.orange)
plot(nextBarSAR, style=plot.style_cross, linewidth=1, color=color.aqua)
plot(series = fastSmma, title="fastSmma", linewidth=1)
plot(series = midSmma, title="midSmma", linewidth=2)
plot(series = slowSmma, title="slowSmma", linewidth=3)
plotchar(series = isSmmaUpward, title="isSmmaUpward", char='')
plotchar(series=sarIsUpTrend, title="sarIsUpTrend", char='')
plotchar(series=sarFlippedUp, title="sarFlippedUp", char='')
plotchar(series=sarFlippedDown, title="sarFlippedDown", char='')
plotchar(series=longEntryCondition, title="longEntryCondition", char='')
plotchar(series=shortEntryCondition, title="shortEntryCondition", char='')
plotchar(series=strategy.position_size > 0, title="inLong", char='')
plotchar(series=strategy.position_size < 0, title="inShort", char='')


//plot(strategy.equity, title="equity", color=color.red, linewidth=2, style=plot.style_areabr)
Detail
https://www.fmz.com/strategy/431495
Last Modified
2023-11-08 11:53:09