
11 KiB
Name
RSI金叉死叉策略RSI-Crossover-Strategy
Author
ChaoZhang
Strategy Description
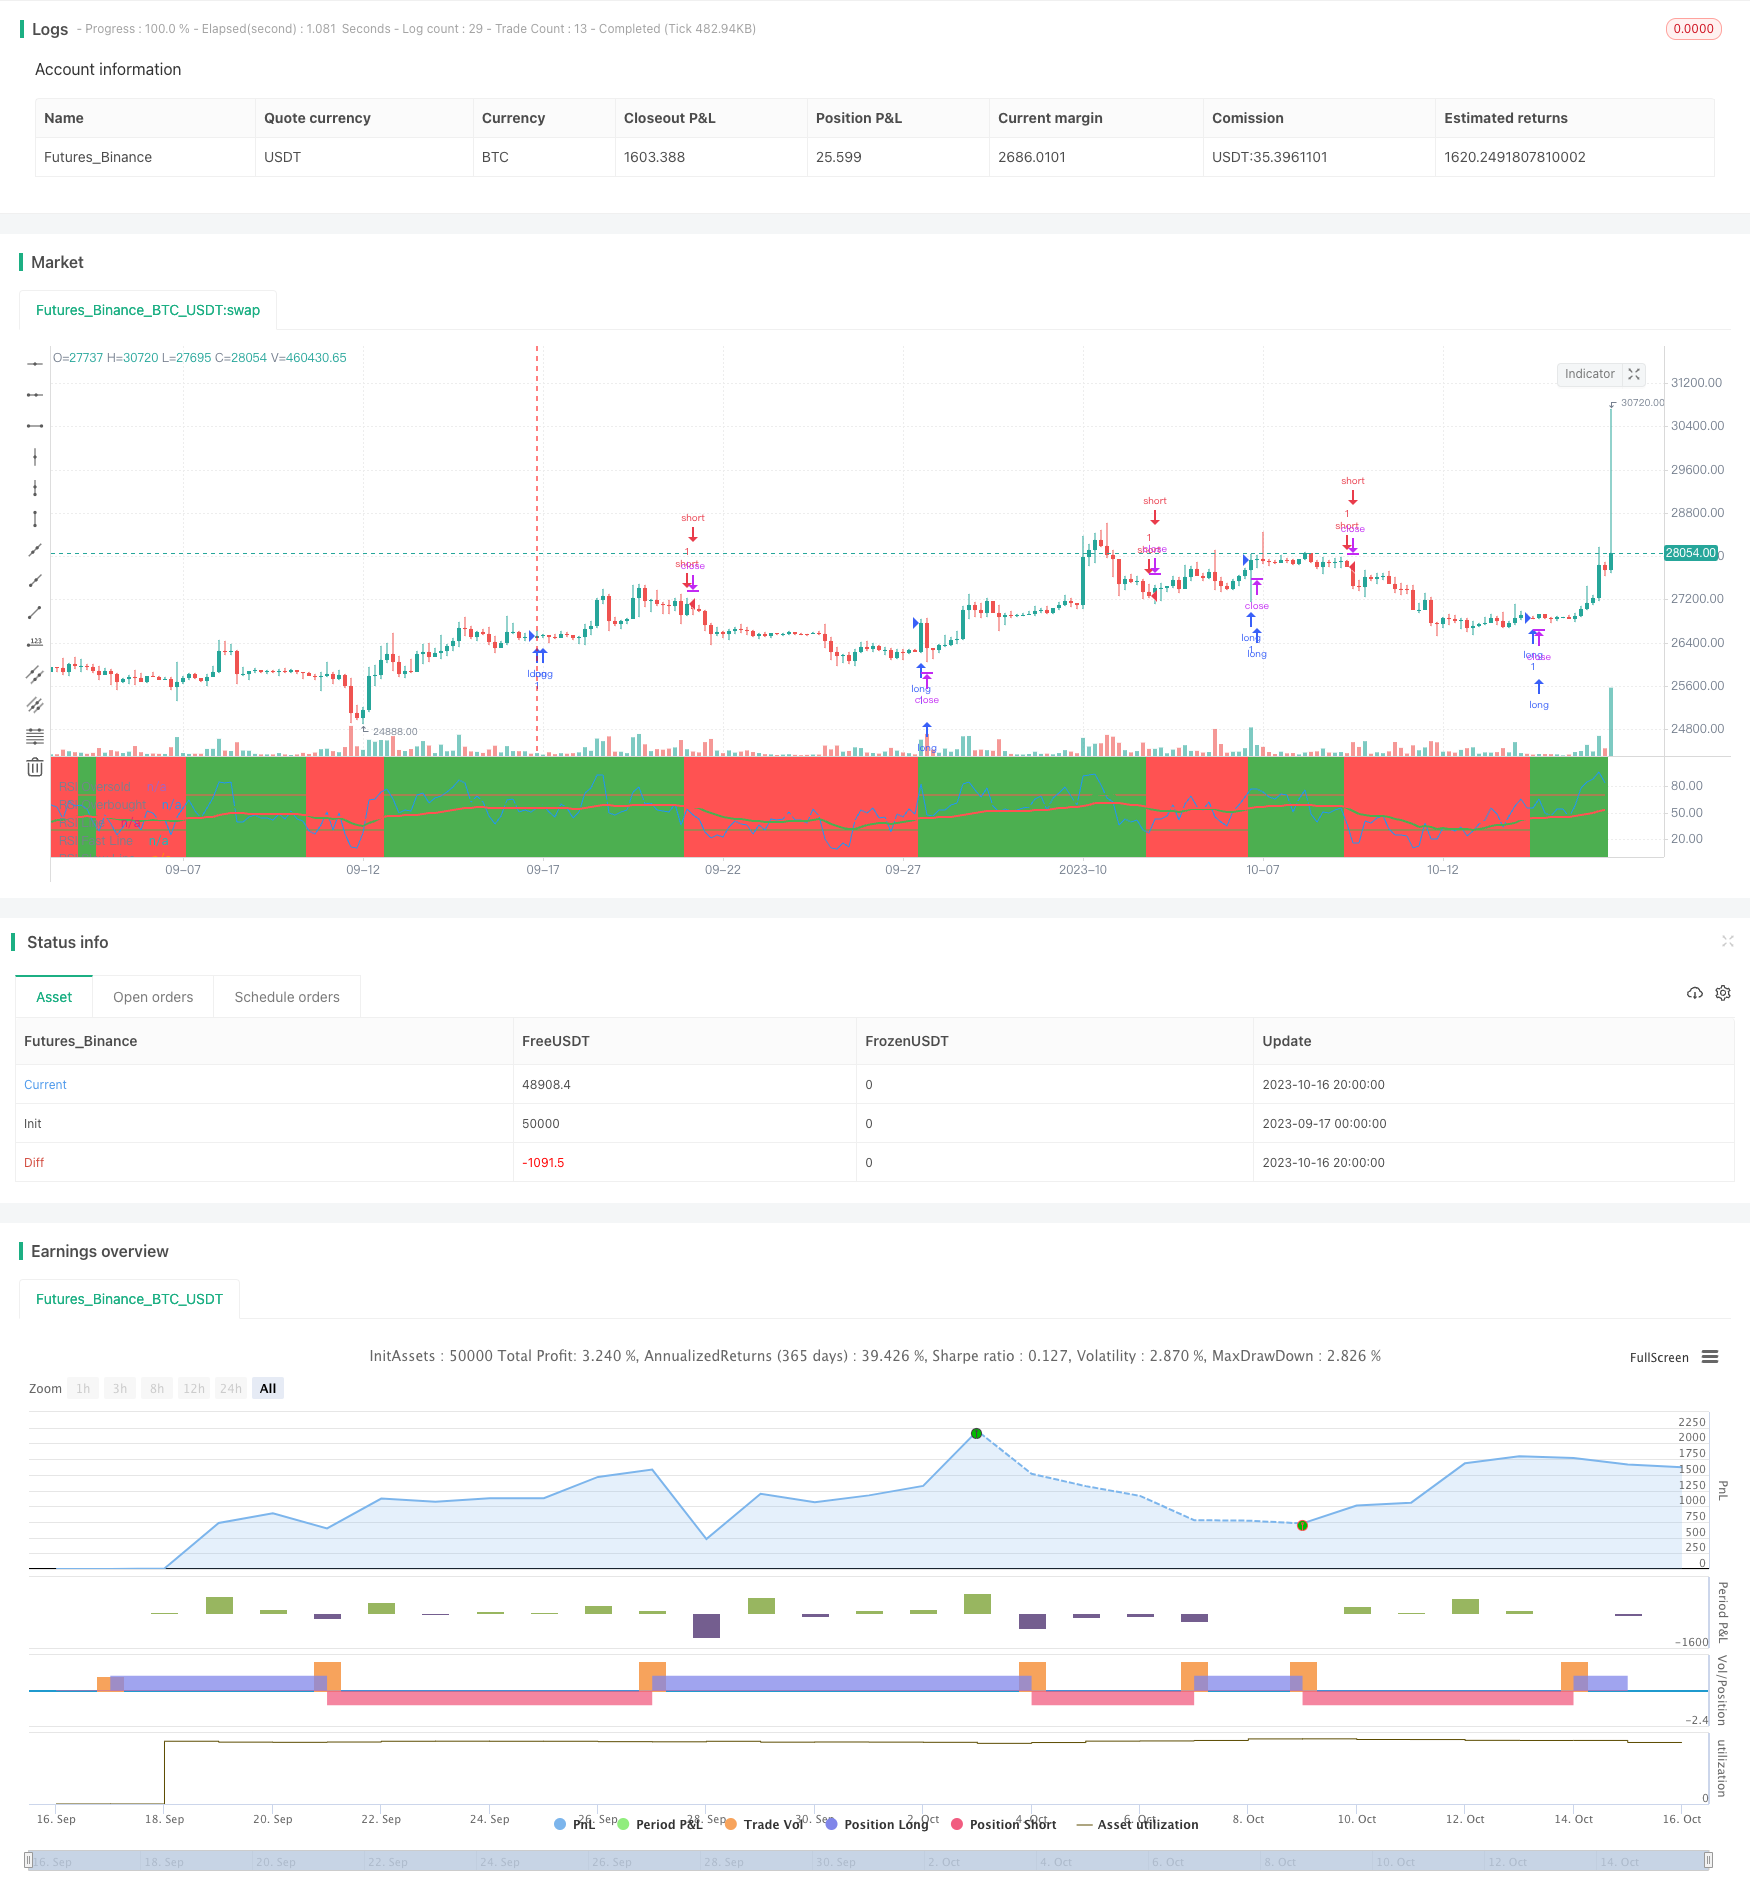
[trans]
概述
RSI金叉死叉策略利用RSI指标的快线和慢线的金叉和死叉来确定买入和卖出的时机。当快线上穿慢线时为金叉,表示 strain过卖,应当买入。当快线下穿慢线时为死叉,表示 strain过买,应当卖出。该策略结合RSI指标的超买超卖判断,可以有效避免虚假信号。
策略原理
该策略首先计算RSI指标,设置RSI参数为5周期。然后设置快线EMA为RSI的20周期均线,慢线EMA为RSI的50周期均线。当快线上穿慢线时生成买入信号,当快线下穿慢线时生成卖出信号。同时设置RSI超买线为70,超卖线为30,这可以过滤掉一些虚假信号。
策略原理主要基于以下几点:
-
RSI指标可以判断是否进入超买或者超卖状态。RSI高于70为超买区,低于30为超卖区。
-
快线EMA反应更迅速,可以判断 strain的短期趋势改变。慢线EMA更平稳,可以判断 strain中长期趋势。
-
当快线上穿慢线时,表示 strain从超卖向上反转,属于买入信号。
-
当快线下穿慢线时,表示 strain从超买向下反转,属于卖出信号。
-
设置超买超卖线,可以过滤一些多头市场中的卖出信号,和空头市场中的买入信号。
-
整体来说,该策略结合RSI指标的优势,使用双EMA判断金叉和死叉,可以捕捉市场的短期和中期转折点,实现对趋势的判断。
策略优势
RSI金叉死叉策略具有以下几点优势:
-
使用RSI指标判断超买超卖状态,可以有效避免追高杀跌。
-
快慢EMA结合判断金叉死叉,兼顾了操作的灵敏度和稳定性。
-
超买超卖阈值设置过滤了部分噪音交易信号。
-
策略思路简单清晰,容易理解实现,适合量化交易开发。
-
可在不同市场环境中灵活应用,回测效果较佳。
-
可通过调整RSI周期、快慢EMA周期等参数进行优化,适应市场变化。
-
策略风险可控,避免单方面追涨杀跌的风险。
策略风险
RSI金叉死叉策略也存在一定的风险,主要包括:
-
RSI指标发出错误信号的风险,RSI依然可能出现背离。
-
双EMA判断产生错误信号的风险,存在一定的滞后。
-
超买超卖阈值设置不当,可能过滤掉较好的交易机会。
-
在震荡盘整市场中,金叉死叉信号频繁,带来高额的交易成本和滑点风险。
-
参数设置(如RSI周期,EMA周期等)不合理,可能错过交易机会或增加虚假信号。
-
需要积累充足的历史数据才能形成交易信号,数据不足时效果较差。
-
无法判断 market 趋势,在 market 反转时会产生亏损。
对应风险需要注意参数优化,合理止损,避免过度交易,积累足够数据等。
策略优化方向
RSI金叉死叉策略可以从以下几个方面进行优化:
-
优化RSI参数,测试不同的RSI周期参数,使其更符合 market 的特点。
-
优化快慢EMA周期参数,使其能够捕捉更多交易机会。
-
测试不同的超买超卖阈值,防止错过较大行情。
-
结合其它指标判断 market 趋势,避免反转带来的亏损。
-
设定合理的止损策略,控制单次亏损。
-
设定交易量管理策略,防止单次亏损过大。
-
在开仓后考虑部分止盈 exiting,锁定部分利润。
-
考虑在趋势较强时进行重仓操作,在震荡 market 中减少交易。
-
测试不同市场及参数下的策略稳定性,进行多市场验证。
通过参数和风险管理等多方面的综合优化,可以大幅提高RSI金叉死叉策略的稳定性和profitability。
总结
RSI金叉死叉策略整体来说是一种较为常见的量化策略思路。它结合RSI指标的优势,使用双EMA产生交易信号,可以有效判断市场的短期中期转折点。该策略优化空间大、风险可控,可以通过调整参数适应不同市场环境,具有良好的通用性。但也需要注意防止产生过多错误信号,并做好风险控制。如果参数设置得当,回测效果较佳,可以成为一个易于实现的量化交易策略选择。
||
Overview
The RSI crossover strategy uses the crossover and crossunder of fast line and slow line of RSI indicator to determine the entry and exit points. When the fast line crosses above the slow line, it is considered as golden cross, indicating the asset is oversold and it is the signal to go long. When the fast line crosses below the slow line, it is considered as death cross, indicating the asset is overbought and it is the signal to go short. This strategy incorporates the overbought and oversold judgement of RSI indicator to avoid false signals effectively.
Strategy Logic
This strategy first calculates the RSI indicator with RSI period set to 5. Then the fast EMA is set to 20-period EMA of RSI, and slow EMA is set to 50-period EMA of RSI. The buy signal is generated when the fast line crosses above the slow line. The sell signal is generated when the fast line crosses below the slow line. Also the overbought line is set at 70 and oversold line is set at 30 to filter some false signals.
The strategy logic is mainly based on the following points:
-
RSI indicator can judge if the asset is in overbought or oversold status. RSI above 70 is overbought zone, below 30 is oversold zone.
-
The fast EMA reacts more quickly and can determine the short term trend change of the asset. The slow EMA is more stable and can determine the mid-long term trend.
-
When fast line crosses above slow line, it indicates the asset is turning from oversold to upwards, which is the buy signal.
-
When fast line crosses below slow line, it indicates the asset is turning from overbought to downwards, which is the sell signal.
-
The overbought and oversold lines can filter some sell signals in bull market and buy signals in bear market.
-
In general, this strategy combines the strength of RSI indicator, and uses double EMAs to judge crossovers, which can capture the short term and mid-term turning points of the market and determine the trend.
Advantages of the Strategy
The RSI crossover strategy has the following advantages:
-
Using RSI indicator to judge overbought and oversold avoids chasing highs and selling lows.
-
The fast and slow EMA combination considers both sensitivity and stability of the operations.
-
The overbought and oversold threshold filters some noisy trading signals.
-
The strategy logic is simple and clear, easy to understand and implement, suitable for quantitative trading development.
-
It can be flexibly applied in different market environments with good backtest results.
-
Parameters like RSI period and EMA periods can be tuned to adapt to market changes.
-
The strategy risk is controllable, avoiding the risk of unilateral chasing.
Risks of the Strategy
There are also some risks for RSI crossover strategy:
-
The risk of RSI indicator generating wrong signals, divergence may still exist.
-
The risk of double EMAs generating wrong signals, some lag exists.
-
The improper overbought and oversold threshold may filter some good trading opportunities.
-
In range-bound market, the crossover signals are frequent, bringing high trading costs and slippage risks.
-
Unreasonable parameters setting (like RSI period, EMA periods) may miss opportunities or increase false signals.
-
Sufficient historical data is needed to generate valid signals, poor performance with insufficient data.
-
It cannot determine the market trend, may lead to losses when market reverses.
The risks can be managed by parameter tuning, proper stop loss, avoiding overtrading, accumulating enough data etc.
Optimization Directions
The RSI crossover strategy can be optimized in the following aspects:
-
Optimize RSI parameters, test different RSI periods to better fit the market characteristics.
-
Optimize the fast and slow EMA periods to capture more opportunities.
-
Test different overbought and oversold threshold to avoid missing major trends.
-
Incorporate other indicators to determine market trend, avoiding losses during reversals.
-
Set proper stop loss strategy to control single loss.
-
Set trading size management strategy to prevent excessive single loss.
-
Consider partial profit taking after opening positions to lock in profits.
-
Consider using pyramiding in strong trends and reduce trading in range-bound markets.
-
Test the robustness of strategy in different markets and with different parameters for multi-market validity.
With comprehensive optimizations in parameters, risk management and other aspects, the stability and profitability of RSI crossover strategy can be improved significantly.
Summary
In summary, the RSI crossover strategy is a commonly used quantitative strategy logic. It combines the strengths of RSI indicator and uses double EMAs to generate trading signals, which can effectively determine the short term and mid-term turning points of the market. The strategy has large optimization space, controllable risks, and can be adjusted to suit different market environments, with good versatility. But the risks of generating excessive false signals should be noted, and proper risk control is needed. If tuned properly, the backtest results can be good, making it an easy to implement quantitative trading strategy choice.
[/trans]
Strategy Arguments
| Argument | Default | Description |
|---|---|---|
| v_input_1_close | 0 | Source: close |
| v_input_2 | 5 | RSI Period |
| v_input_3 | 30 | RSI Oversold |
| v_input_4 | 70 | RSI Overbought |
| v_input_5 | 20 | Smooth Fast Period |
| v_input_6 | 50 | Smooth Slow Period |
Source (PineScript)
/*backtest
start: 2023-09-17 00:00:00
end: 2023-10-17 00:00:00
period: 4h
basePeriod: 15m
exchanges: [{"eid":"Futures_Binance","currency":"BTC_USDT"}]
*/

// This source code is subject to the terms of the Mozilla Public License 2.0 at https://mozilla.org/MPL/2.0/
// © xaurr

//@version=4
strategy("RSI Cross [xaurr]", shorttitle="RSIC",overlay=false)

src  = input(title="Source", type=input.source, defval=close)

//RSI Strategy
period = input(5,"RSI Period", minval=1)
overSold = input(30,"RSI Oversold", minval=1)
overBought = input(70, "RSI Overbought", minval=1)
fastPeriod = input(20,"Smooth Fast Period")
slowPeriod = input(50,"Smooth Slow Period")


rsi = rsi(src, period)
fast = ema(rsi,fastPeriod)
slow = ema(rsi,slowPeriod)


long = crossover(fast,slow)
short = crossunder(fast,slow)


pos = 0
pos:= long ?1:short ?-1 : nz(pos[1])


plot(overSold,"RSI Oversold",color=color.green)
plot(overBought, "RSI Overbought",color=color.red)
plot(rsi, linewidth = 1, color = color.blue, title="RSI Line")

plot(fast, linewidth = 2, color = color.green, title="RSI Fast Line")
plot(slow, linewidth = 2, color = color.red, title="RSI Slow Line")

bgcolor(pos == 1 ? color.green : pos == -1 ? color.red : na)

if pos == 1
    strategy.entry("long",strategy.long)

if pos == -1
    strategy.entry("short",strategy.short)
Detail
https://www.fmz.com/strategy/429569
Last Modified
2023-10-18 11:44:45