
7.1 KiB
Name
RSI指标追踪止盈止损策略RSI-Target-and-Stop-Loss-Tracking-Strategy
Author
ChaoZhang
Strategy Description
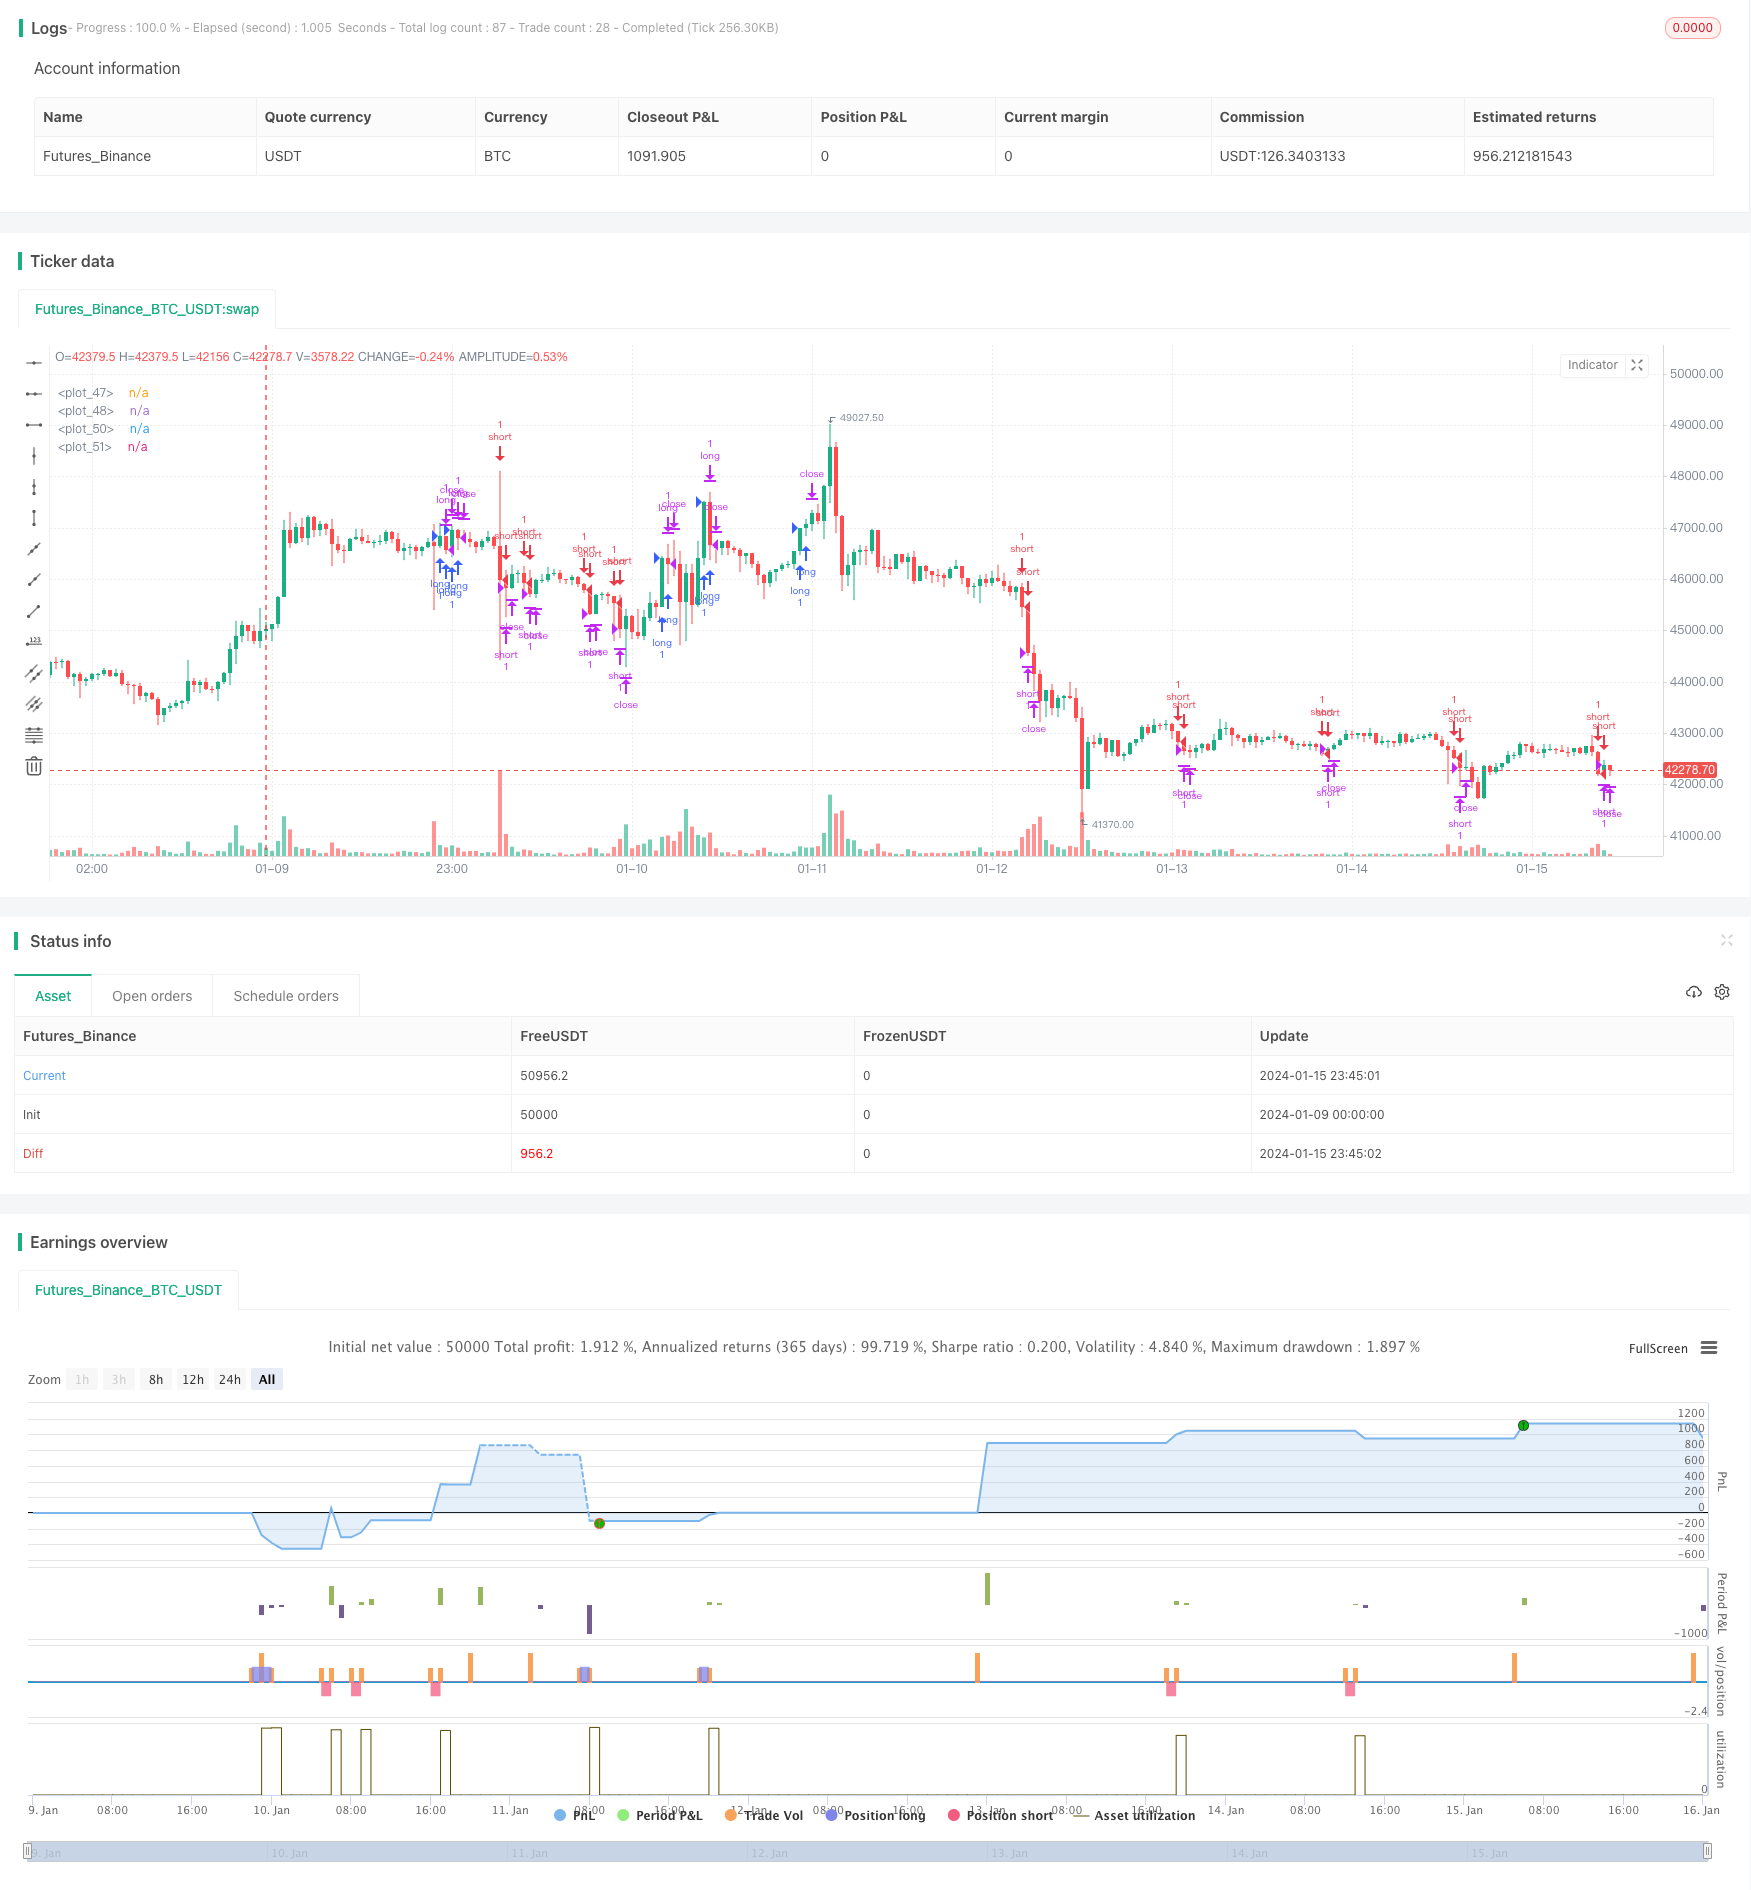 [trans]
概述
本策略利用RSI指标生成买入和卖出信号,结合追踪止盈止损机制,实现盈利固定和亏损控制的目的。该策略适用于中短期交易,具有灵活、实用的特点。
策略原理
-
使用RSI指标判断市场超买超卖现象。当RSI指标上穿60时产生买入信号,下穿40时产生卖出信号。
-
进场后设置追踪止盈止损。止盈距离为入场价加上用户设置的点数距离,止损距离为入场价减去用户设置的点数距离。
-
当价格触及止盈或止损距离时,交易自动止盈或止损出场。
优势分析
-
RSI指标判断市场趋势的效果较好,结合追踪止损止盈,可以有效控制风险。
-
止盈止损距离是绝对点数设置,无论入场价格高低,盈利空间和亏损空间是固定的,风险收益比例可控。
-
策略参数设置简单,用户只需要根据自己的风险偏好设置止盈止损的点数距离即可,无须复杂优化。
风险分析
-
RSI指标可能产生错误信号,从而导致不必要的亏损。可通过调整RSI参数或增加其他指标过滤来减少错误信号。
-
固定的止盈止损距离可能导致盈利空间不足或亏损过大。用户需要根据市场波动程度合理设置止盈止损距离。
-
追踪止损在极端行情中可能被突破,无法限制最大亏损。建议结合临时性止损来降低风险。
优化方向
-
优化RSI指标参数,寻找最佳参数组合。
-
增加MA等指标来过滤RSI信号,减少不必要的交易。
-
设置止盈止损比例而不是绝对点数,可以根据价格自动调整止盈止损距离。
-
添加临时止损来防止极端行情的风险。
总结
本策略使用RSI指标判断买卖时机,配合追踪止盈止损控制风险收益。策略简单实用,可根据市场和个人风险偏好调整参数。结合多指标判断和止损优化,可以进一步增强策略稳定性和盈利能力。
||
Overview
This strategy uses the RSI indicator to generate buy and sell signals, combined with tracking stop profit and stop loss mechanisms to achieve the purpose of fixed profits and risk control. The strategy is suitable for medium and short term trading, with flexible and practical characteristics.
Strategy Principle
-
Use the RSI indicator to judge overbought and oversold conditions in the market. A buy signal is generated when the RSI crosses above 60, and a sell signal is generated when it crosses below 40.
-
After entering the market, set tracking stop profit and stop loss. The profit distance is the entry price plus the number of points set by the user, and the loss distance is the entry price minus the number of points set by the user.
-
When the price reaches the profit or loss distance, the trade stops profit or loss automatically.
Advantage Analysis
-
The RSI indicator works well in judging market trends, combined with tracking stop loss and profit taking, it can effectively control risks.
-
The profit and loss distances are set in absolute number of points. No matter the entry price is high or low, the profit space and loss space are fixed, and the risk reward ratio is controllable.
-
The strategy parameter setting is simple. Users only need to set the number of points for stop profit and stop loss based on their own risk preferences, without complicated optimization.
Risk Analysis
-
RSI indicators may generate false signals, resulting in unnecessary losses. False signals can be reduced by adjusting RSI parameters or adding other indicators for filtration.
-
Fixed stop profit and loss distances can lead to insufficient profit space or excessive losses. Users need to reasonably set stop profit and loss distances according to market volatility.
-
Tracking stop loss may be broken in extreme market conditions, unable to limit the maximum loss. It is recommended to combine temporary stops to reduce risks.
Optimization Direction
-
Optimize RSI parameter to find the best parameter combination.
-
Add MA and other indicators to filter RSI signals and reduce unnecessary trades.
-
Set stop profit and loss ratio instead of absolute number of points, which can automatically adjust distances based on price.
-
Add temporary stops to prevent risks in extreme market conditions.
Summary
This strategy uses the RSI indicator to determine the timing of buying and selling, and uses tracking stop profit and loss to control risks and returns. The strategy is simple and practical. Parameters can be adjusted based on market and personal risk preferences. Combined with multi-indicator judgments and stop loss optimization, the stability and profitability of the strategy can be further enhanced.
[/trans]
Strategy Arguments
| Argument | Default | Description |
|---|---|---|
| v_input_int_1 | 14 | RSI Length |
| v_input_int_2 | 50 | STOPLOSS LONG |
| v_input_int_3 | 100 | TARGET LONG |
| v_input_int_4 | 50 | STOPLOSS SHORT |
| v_input_int_5 | 100 | TARGET SHORT |
Source (PineScript)
/*backtest
start: 2024-01-09 00:00:00
end: 2024-01-16 00:00:00
period: 45m
basePeriod: 5m
exchanges: [{"eid":"Futures_Binance","currency":"BTC_USDT"}]
*/

// This source code is subject to the terms of the Mozilla Public License 2.0 at https://mozilla.org/MPL/2.0/
// © ChaitanyaSainkar

//@version=5
strategy("RSI TARGET & STOPLOSS",overlay = true)

// USER INPUTS

RSI_L = input.int(defval = 14, title = "RSI Length")

LONGSTOP = input.int(defval = 50, title = "STOPLOSS LONG")
LONGTARGET = input.int(defval = 100, title = "TARGET LONG")

SHORTSTOP = input.int(defval = 50, title = "STOPLOSS SHORT")
SHORTTARGET = input.int(defval = 100, title = "TARGET SHORT")

// POINTBASED TARGET & STOPLOSS

RSI = ta.rsi(close,RSI_L)

longstop = strategy.position_avg_price - LONGSTOP
longtarget = strategy.position_avg_price + LONGTARGET

shortstop = strategy.position_avg_price + SHORTSTOP
shorttarget = strategy.position_avg_price - SHORTTARGET

// LONG & SHORT SIGNALS

buy = ta.crossover(RSI,60)
short = ta.crossunder(RSI,40)

// STRATEGY FUNCTIONS

if buy
    strategy.entry("long", direction = strategy.long,comment = "LONG")

if strategy.position_size > 0
    strategy.exit("long", from_entry = "long", limit = longtarget, stop = longstop, comment_loss = "LOSS", comment_profit = "PROFIT")
if short
    strategy.entry("short", direction = strategy.short,comment = "SHORT")

if strategy.position_size < 0
    strategy.exit("short", from_entry = "short", limit = longtarget, stop = shortstop, comment_loss = "LOSS", comment_profit = "PROFIT")

// PLOTTING TARGET & STOPLOSS

plot(strategy.position_size > 0 ? longtarget : na, style = plot.style_linebr, color = color.green)
plot(strategy.position_size > 0 ? longstop : na, style = plot.style_linebr, color = color.red)

plot(strategy.position_size < 0 ? shorttarget : na, style = plot.style_linebr, color = color.green)
plot(strategy.position_size < 0 ? shortstop : na, style = plot.style_linebr, color = color.red)
Detail
https://www.fmz.com/strategy/439050
Last Modified
2024-01-17 11:52:23