
9.0 KiB
Name
RSI均线交叉策略RSI-Moving-Average-Crossover-Strategy
Author
ChaoZhang
Strategy Description
[trans]
概述
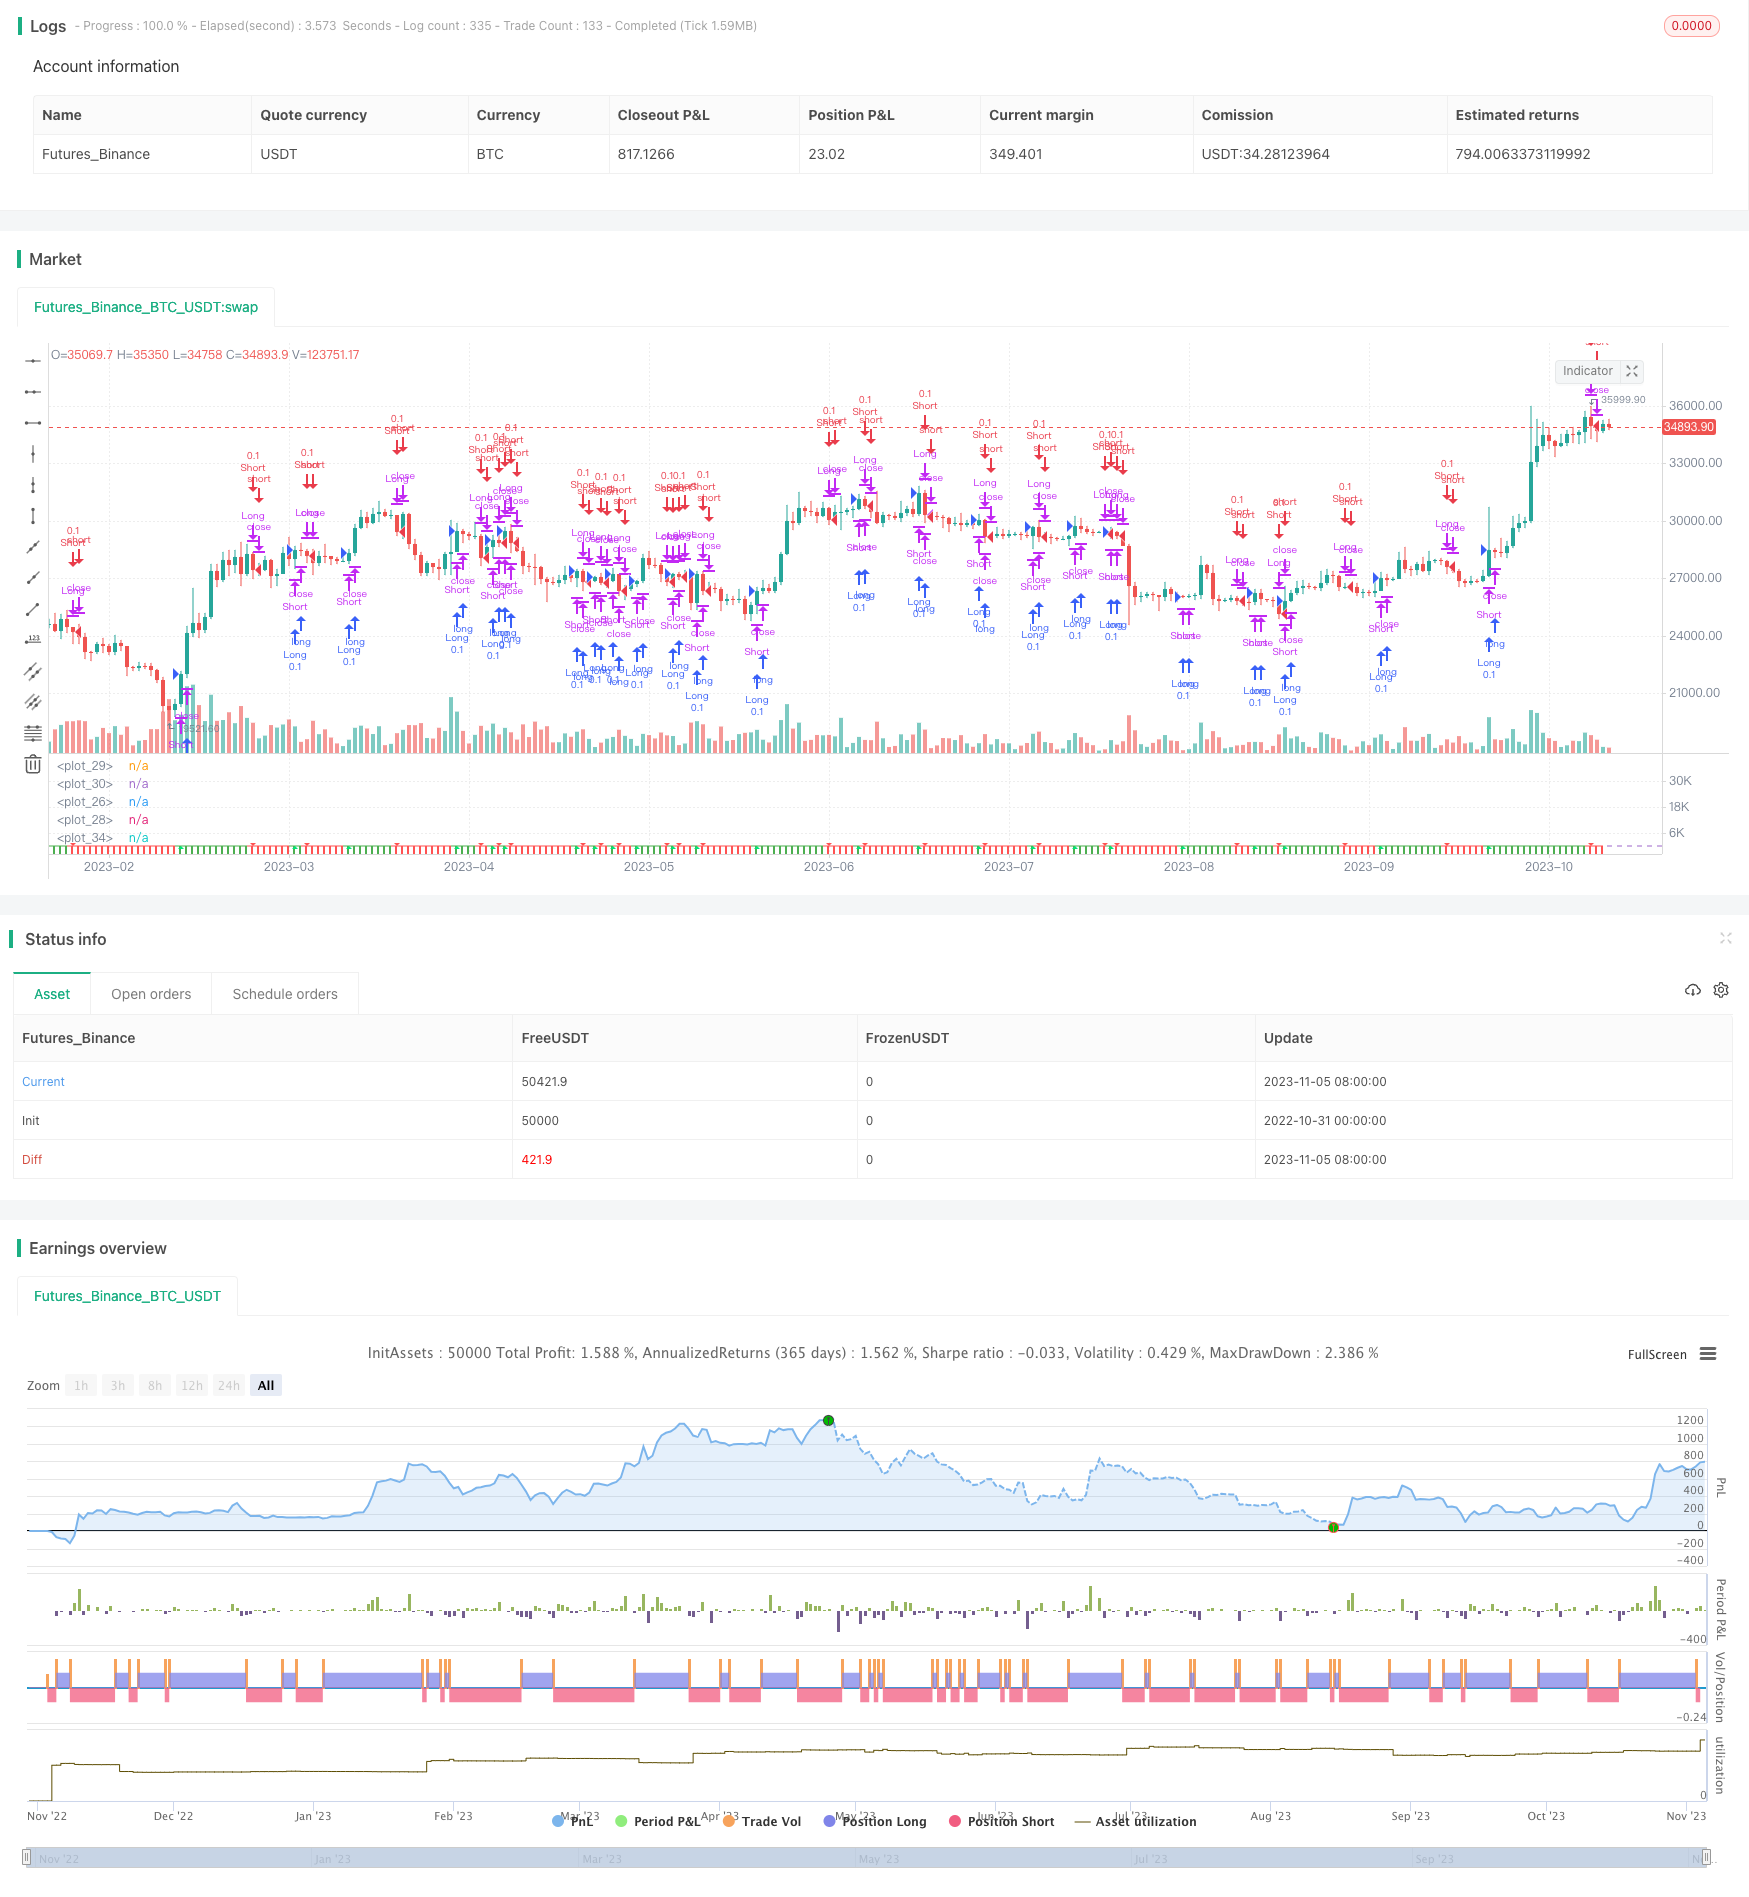
RSI均线交叉策略是一种应用于加密货币交易的策略。该策略将移动平均线应用于RSI指标,并根据RSI与其移动平均线的交叉情况发出买入和卖出信号。
策略原理
该策略首先计算RSI指标。RSI指标基于一定时间周期内的涨跌变化,反映价格的强弱。RSI大于70时为超买区,小于30时为超卖区。
然后,该策略在RSI指标的基础上应用移动平均线。移动平均线能够过滤随机波动,判断趋势方向。这里设置了10周期的RSI移动平均线。
当RSI上穿其移动平均线时,视为买入信号;当RSI下穿其移动平均线时,视为卖出信号。根据这两个信号进行交易。
代码中,首先计算 length 周期的RSI指标。然后计算 10 周期 RSI 的移动平均线 ma。当 ma 上穿 rsi 时,买入;当 ma 下穿 rsi 时,卖出。
此外,代码还绘制了 rsi、ma 的线形图,以及 rsi-ma 的柱状图。绘制了 rsi=70、rsi=30 的分界线。并在买入卖出时,在图上标记了相应的信号箭头。
策略优势分析
- RSI指标可以判断超买超卖,移动平均线可过滤随机波动,两者结合可以发现趋势转换点。
- RSI均线交叉是比较成熟的交易策略思路,可以过滤掉部分假信号。
- 该策略代码实现简单清晰,容易理解。绘图功能完整,可以清楚观察交易信号。
- 该策略适用于趋势比较明显的加密货币,效果较好。
策略风险分析
- RSI和移动平均线所采用的周期参数不当,可能导致产生过多错误信号。
- 单纯依靠指标交叉并不能完全避免被套。需要结合趋势分析。
- 交易费用会对盈利造成一定影响。需要优化仓位管理。
- 加密货币市场波动大,需要警惕停损的风险。
针对风险,可以调整参数优化指标效果,适当缩短仓位,设置止损线,并配合趋势分析来过滤信号。
策略优化方向
- 可以研究不同周期参数下RSI和均线的最佳组合
- 可以在趋势较强时加大仓位,趋势不明时减小仓位
- 可以设置动态止损,跟踪趋势进行止损
- 可以探索其他指标与RSI进行组合,形成新的交易信号
- 可以探索基于该策略的机器学习模型,以提升策略胜率
总结
RSI均线交叉策略结合趋势指标和过滤指标的优点,相对成熟可靠。该策略逻辑简单易懂,代码实现也较完整,总体而言是一个较好的加密货币交易策略。但任何策略都有需要优化的地方,需要不断测试调整,并辅以趋势判断,以取得更好的策略效果。
||
Overview
The RSI Moving Average Crossover Strategy is a strategy that is mostly used for cryptocurrency trading. It applies a moving average to the RSI indicator and trades based on the crossovers between the RSI and its moving average. It also includes the indicator that it is made from.
Strategy Logic
The strategy first calculates the RSI indicator. The RSI indicator reflects the strength of price based on the upward and downward movements over a certain period of time. RSI above 70 is considered overbought, and below 30 oversold.
Then, the strategy applies a moving average to the RSI indicator. The moving average can filter out random fluctuations and determine the trend direction. Here a 10-period RSI moving average is set.
When the RSI crosses above its moving average, it is considered a buy signal. When the RSI crosses below its moving average, it is considered a sell signal. Trading is conducted according to these two signals.
In the code, the RSI indicator with length period is calculated first. Then the 10-period moving average ma of RSI is calculated. When ma crosses above rsi, it will buy. When ma crosses below rsi, it will sell.
In addition, the code plots the line chart for rsi and ma, as well as the column chart for rsi-ma. The dividing lines for rsi=70 and rsi=30 are also plotted. The corresponding signal arrows are marked on the chart when buying or selling.
Advantage Analysis
-
RSI can judge overbought and oversold conditions. Moving average can filter out random fluctuations. The combination of the two can identify trend reversal points.
-
RSI moving average crossover is a relatively mature trading strategy idea that can filter out some false signals.
-
The strategy code is simple and clear, easy to understand. The plotting function is complete for clearly observing trading signals.
-
This strategy works well for cryptocurrencies with relatively obvious trends.
Risk Analysis
-
Improper RSI and moving average period parameters may generate too many wrong signals.
-
Relying solely on indicator crossovers cannot completely avoid being trapped. Trend analysis needs to be combined.
-
Trading costs can have some impact on profits. Position sizing needs to be optimized.
-
High volatility of crypto market. Need to be alert to stop loss risks.
To address the risks, parameters can be adjusted to optimize the indicators, position sizes can be reduced, stop loss can be set, and trend analysis can be used to filter signals.
Optimization Directions
-
Research the optimal combination of RSI and moving average under different period parameters.
-
Increase position size when the trend is strong, and reduce when trend is unclear.
-
Set dynamic stop loss to trail the trend.
-
Explore combining RSI with other indicators to form new trading signals.
-
Explore machine learning models based on this strategy to improve win rate.
Summary
The RSI moving average crossover strategy combines the advantages of trend and filtering indicators, relatively mature and reliable. The strategy logic is simple and clear, and the code implementation is also quite complete. Overall it is a pretty good cryptocurrency trading strategy. But every strategy needs optimization. It requires constant testing and adjustment, combined with trend analysis, in order to achieve better strategy performance.
[/trans]
Strategy Arguments
| Argument | Default | Description |
|---|---|---|
| v_input_1 | 2019 | Backtest Start Year |
| v_input_2 | true | Backtest Start Month |
| v_input_3 | true | Backtest Start Day |
| v_input_4 | 2022 | Backtest Stop Year |
| v_input_5 | true | Backtest Stop Month |
| v_input_6 | true | Backtest Stop Day |
| v_input_7 | true | Color Background? |
| v_input_8 | 27 | Length |
| v_input_9 | 10 | RSI MA Window |
Source (PineScript)
/*backtest
start: 2022-10-31 00:00:00
end: 2023-11-06 00:00:00
period: 1d
basePeriod: 1h
exchanges: [{"eid":"Futures_Binance","currency":"BTC_USDT"}]
*/

//@version=4
strategy("RSI w MA Strategy", shorttitle="RSI w MA Strategy", overlay=false, initial_capital=10000, currency='USD',process_orders_on_close=true)

//TIME FRAME AND BACKGROUND CONTROL/////////////////////////////////////////////
testStartYear = input(2019, "Backtest Start Year")
testStartMonth = input(01, "Backtest Start Month")
testStartDay = input(01, "Backtest Start Day")
testPeriodStart = timestamp(testStartYear, testStartMonth, testStartDay, 0, 0)
testStopYear = input(2022, "Backtest Stop Year")
testStopMonth = input(1, "Backtest Stop Month")
testStopDay = input(1, "Backtest Stop Day")
testPeriodStop = timestamp(testStopYear, testStopMonth, testStopDay, 0, 0)
testPeriodBackground = input(title="Color Background?", type=input.bool, defval=true)
testPeriodBackgroundColor = testPeriodBackground and time >= testPeriodStart and time <= testPeriodStop ?
   color.teal : na
//bgcolor(testPeriodBackgroundColor, transp=50)
testPeriod() => true
////////////////////////////////////////////////////////////////////////////////

src = close, len = input(27, minval=1, title="Length")
up = rma(max(change(src), 0), len)
down = rma(-min(change(src), 0), len)
rsi = down == 0 ? 100 : up == 0 ? 0 : 100 - (100 / (1 + up / down))
window = input(10, "RSI MA Window")
ma = sma(rsi,window)
plot(rsi, color=color.orange)
colorr= ma > rsi ? color.red : color.green
plot(ma,color=colorr)
band1 = hline(70)
band0 = hline(30)
fill(band1, band0, color=color.purple, transp=90)
diff = rsi - ma

plot(diff,style= plot.style_columns,transp=50,color = colorr)

plotshape(crossunder(rsi,ma)?rsi:na,title="top",style=shape.triangledown,location=location.absolute,size=size.tiny,color=color.red,transp=0)
plotshape(crossover(rsi,ma)?rsi:na,title="bottom",style=shape.triangleup,location=location.absolute,size=size.tiny,color=color.lime,transp=0)

buySignal = crossover(rsi,ma)
sellSignal = crossunder(rsi,ma)

//TRADE CONTROL/////////////////////////////////////////////////////////////////
if testPeriod()
    if buySignal
        strategy.close("Short", qty_percent = 100, comment = "Close Short")
        strategy.entry("Long", strategy.long, qty=.1)

    if sellSignal
        strategy.close("Long", qty_percent = 100, comment = "Close Long")
        strategy.entry("Short", strategy.short, qty=.1)

////////////////////////////////////////////////////////////////////////////////
Detail
https://www.fmz.com/strategy/431398
Last Modified
2023-11-07 15:35:58