
12 KiB
Name
Octa-EMA与Ichimoku云图量化交易策略Octa-EMA-and-Ichimoku-Cloud-Quantitative-Trading-Strategy
Author
ChaoZhang
Strategy Description
[trans]
概述
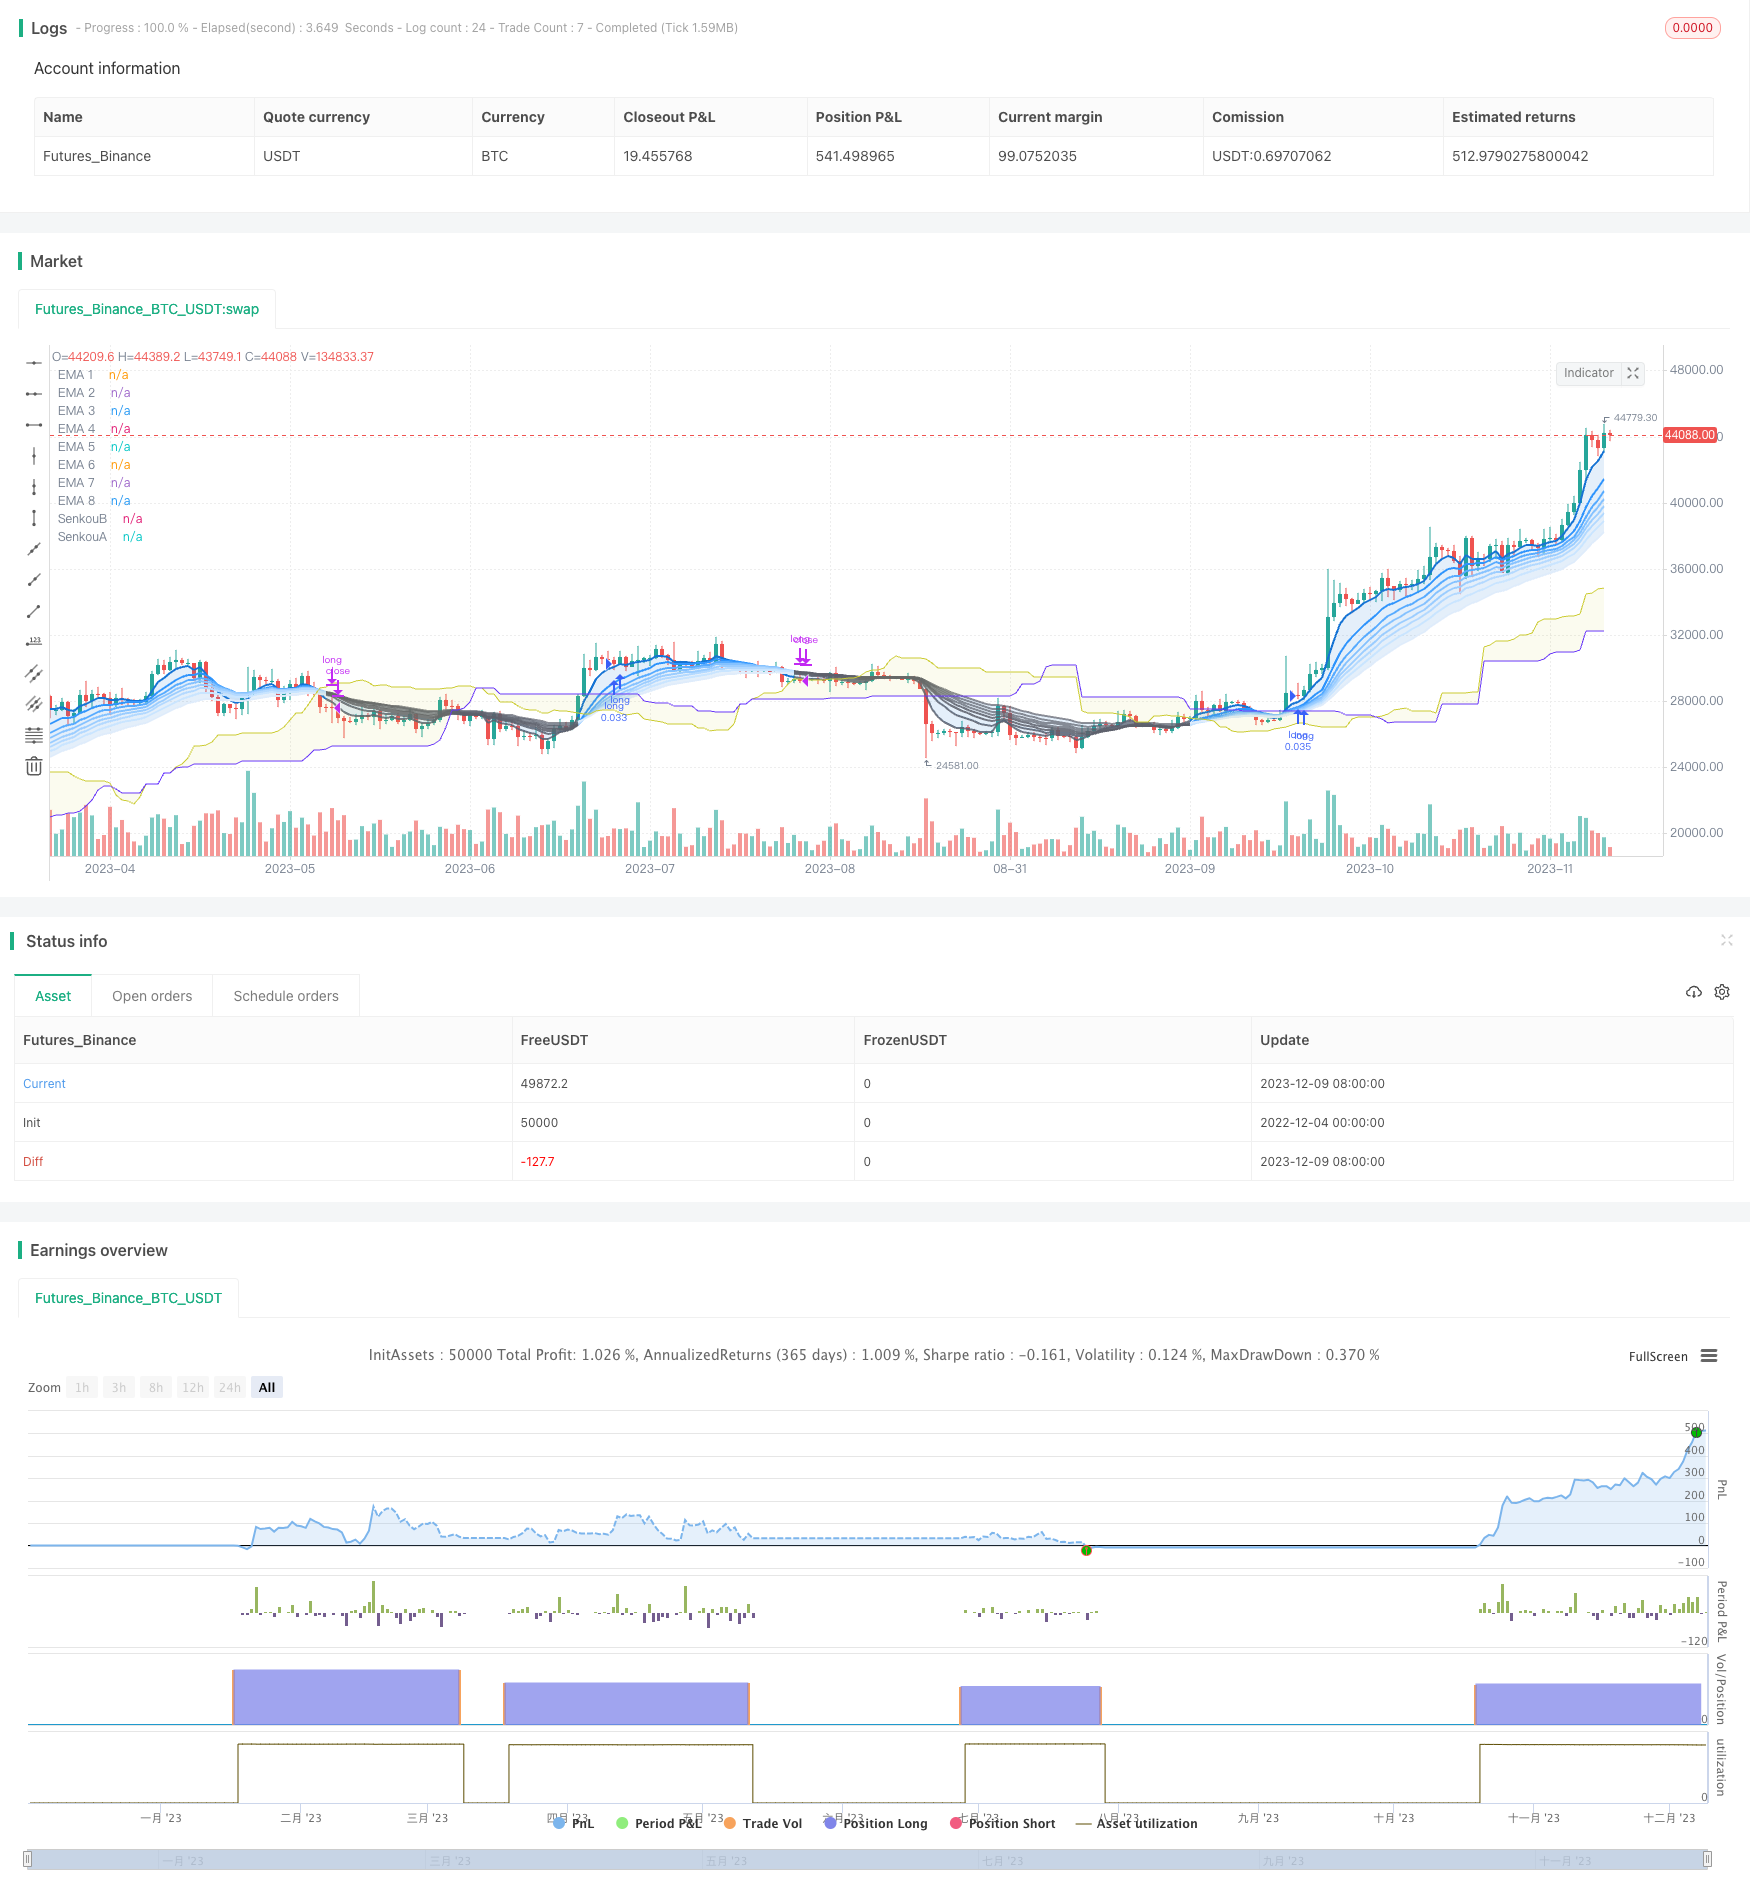
该策略运用8条不同周期的指数移动平均线与Ichimoku云图作为主要交易信号,可以在1小时、4小时或日线时间框架下有效运行。
策略原理
该策略的核心原理基于以下两大部分:
-
8条指数移动平均线(Octa-EMA)
该策略使用了8条不同周期的EMA,分别为5日线、11日线、15日线、18日线、21日线、24日线、28日线和34日线。这8条EMA被称为“Octa-EMA”。当较短周期的EMA在较长周期EMA之上时表示多头趋势,反之则表示空头趋势。
-
Ichimoku云图指标
Ichimoku云图包含转换线、基准线、延迟线和先导线A/B。云图主要判断趋势方向和提供支持阻力。当价格在云图上方时为多头趋势,在云图下方为空头趋势。
该策略的交易信号来自以上两大组成部分。当8条EMA全部处于多头排列(短EMA在长EMA之上),且价格高于Ichimoku的云图时产生买入信号。当EMA排列转为空头(短EMA下穿长EMA)时产生卖出信号。
策略优势分析
该策略主要有以下优势:
- 使用双重指标过滤,可以减少假信号
- Ichimoku云图可判断趋势方向,避免逆势交易
- 8条EMA交叉组合判断趋势,提高准确性
- 可在多种时间周期下运行
- 参数优化空间大,可针对不同品种定制
策略风险分析
该策略也存在一定的风险:
- 在震荡行情中可能产生较多空头信号
- 买入条件较严格,可能错过部分买点
- 当短期与中长期趋势不一致时可能失效
- EMA参数设置不当可能导致信号滞后
针对以上风险,可以通过调整EMA参数或优化入场条件来降低风险,也可以结合其他指标作为辅助。
策略优化方向
该策略可从以下几个方面进行优化:
- 调整EMA参数,优化对应的周期
- 增加均线多空判断指标,确保趋势判断准确性
- 结合MACD、KDJ等其他指标,优化入场时机
- 增加止损止盈策略,控制单次盈亏
- 测试不同品种参数效果,寻找最佳参数组合
- 利用机器学习算法自动寻优参数
总结
Octa-EMA与Ichimoku云图量化交易策略整体而言是一种较为稳定和可靠的趋势跟踪策略。它同时运用EMA组合判断趋势及Ichimoku过滤信号,在参数优化后可以获得较低的误判率。该策略可广泛应用于股指、外汇、贵金属等品种,也可在多个时间周期下运行。如果能够结合止损止盈及辅助指标,将可以进一步提高策略的胜率和盈利率。
||
Overview
This strategy uses 8 exponential moving averages (EMAs) of different periods and the Ichimoku cloud as the main trading signals, which can run effectively in hourly, 4-hour or daily timeframes.
Strategy Principles
The core principles of this strategy are based on the following two parts:
-
8 Exponential Moving Averages (Octa-EMA)
This strategy uses 8 EMAs with different periods, specifically 5-day, 11-day, 15-day, 18-day, 21-day, 24-day, 28-day and 34-day. These 8 EMAs are referred to as "Octa-EMA". When shorter period EMAs are above longer period EMAs, it indicates an uptrend, and vice versa for a downtrend.
-
Ichimoku Cloud
The Ichimoku cloud contains the conversion line, base line, lagging span and leading spans A/B. The cloud mainly judges trend direction and provides support/resistance. When price is above the cloud, it indicates an uptrend, and when below the cloud, it indicates a downtrend.
The trading signals for this strategy come from the combination of the above two components. A buy signal is generated when all 8 EMAs are in an uptrend arrangement (shorter EMA above longer EMA) and the price is above the Ichimoku cloud. A sell signal is generated when the EMA arrangement flips to a downtrend (shorter EMA crossing below longer EMA).
Advantage Analysis
The main advantages of this strategy are:
- Reduces false signals through double indicator filtering
- Ichimoku cloud judges trend direction, avoiding counter-trend trading
- 8 EMA crossovers combine to determine trends with higher accuracy
- Can run on multiple timeframes
- Large parameter tuning space, can customize for different products
Risk Analysis
This strategy also has some risks:
- May generate more false sell signals during range-bound markets
- Strict buy conditions may miss some buying opportunities
- May fail when short-term and mid-term trends conflict
- Poor EMA parameter tuning can cause signal lag
To address these risks, parameters can be adjusted or entry conditions optimized to reduce risk. Other indicators can also be incorporated for confirmation.
Optimization Directions
This strategy can be optimized in several aspects:
- Adjust EMA parameters to find optimal periods
- Add trend-determining indicators to ensure accurate trend judgement
- Incorporate additional indicators like MACD, KDJ to improve entry timing
- Add stop loss/take profit to control per trade risk
- Test parameters across different products to find best fit
- Use machine learning to auto-optimize parameters
Conclusion
Overall, the Octa-EMA and Ichimoku cloud strategy is a relatively stable and reliable trend following system. It uses EMA crossovers to determine trends and Ichimoku to filter signals, providing low false signals when optimized. This strategy can be widely applied on indices, forex, metals etc. at multiple timeframes. By incorporating stop loss/take profit and confirming indicators, win rate and profitability can be further improved.
[/trans]
Strategy Arguments
| Argument | Default | Description |
|---|---|---|
| v_input_1 | true | Show Ribbon (EMA) |
| v_input_2 | 5 | EMA 1 Length |
| v_input_3 | 11 | EMA 2 Length |
| v_input_4 | 15 | EMA 3 Length |
| v_input_5 | 18 | EMA 4 Length |
| v_input_6 | 21 | EMA 5 Length |
| v_input_7 | 24 | EMA 6 Length |
| v_input_8 | 28 | EMA 7 Length |
| v_input_9 | 34 | EMA 8 Length |
| v_input_10 | false | Chikou |
| v_input_11 | false | Tenkan |
| v_input_12 | false | Kijun |
| v_input_int_1 | 9 | conversionPeriods |
| v_input_int_2 | 26 | basePeriods |
| v_input_int_3 | 52 | laggingSpan2Periods |
| v_input_int_4 | 26 | displacement |
| v_input_int_5 | 2017 | Start Year |
| v_input_int_6 | true | Start Month |
| v_input_int_7 | true | Start Day |
| v_input_int_8 | 2023 | End Year |
| v_input_int_9 | 12 | End Month |
| v_input_int_10 | 31 | End Day |
Source (PineScript)
/*backtest
start: 2022-12-04 00:00:00
end: 2023-12-10 00:00:00
period: 1d
basePeriod: 1h
exchanges: [{"eid":"Futures_Binance","currency":"BTC_USDT"}]
*/

//@version=5
//Fukuiz

strategy(title='Fukuiz Octa-EMA + Ichimoku', shorttitle='Fuku octa strategy', overlay=true, process_orders_on_close=true,
     default_qty_type= strategy.cash , default_qty_value=1000, currency=currency.USD, initial_capital=10000 ,commission_type = strategy.commission.percent,commission_value=0.25)


//OCTA EMA ##################################################


// Functions
f_emaRibbon(_src, _e1, _e2, _e3, _e4, _e5, _e6, _e7, _e8) =>
    _ema1 = ta.ema(_src, _e1)
    _ema2 = ta.ema(_src, _e2)
    _ema3 = ta.ema(_src, _e3)
    _ema4 = ta.ema(_src, _e4)
    _ema5 = ta.ema(_src, _e5)
    _ema6 = ta.ema(_src, _e6)
    _ema7 = ta.ema(_src, _e7)
    _ema8 = ta.ema(_src, _e8)
    [_ema1, _ema2, _ema3, _ema4, _ema5, _ema6, _ema7, _ema8]

showRibbon = input(true, 'Show Ribbon (EMA)')
ema1Len = input(5, title='EMA 1 Length')
ema2Len = input(11, title='EMA 2 Length')
ema3Len = input(15, title='EMA 3 Length')
ema4Len = input(18, title='EMA 4 Length')
ema5Len = input(21, title='EMA 5 Length')
ema6Len = input(24, title='EMA 6 Length')
ema7Len = input(28, title='EMA 7 Length')
ema8Len = input(34, title='EMA 8 Length')

[ema1, ema2, ema3, ema4, ema5, ema6, ema7, ema8] = f_emaRibbon(close, ema1Len, ema2Len, ema3Len, ema4Len, ema5Len, ema6Len, ema7Len, ema8Len)

//Plot

ribbonDir = ema8 < ema2
p1 = plot(ema1, color=showRibbon ? ribbonDir ? #1573d4 : color.new(#5d606b, 15) : na, linewidth=2, title='EMA 1')
p2 = plot(ema2, color=showRibbon ? ribbonDir ? #3096ff : color.new(#5d606b, 15) : na, linewidth=2, title='EMA 2')
plot(ema3, color=showRibbon ? ribbonDir ? #57abff : color.new(#5d606b, 15) : na, linewidth=2, title='EMA 3')
plot(ema4, color=showRibbon ? ribbonDir ? #85c2ff : color.new(#5d606b, 15) : na, linewidth=2, title='EMA 4')
plot(ema5, color=showRibbon ? ribbonDir ? #9bcdff : color.new(#5d606b, 30) : na, linewidth=2, title='EMA 5')
plot(ema6, color=showRibbon ? ribbonDir ? #b3d9ff : color.new(#5d606b, 30) : na, linewidth=2, title='EMA 6')
plot(ema7, color=showRibbon ? ribbonDir ? #c9e5ff : color.new(#5d606b, 30) : na, linewidth=2, title='EMA 7')
p8 = plot(ema8, color=showRibbon ? ribbonDir ? #dfecfb : color.new(#5d606b, 30) : na, linewidth=2, title='EMA 8')
fill(p1, p2, color.new(#1573d4, 85))
fill(p2, p8, color.new(#1573d4, 85))

//ichimoku##################################################

//color
colorblue = #3300CC
colorred = #993300
colorwhite = #FFFFFF
colorgreen = #CCCC33
colorpink = #CC6699
colorpurple = #6633FF

//switch
switch1 = input(false, title='Chikou')
switch2 = input(false, title='Tenkan')
switch3 = input(false, title='Kijun')

middleDonchian(Length) =>
    lower = ta.lowest(Length)
    upper = ta.highest(Length)
    math.avg(upper, lower)

//Functions
conversionPeriods = input.int(9, minval=1)
basePeriods = input.int(26, minval=1)
laggingSpan2Periods = input.int(52, minval=1)
displacement = input.int(26, minval=1)
Tenkan = middleDonchian(conversionPeriods)
Kijun = middleDonchian(basePeriods)
xChikou = close
SenkouA = middleDonchian(laggingSpan2Periods)
SenkouB = (Tenkan[basePeriods] + Kijun[basePeriods]) / 2

//Plot
A = plot(SenkouA[displacement], color=color.new(colorpurple, 0), title='SenkouA')
B = plot(SenkouB, color=color.new(colorgreen, 0), title='SenkouB')
plot(switch1 ? xChikou : na, color=color.new(colorpink, 0), title='Chikou', offset=-displacement)
plot(switch2 ? Tenkan : na, color=color.new(colorred, 0), title='Tenkan')
plot(switch3 ? Kijun : na, color=color.new(colorblue, 0), title='Kijun')
fill(A, B, color=color.new(colorgreen, 90), title='Ichimoku Cloud')

//Buy and Sell signals
fukuiz = math.avg(ema2, ema8)
white = ema2 > ema8
gray = ema2 < ema8
buycond = white and white[1] == 0
sellcond = gray and gray[1] == 0
bullish = ta.barssince(buycond) < ta.barssince(sellcond)
bearish = ta.barssince(sellcond) < ta.barssince(buycond)
buy = bearish[1] and buycond and fukuiz > SenkouA[displacement] and fukuiz > SenkouB
sell = bullish[1] and sellcond and fukuiz > SenkouA[displacement] and fukuiz > SenkouB
sell2=ema2 < ema8
buy2 = white and fukuiz > SenkouA[displacement] and fukuiz > SenkouB

//$$$$$$$$$$$$$$$$$$$$$$$$$$$$$$$$$$$$$$$$$$$$$$$$$$$$$$$$$$$$$$$$$$$$$$
//Back test

startYear = input.int(defval=2017, title='Start Year', minval=2000, maxval=3000)
startMonth = input.int(defval=1, title='Start Month', minval=1, maxval=12)
startDay = input.int(defval=1, title='Start Day', minval=1, maxval=31)
endYear = input.int(defval=2023, title='End Year', minval=2000 ,maxval=3000)
endMonth = input.int(defval=12, title='End Month', minval=1, maxval=12)
endDay = input.int(defval=31, title='End Day', minval=1, maxval=31)

start = timestamp(startYear, startMonth, startDay, 00, 00)
end = timestamp(endYear, endMonth, endDay, 23, 59)
period() => time >= start and time <= end ? true : false

if buy2
    strategy.entry(id='long', direction=strategy.long, when=period(), comment='BUY')

if sell2
    strategy.close(id='long', when=period(), comment='SELL')
Detail
https://www.fmz.com/strategy/434982
Last Modified
2023-12-11 14:52:05