
6.3 KiB
Name
KST指标获利策略KST-Indicator-Profit-Strategy
Author
ChaoZhang
Strategy Description
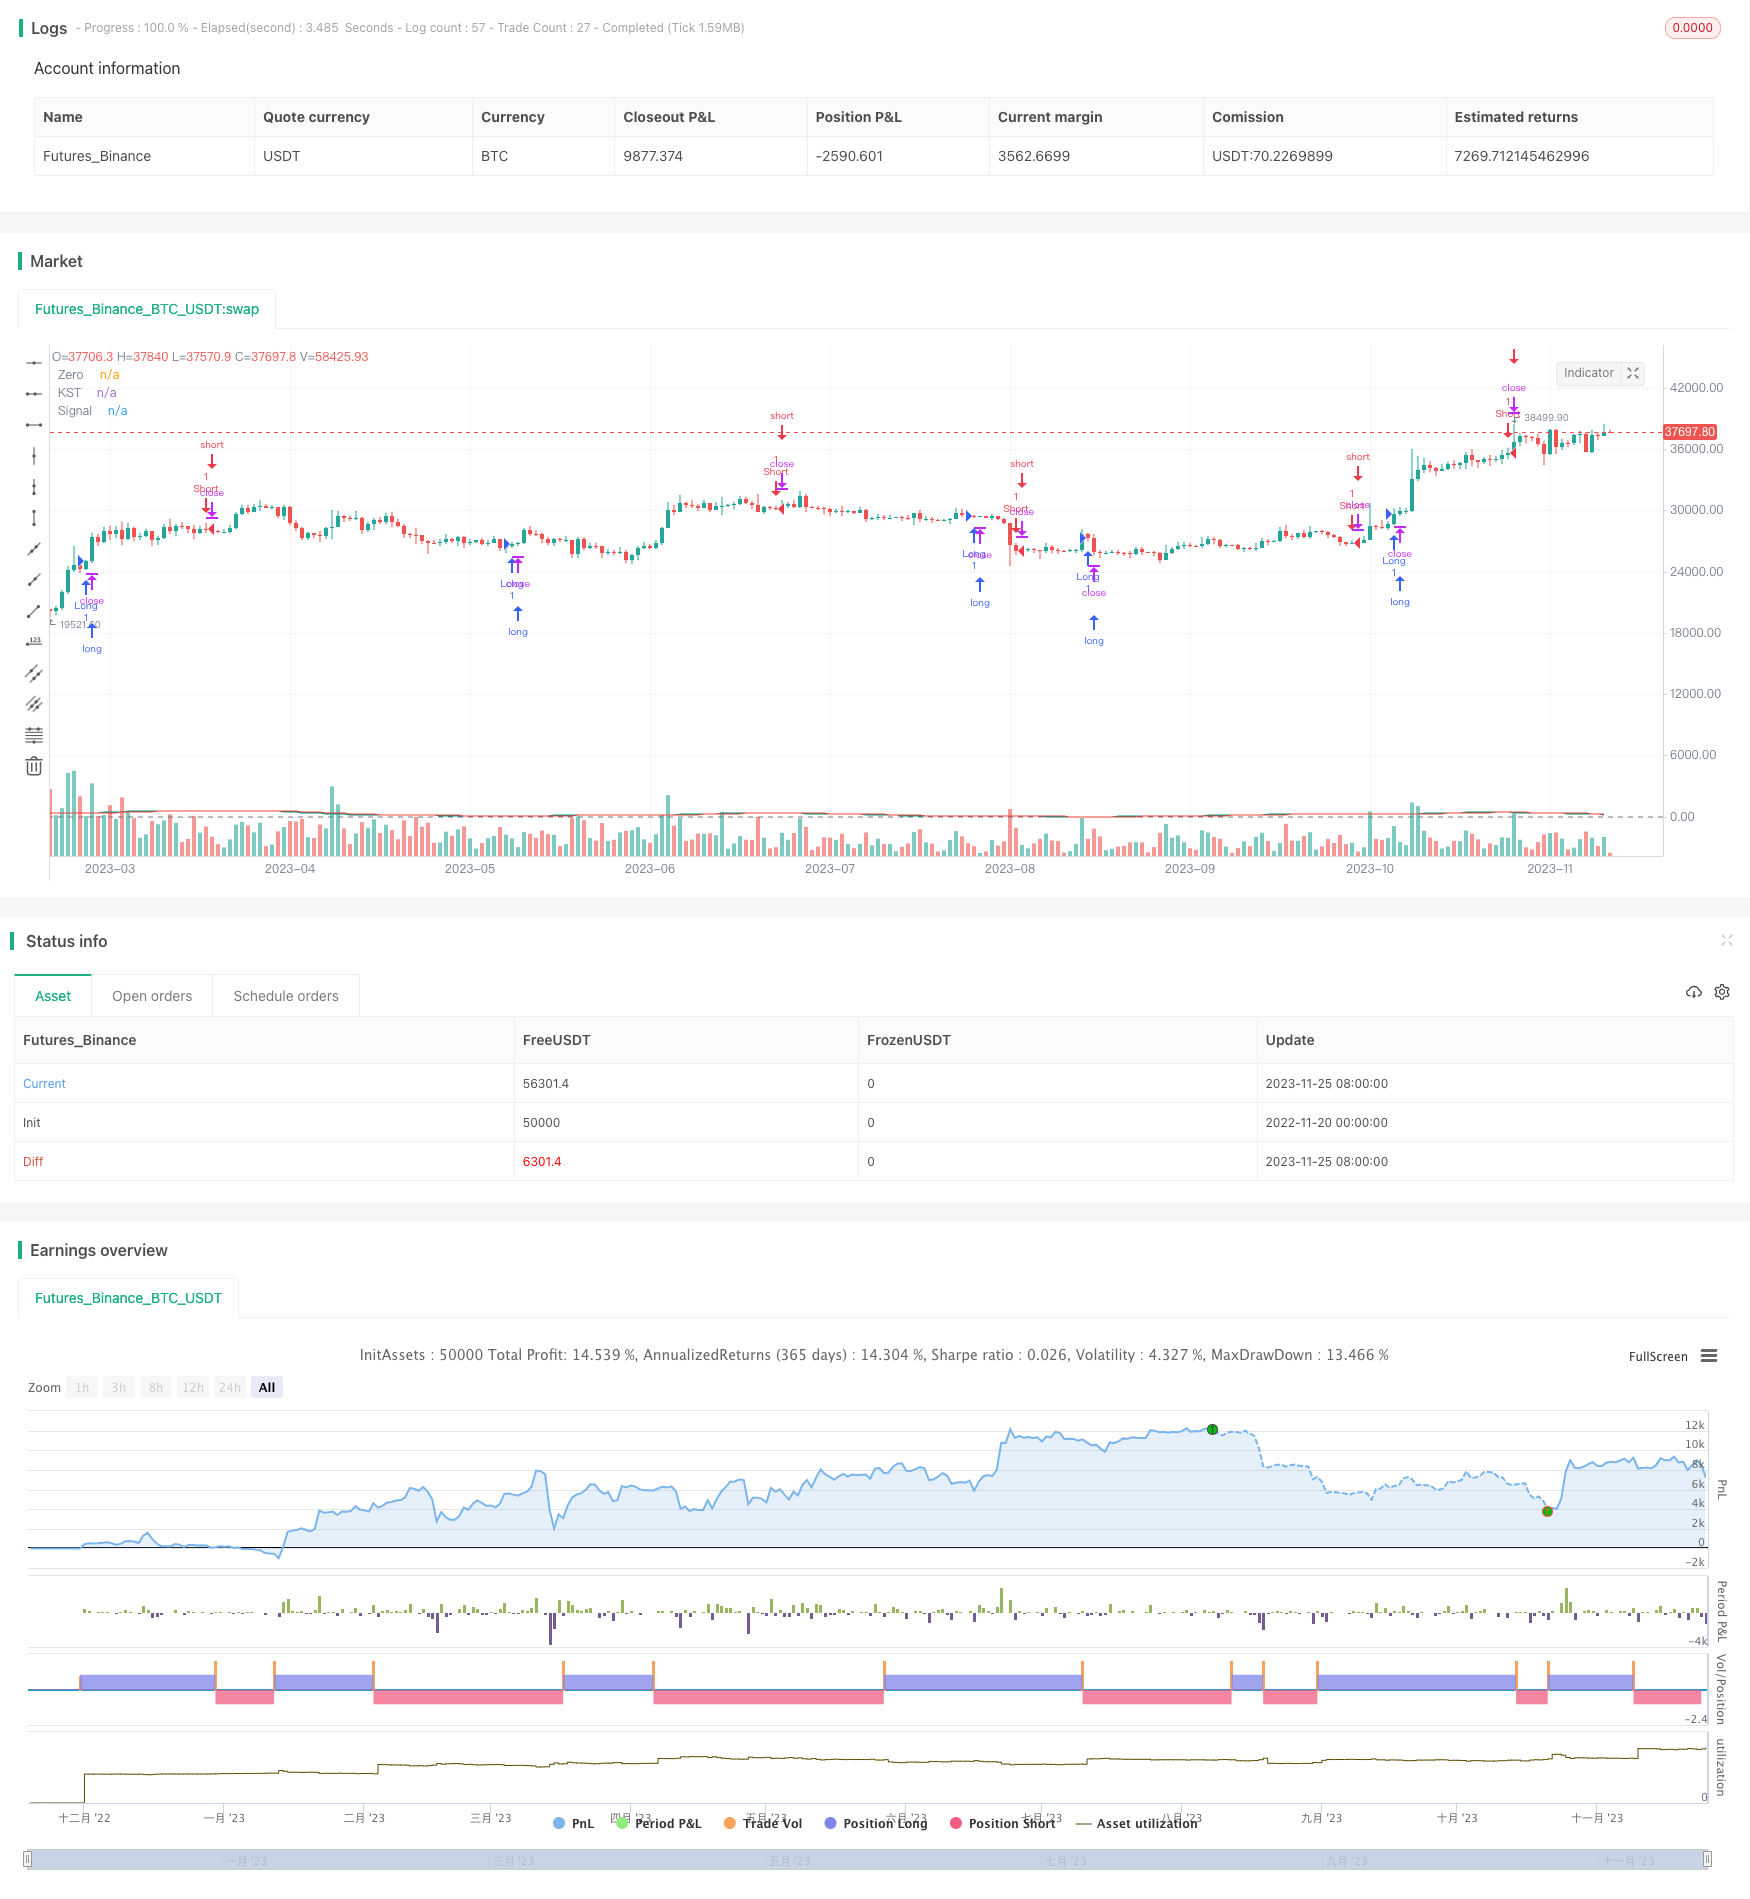
[trans]
概述
KST指标获利策略是一种应用于SPY 30分钟周期的选股策略。该策略利用KST指标的多空交叉来判断入场和出场时机。
策略原理
该策略主要基于KST指标。KST指标由以下几部分组成:
- ROC长度分别为11、15、20、33的4个不同长度的ROC曲线。
- 对上述ROC曲线分别应用长度为9、14、8、15的SMA平滑。
- 对平滑后的4个ROC曲线求加权和,权重分别为1、2、3、4。
- 对终的KST曲线再应用长度为9的SMA求得Signal曲线。
根据KST曲线和Signal曲线的金叉死叉来判断买卖点:
- KST上穿Signal为买入信号
- KST下穿Signal为卖出信号
优势分析
该策略主要有以下优势:
-
利用KST指标综合考虑了不同时间周期内的价格变动,使得策略更加稳定和可靠。
-
KST指标对ROC曲线进行了加权平均,使得更长周期的价格变化起主导作用,有利于捕捉市场趋势。
-
应用在SPY这种高流动性标的具有良好的实盘效果。
风险分析
该策略也存在一些风险:
-
KST指标和MA指标一样,在震荡行情中容易产生假信号。可通过调整参数优化。
-
Entry和Exit完全依赖指标,没有结合股票基本面和大市分析,容易在重大事件发生时产生大亏损。
-
选股范围仅限于SPY一个标的,可通过扩大选股范围分散单一标的带来的风险。
优化方向
该策略可从以下几个方向进行优化:
-
优化KST指标参数,寻找最佳参数组合。
-
结合波动率指标避免震荡行情的假信号。
-
增加止损策略控制单次亏损。
-
扩大股票池,适当纳入参数满足条件的个股,提高策略稳定性。
总结
该策略利用KST指标判断股票短线趋势,在SPY上取得了不错效果。我们可通过参数优化、风控措施等方法来提升策略稳定性和实战效果。也可以尝试扩大选股范围,使策略更具普适性。
||
Overview
The KST Indicator Profit Strategy is a stock picking strategy applied to the 30-minute cycle of SPY. This strategy uses KST indicator crossovers to determine entry and exit timing.
Strategy Principle
This strategy is mainly based on the KST indicator. The KST indicator consists of the following parts:
- Four ROC curves with lengths of 11, 15, 20, and 33 respectively.
- Apply SMAs with lengths of 9, 14, 8, and 15 to smooth the above ROC curves.
- Take a weighted sum of the four smoothed ROC curves, with weights of 1, 2, 3 and 4 respectively.
- Apply a length 9 SMA to the final KST curve to derive the Signal line.
Buy and sell signals are determined by golden crosses and death crosses between the KST line and the Signal line:
- KST line crossing above Signal line is buy signal.
- KST line crossing below Signal line is sell signal.
Advantage Analysis
The main advantages of this strategy are:
-
The KST indicator comprehensively considers price movements over different time horizons, making the strategy more stable and reliable.
-
The weighted averaging of the ROC curves in the KST indicator ensures that longer-term price changes play a leading role, which helps capture market trends.
-
Works well in high liquidity products like SPY.
Risk Analysis
There are also some risks to this strategy:
-
Like MA indicators, the KST indicator can produce false signals in sideways markets. This can be improved by parameter tuning.
-
Entries and exits rely completely on the indicator without considering fundamentals or market regimes, leading to large losses during significant events.
-
The investment universe contains only SPY, so single-asset risk may be high.
Optimization Directions
Possible ways to optimize the strategy:
-
Optimize KST parameters to find best combination.
-
Incorporate volatility indicator to avoid false signals during choppy markets.
-
Add stop loss orders to limit downside risk per trade.
-
Expand stock pool to include individual stocks meeting certain criteria to improve robustness.
Conclusion
This strategy identifies short-term trends in SPY using the KST indicator, with good backtest results. We can improve its stability and real-world performance through parameter tuning, risk controls and expanding stock selection criteria. Making it more universally applicable.
[/trans]
Strategy Arguments
| Argument | Default | Description |
|---|---|---|
| v_input_int_1 | 11 | ROC Length #1 |
| v_input_int_2 | 15 | ROC Length #2 |
| v_input_int_3 | 20 | ROC Length #3 |
| v_input_int_4 | 33 | ROC Length #4 |
| v_input_int_5 | 9 | SMA Length #1 |
| v_input_int_6 | 14 | SMA Length #2 |
| v_input_int_7 | 8 | SMA Length #3 |
| v_input_int_8 | 15 | SMA Length #4 |
| v_input_int_9 | 9 | Signal Line Length |
Source (PineScript)
/*backtest
start: 2022-11-20 00:00:00
end: 2023-11-26 00:00:00
period: 1d
basePeriod: 1h
exchanges: [{"eid":"Futures_Binance","currency":"BTC_USDT"}]
*/

//@version=5
strategy("KST Strategy", shorttitle="KST", overlay=true)

roclen1 = input.int(11, minval=1, title="ROC Length #1")
roclen2 = input.int(15, minval=1, title="ROC Length #2")
roclen3 = input.int(20, minval=1, title="ROC Length #3")
roclen4 = input.int(33, minval=1, title="ROC Length #4")
smalen1 = input.int(9, minval=1, title="SMA Length #1")
smalen2 = input.int(14, minval=1, title="SMA Length #2")
smalen3 = input.int(8, minval=1, title="SMA Length #3")
smalen4 = input.int(15, minval=1, title="SMA Length #4")
siglen = input.int(9, minval=1, title="Signal Line Length")

smaroc(roclen, smalen) =>
    ta.sma(ta.roc(close, roclen), smalen)

kst = smaroc(roclen1, smalen1) + 2 * smaroc(roclen2, smalen2) + 3 * smaroc(roclen3, smalen3) + 4 * smaroc(roclen4, smalen4)
sig = ta.sma(kst, siglen)

// Plot the KST and Signal Line
plot(kst, color=#009688, title="KST")
plot(sig, color=#F44336, title="Signal")
hline(0, title="Zero", color=#787B86)

// Strategy logic
longCondition = ta.crossover(kst, sig)
shortCondition = ta.crossunder(kst, sig)

strategy.entry("Long", strategy.long, when=longCondition)
strategy.entry("Short", strategy.short, when=shortCondition)
Detail
https://www.fmz.com/strategy/433401
Last Modified
2023-11-27 11:37:49