
12 KiB
Name
EMA交叉追踪策略EMA-Crossover-tracking-Strategy
Author
ChaoZhang
Strategy Description
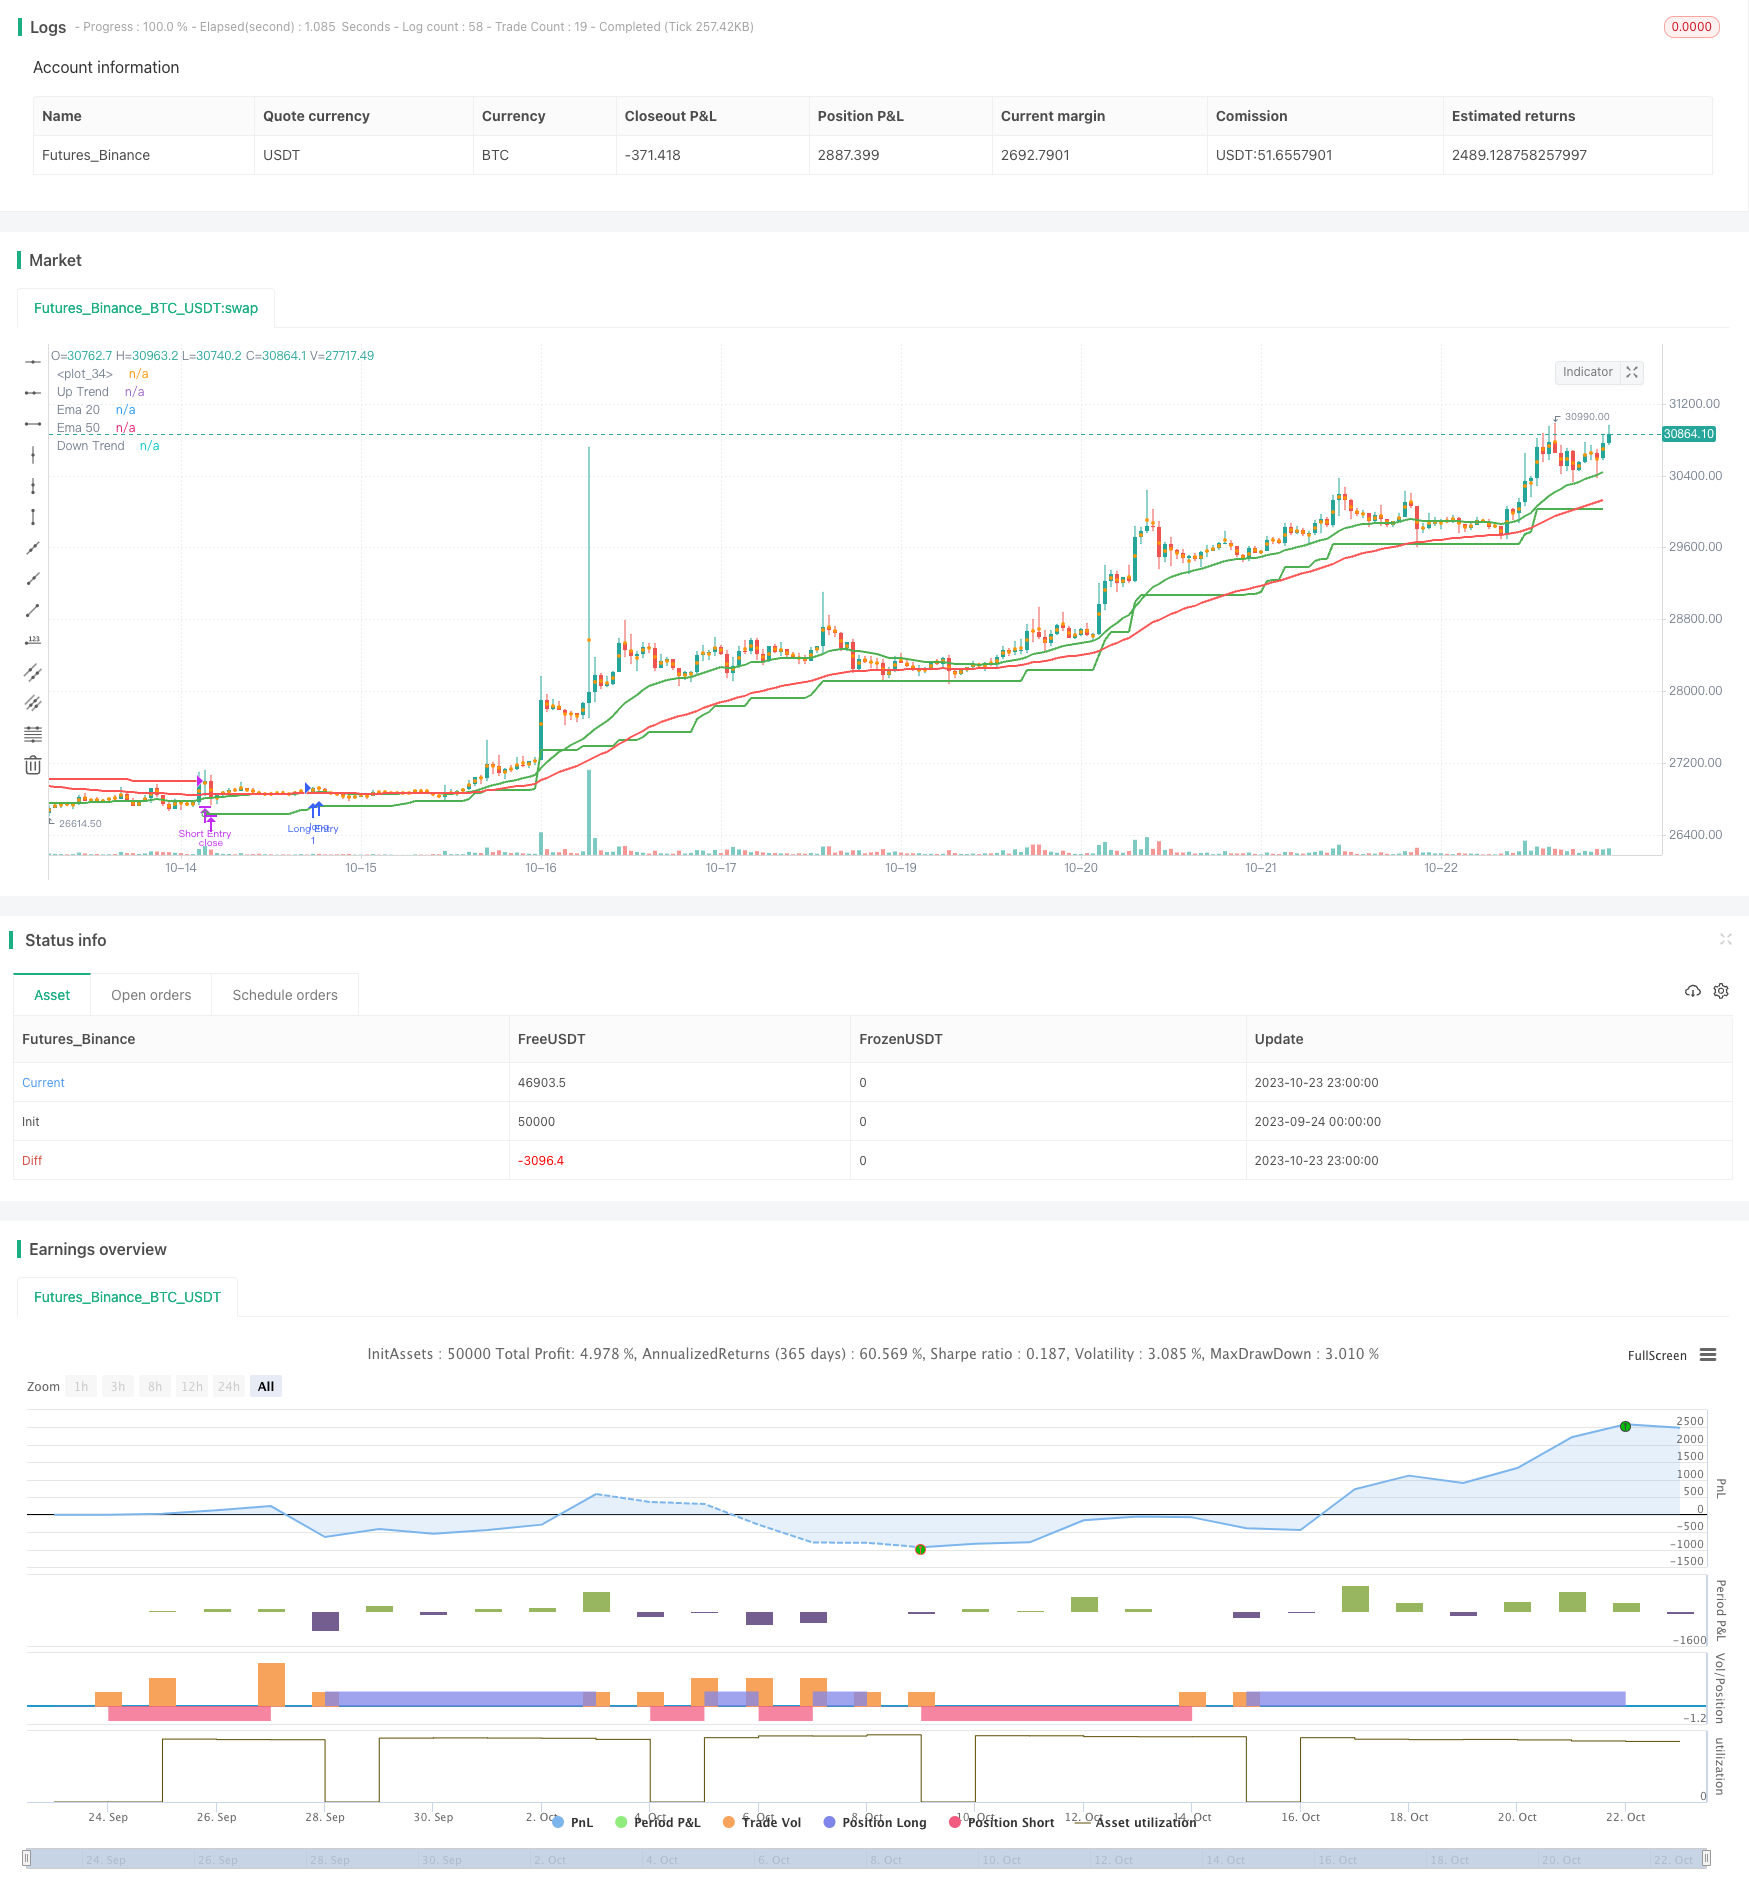 [trans]
概述
EMA交叉策略通过追踪两个不同周期的EMA均线的交叉情况,判断价格趋势从而产生买入和卖出信号。当短周期EMA上穿长周期EMA时产生买入信号,当短周期EMA下穿长周期EMA时产生卖出信号。该策略同时结合SuperTrend指标过滤假突破。
策略原理
该策略主要基于EMA均线的金叉死叉原理。EMA均线能够平滑价格数据过滤噪音,通过EMA均线的交叉情况判断价格趋势。当短周期EMA(20周期)上穿长周期EMA(50周期)时,代表短周期价格现在位于长周期价格之上,说明价格存在突破上升趋势,产生买入信号。当短周期EMA下穿长周期EMA时,代表短周期价格跌破长周期价格,说明价格存在下跌趋势,产生卖出信号。
同时,该策略结合SuperTrend指标来过滤EMA交叉产生的假信号。SuperTrend指标是根据ATR计算出的上轨和下轨,可以更准确判断真实趋势。当价格突破SuperTrend指标的上轨时产生买入信号,当价格跌破SuperTrend指标下轨时产生卖出信号。只有在SuperTrend指标也同时产生买入/卖出信号时,EMA交叉才会产生真正的交易信号。这可以过滤由于价格震荡而产生的EMA交叉假信号。
具体来说,该策略判断条件如下:
-
当20EMA上穿50EMA,且价格突破SuperTrend上轨时,产生买入信号;
-
当20EMA下穿50EMA,且价格跌破SuperTrend下轨时,产生卖出信号。
通过EMA交叉判断大趋势,同时结合SuperTrend指标过滤震荡,可以提高策略交易信号的准确率。
优势分析
EMA交叉策略具有以下优势:
-
操作简单,易于实现。仅需要计算两个EMA均线的交叉情况。
-
对价格震荡有一定的过滤作用。EMA作为移动平均线,能够过滤掉部分噪音。
-
结合SuperTrend指标,可以进一步过滤噪音,减少假信号。
-
可以通过调整EMA周期参数,适应不同市场环境。
-
可自定义长短仓位,可实现多种交易方式。
-
可在不同时间周期上实现,适用于不同型交易者。
风险分析
EMA交叉策略也存在一些风险:
-
当市场出现剧烈波动时,EMA交叉signals可能滞后,无法及时反映价格变化。
-
EMA均线具有滞后性,可能产生错误信号。
-
短周期EMA和长周期EMA参数设置不当,可能导致产生过多错误信号。
-
单纯依靠均线交叉无法确定市场实际趋势,存在一定盲目性。
-
需要选择合适的止损策略控制风险。
以下几点可以降低风险:
-
优化EMA周期参数,选择合适的快慢均线周期。
-
适当缩短持仓时间,及时止损。
-
结合其它指标如移动平均线、K线形态等进行综合判断。
-
适当调整交易频率,降低交易次数。
优化方向
该策略可以从以下几个方面进行优化:
-
优化EMA均线的周期参数,适应不同周期和市场环境。可以引入自适应参数优化机制。
-
尝试不同的均线指标,如SMA,KWMA等。
-
结合更多指标进行组合交易,形成多因子模型。如MACD,RSI等。引入机器学习算法进行参数优化和权重调整。
-
增加止损策略,如跟踪止损,百分比止损等来控制风险。
-
引入交易量过滤,结合交易量指标避免虚假信号。
-
优化策略 exits,设定离场规则。如结合K线形态,突破等 EXIT signals。
-
在较高时间周期确认趋势,在较低时间周期入场,实现趋势跟踪。
总结
EMA交叉策略是一种简单实用的趋势跟踪策略。它能够识别价格中期趋势,产生买入卖出timing信号。结合SuperTrend指标可以有效过滤噪音,减少错误trades。但该策略依然存在滞后,产生错误信号的风险。通过参数优化,止损,组合其他指标等方式可以增强策略效果。EMA交叉策略易于操作SIMPLE,适合跟踪中长线趋势,是一种适合新手交易者的有效策略。
||
Overview
The EMA crossover strategy generates buy and sell signals by tracking the crossover between two EMA lines of different periods. When the shorter period EMA crosses over the longer period EMA, a buy signal is generated. When the shorter period EMA crosses below the longer period EMA, a sell signal is generated. This strategy also incorporates the SuperTrend indicator to filter false breakouts.
Strategy Logic
This strategy is mainly based on the golden cross and death cross of EMA lines. EMA lines can smooth price data and filter out noise. The crossover between EMA lines indicates price trend changes. When the shorter period EMA (20-period) crosses over the longer period EMA (50-period), it means the short term price is now above the long term price, implying an upside breakout trend and generating a buy signal. When the shorter period EMA crosses below the longer period EMA, it means the short term price breaks below the long term price, implying a downtrend and generating a sell signal.
In addition, this strategy uses the SuperTrend indicator to filter false signals generated by EMA crossovers. The SuperTrend indicator is calculated based on the ATR to plot upper and lower bands that better define the real trend. When the price breaks above the SuperTrend upper band, a buy signal is generated. When the price breaks below the SuperTrend lower band, a sell signal is generated. The EMA crossover signals are only valid when confirmed by the SuperTrend signals. This helps to remove false signals caused by price fluctuations.
Specifically, the strategy entry logic is defined as follows:
-
When 20EMA crosses above 50EMA, and price breaks above SuperTrend upper band, generate buy signal.
-
When 20EMA crosses below 50EMA, and price breaks below SuperTrend lower band, generate sell signal.
Using EMA crossovers to determine the major trend direction combined with SuperTrend filter could improve the accuracy of trading signals.
Advantages
The EMA crossover strategy has the following advantages:
-
Simple to implement. Only requires calculating two EMA crossovers.
-
Provides some noise filtering effect. EMA as moving average can filter out some noise.
-
Combining with SuperTrend further reduces false signals caused by price fluctuations.
-
The EMA periods can be adjusted for different market environments.
-
Customizable for long or short direction trades. Applicable to various trading approaches.
-
Can be implemented in different timeframes for various trading styles.
Risks
There are also some risks associated with the EMA crossover strategy:
-
EMA crossover signals may lag during extreme price swings, failing to timely reflect price changes.
-
EMA lines have lagging effect, which could generate incorrect signals.
-
Improper EMA period settings could lead to excessive false signals.
-
Crossover alone cannot determine actual trend, still largely lagging.
-
Proper risk management like stop loss is needed to control risks.
Some ways to reduce the risks:
-
Optimize EMA periods to fit better fast and slow lines.
-
Shorten holding period and apply timely stop loss.
-
Combine with other indicators like moving averages, candlestick patterns for comprehensive judgment.
-
Adjust trading frequency to lower number of trades.
Enhancements
This strategy can be enhanced and optimized in the following aspects:
-
Optimize EMA periods for different cycles and market environments. Introduce adaptive optimization mechanisms.
-
Test different moving average indicators like SMA, KWMA.
-
Incorporate more technical indicators to form multivariate models, like MACD, RSI. Apply machine learning algorithms to optimize parameters and weights.
-
Add stop loss techniques like trailing stop loss, percentage stop loss to control risks.
-
Introduce volume filters working with volume indicators to avoid false signals.
-
Optimize exits by setting exit rules, combining with chart patterns, breakouts etc.
-
Confirm trend on higher timeframe, enter trades on lower timeframe to follow trends.
Conclusion
The EMA crossover strategy is a simple and practical trend following system. It can identify mid-term trends and generate timing signals. Combining with SuperTrend filter could reduce false trades effectively. But risks like lagging and wrong signals still exist. The strategy can be enhanced via parameter optimization, stop loss, combining indicators, etc. The EMA crossover strategy is easy to use, suitable for mid-long term trend tracking, and effective for novice traders.
[/trans]
Strategy Arguments
| Argument | Default | Description |
|---|---|---|
| v_input_1 | 11 | ATR Period |
| v_input_float_1 | 3 | ATR Multiplier |
| v_input_2 | true | Change ATR Calculation Method ? |
| v_input_3 | true | Show Buy/Sell Signals ? |
| v_input_4 | true | Highlighter On/Off ? |
| v_input_bool_1 | true | Long Only |
| v_input_bool_2 | true | Short Only |
Source (PineScript)
/*backtest
start: 2023-09-24 00:00:00
end: 2023-10-24 00:00:00
period: 1h
basePeriod: 15m
exchanges: [{"eid":"Futures_Binance","currency":"BTC_USDT"}]
*/

// This source code is subject to the terms of the Mozilla Public License 2.0 at https://mozilla.org/MPL/2.0/
// © alokbothra

//@version=5
strategy("Ema Crossover", overlay=true, initial_capital = 1000)
start = timestamp(2021,1,1,0,0)
end = timestamp(2023,10,30,0,0)
plot (ta.ema(close,20), title = "Ema 20", color = color.green , linewidth = 2)
plot (ta.ema(close,50), title = "Ema 50", color = color.red, linewidth = 2 )

//supertrend 1
Periods = input(title='ATR Period', defval=11)
Multiplier = input.float(title='ATR Multiplier', step=0.1, defval=3)
changeATR = input(title='Change ATR Calculation Method ?', defval=true)
showsignals = input(title='Show Buy/Sell Signals ?', defval=true)
highlighting = input(title='Highlighter On/Off ?', defval=true)
atr2 = ta.sma(ta.tr, Periods)
atr = changeATR ? ta.atr(Periods) : atr2
up = close - Multiplier * atr
up1 = nz(up[1], up)
up := close[1] > up1 ? math.max(up, up1) : up
dn =close+ Multiplier * atr
dn1 = nz(dn[1], dn)
dn := close[1] < dn1 ? math.min(dn, dn1) : dn
trend = 1
trend := nz(trend[1], trend)
trend := trend == -1 and close > dn1 ? 1 : trend == 1 and close < up1 ? -1 : trend
upPlot = plot(trend == 1 ? up : na, title='Up Trend', style=plot.style_linebr, linewidth=2, color=color.new(color.green, 0))
buySignal = trend == 1 and trend[1] == -1
plotshape(buySignal ? up : na, title='UpTrend Begins', location=location.absolute, style=shape.circle, size=size.tiny, color=color.new(color.green, 0))
dnPlot = plot(trend == 1 ? na : dn, title='Down Trend', style=plot.style_linebr, linewidth=2, color=color.new(color.red, 0))
sellSignal = trend == -1 and trend[1] == 1
plotshape(sellSignal ? dn : na, title='DownTrend Begins', location=location.absolute, style=shape.circle, size=size.tiny, color=color.new(color.red, 0))
mPlot = plot(ohlc4, title='', style=plot.style_circles, linewidth=0)
changeCond = trend != trend[1]

longonly = input.bool(defval = true, title = 'Long Only')
shortonly = input.bool(defval = true, title = 'Short Only')

longCondition = (ta.ema(close, 20) >= ta.ema(close, 50))
shortCondition = (ta.ema(close, 20) <= ta.ema(close, 50))
long = (trend == 1)
short = (trend == -1)
sell= short
cover= long
if time >= start and time < end
    if longonly
        if ((longCondition) and (long))
            strategy.entry ("Long Entry", strategy.long, comment ="Long Entry")
        if strategy.position_size > 0
            strategy.close("Long Entry", when = sell, comment = "Long Exit")
    if shortonly
        if ((shortCondition) and (short))
            strategy.entry("Short Entry", strategy.short, comment = "Short Entry")
        if strategy.position_size < 0
            strategy.close("Short Entry", when = cover, comment = "Short Exit")
Detail
https://www.fmz.com/strategy/430174
Last Modified
2023-10-25 17:44:35