
7.7 KiB
Name
DPD-RSI-BB量化策略DPD-RSI-BB-Quantitative-Strategy
Author
ChaoZhang
Strategy Description
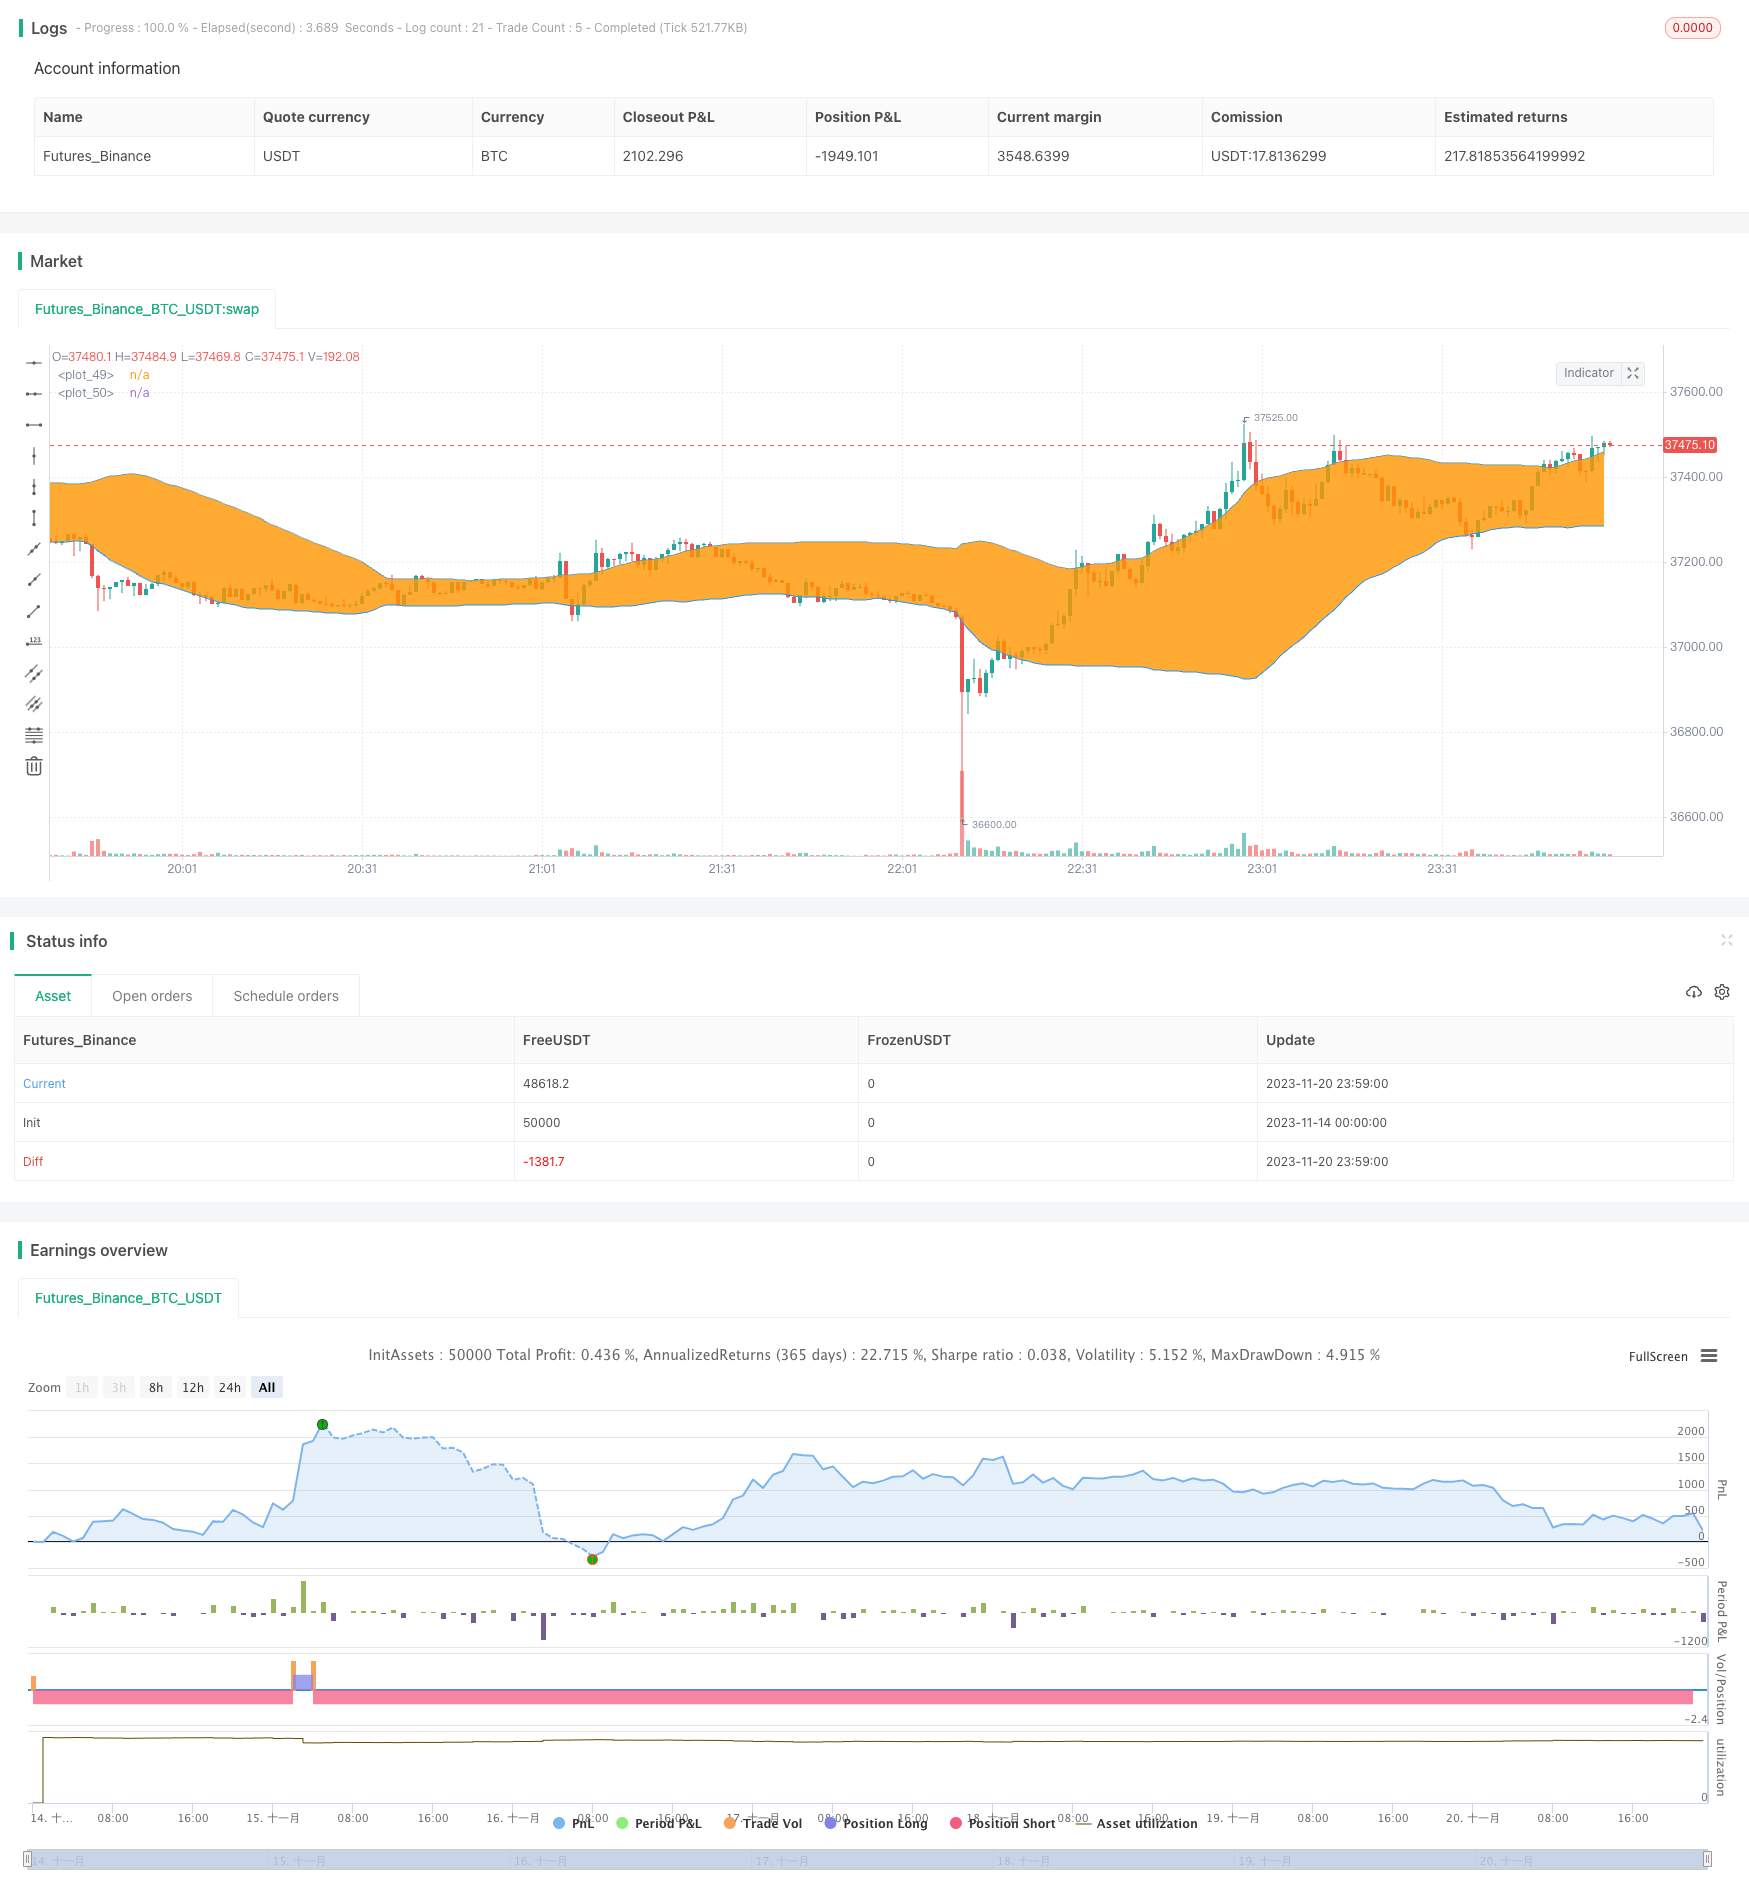
[trans]
概述
DPD-RSI-BB量化策略是一种同时结合DPD、RSI和布林带三个指标的股票交易策略。该策略利用DPD判断趋势,RSI判断超买超卖,布林带判断支撑压力位进行入场。
策略原理
该策略主要由以下几部分组成:
-
DPD指标判断趋势
使用双EMA平均线构建DEMA均线,并计算价格与DEMA的差价比例作为趋势判断指标,当差价比例低于设定阈值时作为看涨信号。
-
RSI指标判断超买超卖
计算一定周期内的RSI值,RSI高于设定上限判断为超买区,RSI低于设定下限判断为超卖区。
-
布林带判断支撑压力
计算一定周期的中轨、上轨和下轨,价格接近上轨作为看跌信号,价格接近下轨作为看涨信号。
-
综合判断
当DPD差价比例低于阈值,RSI低于超卖区下限,且价格低于布林带上轨时,产生看涨信号;当RSI高于超买区上限,DPD差价比例高于阈值,且价格高于布林带上轨时,产生看跌信号。
优势分析
该策略具有以下优势:
-
多指标综合判断,避免单一指标产生的误信号。
-
利用RSI指标判断超买超卖情况,设置事先止损止盈点。
-
DPD指标能较好判断价格趋势,布林带能判断支撑压力位。
-
不同参数的灵活设定,可针对不同股票进行优化。
风险及优化
该策略也存在一些风险:
-
多指标组合判断会使策略较为复杂,参数设定较难。
-
DPD、RSI等指标存在一定延迟,可能错过最佳入场时点。
-
需要优化参数以适应不同周期和股票特性。
可从以下方面进行优化:
-
调整指标参数,优化入场退出点位。
-
增加止损机制,严格控制单笔损失。
-
测试不同股票和周期参数,评估策略效果。
总结
DPD-RSI-BB策略综合多个指标判断,回避单一指标产生的假信号。通过参数优化,可成为一个较强的股票交易策略。但该策略也有可能因复杂度大而难以完全回避市场风险,需谨慎使用。
||
Overview
The DPD-RSI-BB quantitative strategy combines three indicators - DPD, RSI and Bollinger Bands for stock trading. It uses DPD to determine the trend, RSI to judge overbought and oversold levels, and Bollinger Bands to identify support and resistance levels for entering the market.
Strategy Logic
The strategy consists of the following main components:
-
DPD indicator to determine the trend
It builds the DEMA line using double EMA averages and calculates the price differential percentage against DEMA as a trend determination indicator. A low difference percentage is used as a bullish signal.
-
RSI indicator to judge overbought and oversold conditions
It calculates the RSI value over a certain period. RSI above the upper limit is judged as an overbought zone and RSI below the lower limit is judged as an oversold zone.
-
Bollinger Bands to identify support and resistance
It calculates the middle band, upper band and lower band over a certain period. Price approaching the upper band signals a bearish outlook, while price approaching the lower band signals a bullish outlook.
-
Comprehensive judgment
When the DPD price differential percentage is lower than the threshold, RSI is lower than the oversold zone's lower limit, and price is lower than the Bollinger upper band, a bullish signal is generated. When RSI is higher than the overbought zone's upper limit, DPD differential percentage is higher than the threshold, and price is higher than the Bollinger upper band, a bearish signal is generated.
Advantage Analysis
The strategy has the following advantages:
-
Comprehensive judgment using multiple indicators avoids false signals from a single indicator.
-
Using the RSI indicator to judge overbought and oversold conditions allows setting stop loss and take profit points beforehand.
-
The DPD indicator can better determine price trends, while Bollinger Bands can identify support and resistance levels.
-
Flexible parameter settings allow optimizations for different stocks.
Risks and Optimization
The strategy also has some risks:
-
The combination of multiple indicators makes the strategy rather complex with difficulty in parameter tuning.
-
Indicators like DPD and RSI have certain lags, which may miss the best entry timing.
-
Parameters need to be optimized to suit different cycles and stock characteristics.
The following aspects can be optimized:
-
Adjust indicator parameters to optimize entry and exit points.
-
Add stop loss mechanisms to strictly control per trade loss.
-
Test on different stocks and cycle parameters to evaluate strategy performance.
Conclusion
The DPD-RSI-BB strategy combines multiple indicators for judgments to avoid false signals from a single indicator. Through parameter optimization, it can become a relatively strong stock trading strategy. But due to its complexity, it may still fail to completely hedge against market risks and should be used with caution.
[/trans]
Strategy Arguments
| Argument | Default | Description |
|---|---|---|
| v_input_1 | -1 | buyper |
| v_input_2 | false | sellper |
| v_input_3 | 50 | Dema Length |
| v_input_4 | 6 | lengthrsi |
| v_input_5 | 20 | overSold |
| v_input_6 | 60 | overBought |
| v_input_7 | 50 | lengthbb |
| v_input_8 | 1.5 | multlow |
| v_input_9 | 1.5 | multup |
| v_input_10 | 2018 | yearfrom |
| v_input_11 | 2039 | yearuntil |
| v_input_12 | 6 | monthfrom |
| v_input_13 | 12 | monthuntil |
| v_input_14 | true | dayfrom |
| v_input_15 | 31 | dayuntil |
Source (PineScript)
/*backtest
start: 2023-11-14 00:00:00
end: 2023-11-21 00:00:00
period: 1m
basePeriod: 1m
exchanges: [{"eid":"Futures_Binance","currency":"BTC_USDT"}]
*/

//@version= 2
strategy("DPD+RSI+BB ",overlay=true)
price=close


//############### DPD  #################


buyper =input(-1,step=0.1)
sellper=input(0,step=0.1)
demalen = input(50,title="Dema Length")
e1= ema(close,demalen)
e2=ema(e1,demalen)
demaprice  =   2 * e1 - e2
demadifper =  ((price-demaprice)/price)*100


//############## DPD #####################

//############# RSI ####################


lengthrsi = input(6)
overSold = input( 20 )
overBought = input( 60 )

vrsi = rsi(price, lengthrsi)

//########## RSI #######################

//############### BB #################

lengthbb = input(50, minval=1)
multlow = input(1.5, minval=0.001, maxval=50,step=0.1)
multup = input(1.5,minval=0.001,maxval=50,step=0.1)

basisup = sma(close, lengthbb)
basislow = sma(close, lengthbb)

devup = multup * stdev(close, lengthbb)

devlow = multlow*stdev(close,lengthbb)

upperbb = basisup + devup
lowerbb = basislow - devlow

p1 = plot(upperbb, color=blue)
p2 = plot(lowerbb, color=blue)
fill(p1, p2)


//########### BB ###################


yearfrom = input(2018)
yearuntil =input(2039)
monthfrom =input(6)
monthuntil =input(12)
dayfrom=input(1)
dayuntil=input(31)


if (  (demadifper<buyper) and crossover(vrsi,overSold) and  (price < upperbb) and   year >= yearfrom and year <= yearuntil and month>=monthfrom and month <=monthuntil and dayofmonth>=dayfrom and dayofmonth < dayuntil)
    strategy.entry("BUY", strategy.long, stop=close, oca_name="TREND",  comment="BUY")

else
    strategy.cancel(id="BUY")


if (   price>upperbb and vrsi>overBought and demadifper>sellper   and  year >= yearfrom and year <= yearuntil and month>=monthfrom and month <=monthuntil and dayofmonth>=dayfrom and dayofmonth < dayuntil )

    strategy.entry("SELL", strategy.short,stop=close, oca_name="TREND",  comment="SELL")
else
    strategy.cancel(id="SELL")
Detail
https://www.fmz.com/strategy/432903
Last Modified
2023-11-22 16:18:14