
9.3 KiB
Name
CCI强势突破策略CCI-Strong-Breakthrough-Strategy
Author
ChaoZhang
Strategy Description
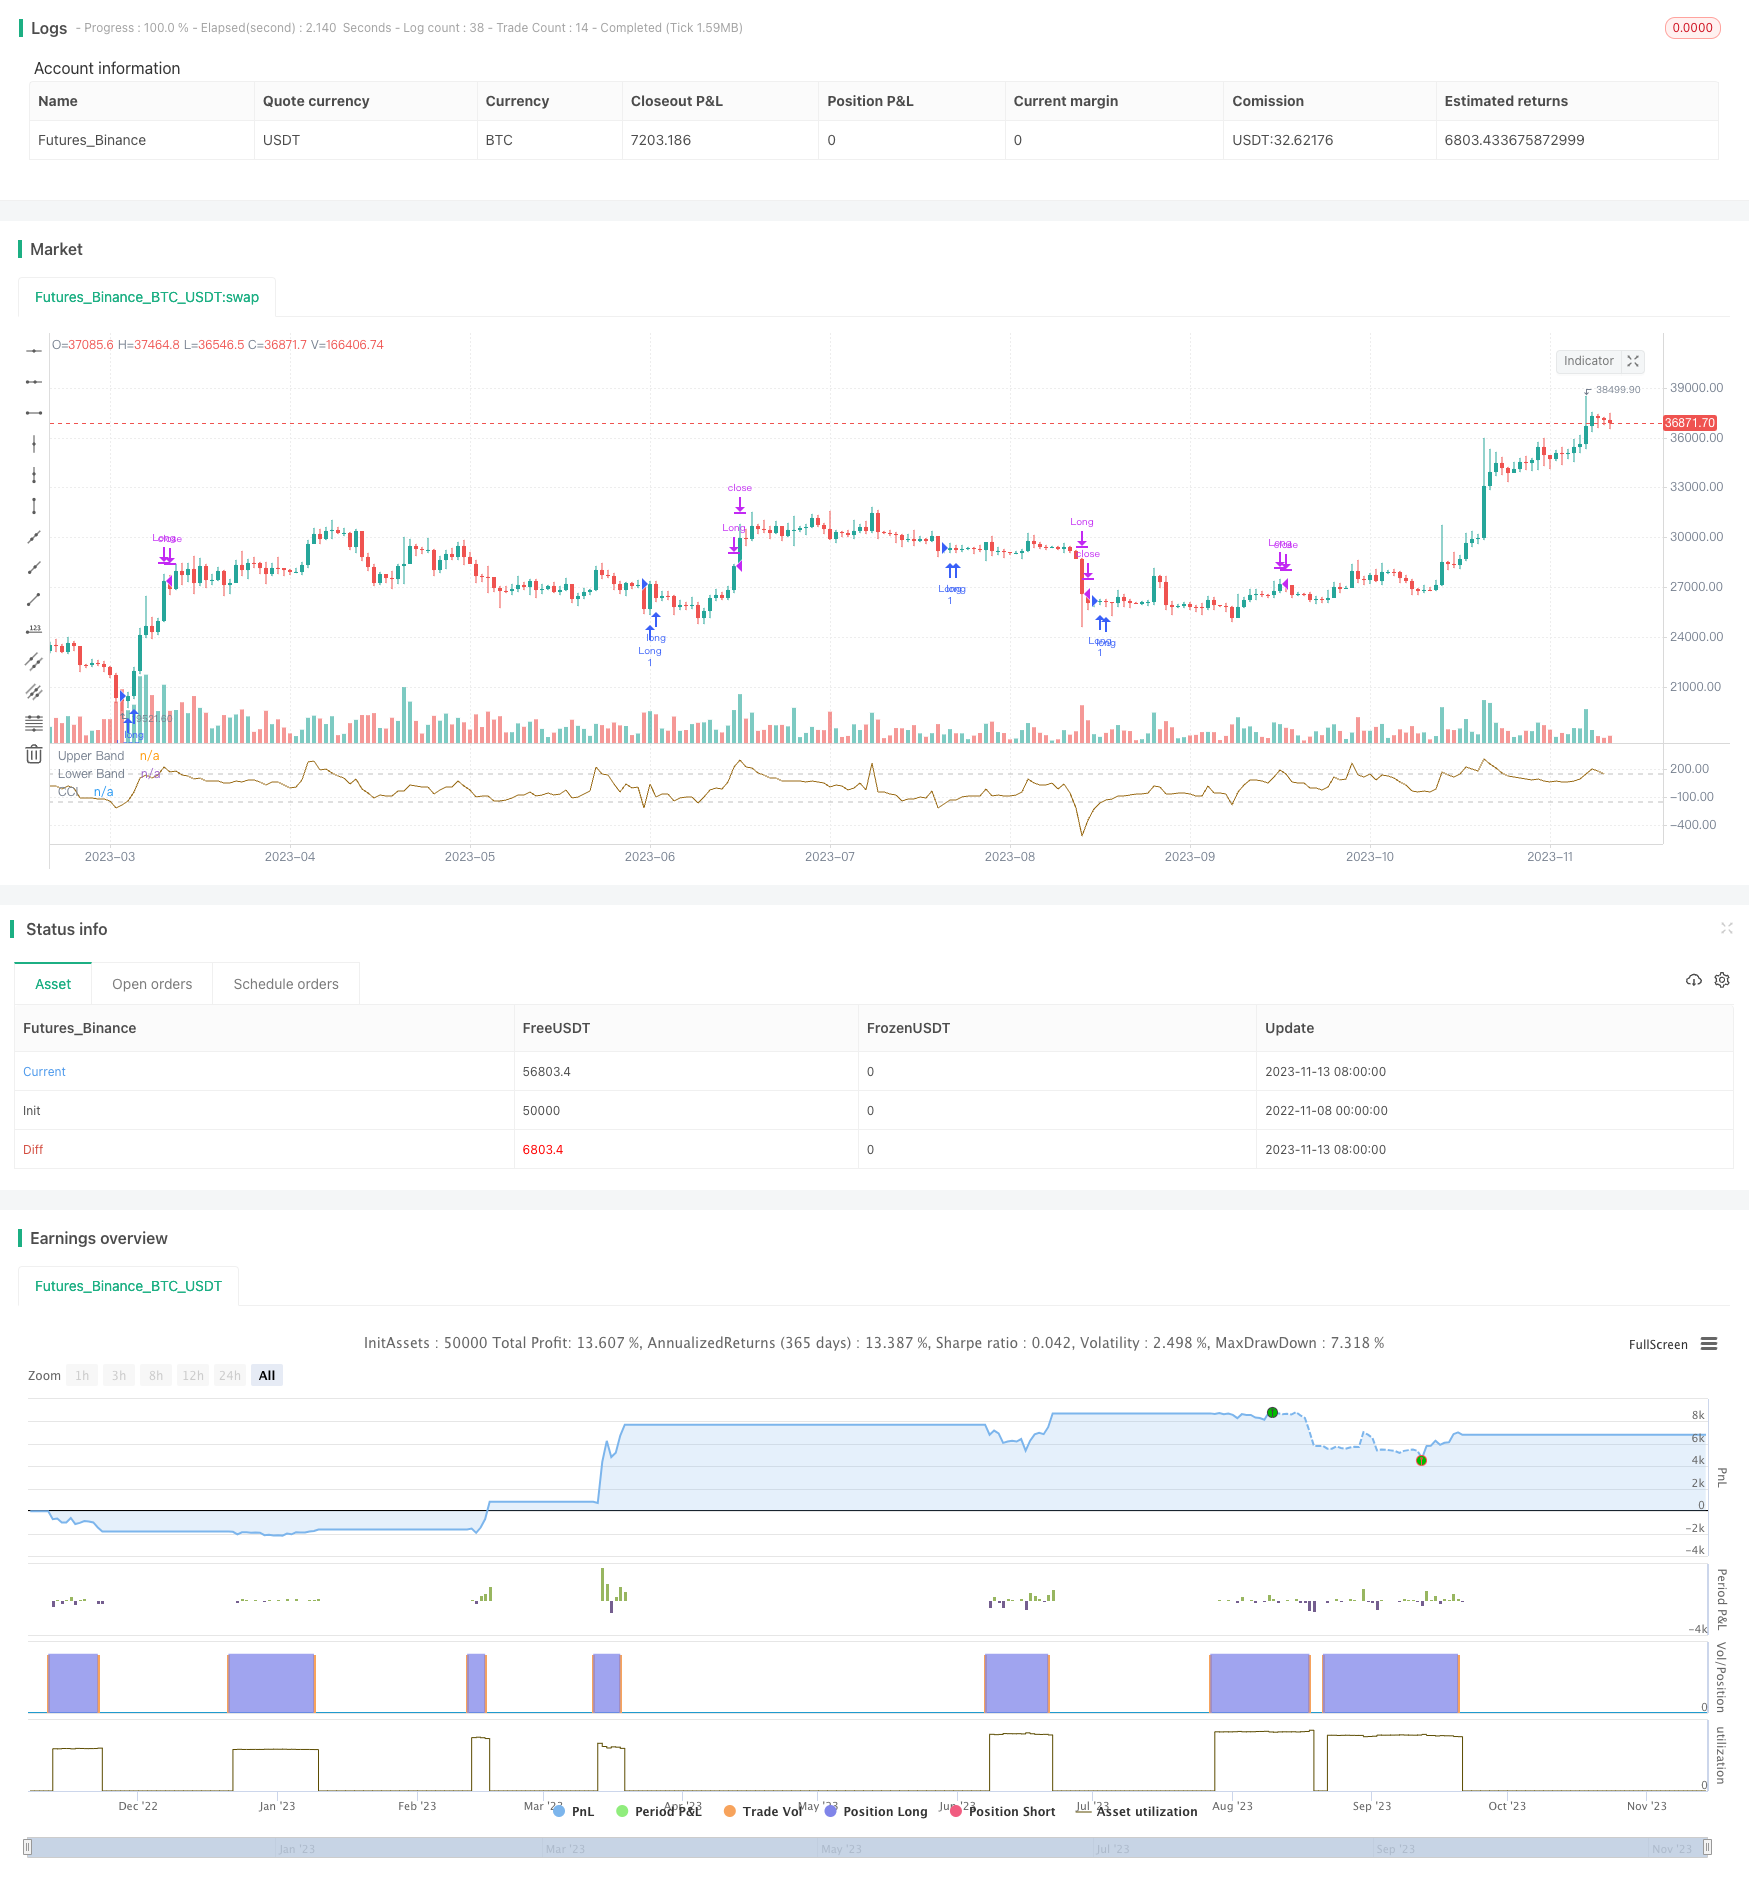 [trans]
概述
该策略基于经典商品通道指数(CCI),只做多头。当CCI指标处于极低水平(CCI <-150 或用户定义阈值),并且重新取得力度(即CCI>前根K线的CCI)时,同时对价格“力度”本身进行过滤(即发出信号的K线收盘价必须高于开盘价的一定幅度 - 固定为0.25%),系统会进入市场。 当达到止损或者价格高于CCI上带时,平仓离场。
该策略用于获得高胜率(超过50%)的交易,而非追求捕捉趋势的全部长度。因此,适用于“看到潜在亏损就受不了”的交易者。
策略原理
-
使用ta.sma()和ta.dev()函数构建CCI指标及其区间带。
-
使用input选择起始交易日期,设置回测窗口。
-
入场条件:CCI下穿低线并开始上涨,同时要求信号K线收盘价高于开盘价0.25%。
-
出场条件1:CCI上穿上线,止盈离场。
-
出场条件2:跌破止损线,亏损离场。
-
策略仅做多,根据CCI指标力度选择入场时机,同时利用止损控制风险。
优势分析
该策略具有以下优势:
-
利用CCI指标识别超买超卖情况,能够有效抓住反转机会。
-
仅做多方向,避免错误操作带来的过多风险。
-
采用价格力度过滤,确保入场时价格已经形成支撑。
-
止损机制控制单笔亏损,有效管理资金。
-
回测参数灵活,可调整入场过滤条件。
-
胜率较高,适合注重资金管理的投资者。
-
策略思路清晰,代码实现简洁易懂。
风险分析
该策略也存在一定风险:
-
仅做多方向,容易错过短线向下趋势。
-
CCI参数设置不当可能导致失效。
-
停损设置过于宽松,无法有效控制亏损。
-
多头行情过强,止损被突破造成较大亏损。
-
交易频率过高带来交易成本压力。
对应风险管理措施:
-
优化CCI参数,寻找最佳值。
-
调整止损幅度,在风险和止损被突破概率之间找到平衡。
-
交易成本考虑在内,控制入场频率。
-
结合趋势和区间判断,避免单边方向交易。
优化方向
该策略可以从以下几个方面进行优化:
-
采用动态止损,根据市场波动程度调整止损距离。
-
结合MACD等指标,避免止损过于宽松。
-
增加卖出机会,在cci指标过热时考虑做空。
-
考虑交易成本因素,设置最小止盈距离。
-
优化参数与策略时间框架结合,寻找最佳组合。
-
利用机器学习方法自动优化参数。
-
增加资金管理模块,动态调整仓位。
总结
总而言之,该策略利用CCI指标的超买超卖特征,在价格形成支撑的情况下做多,通过止损控制风险,追求高胜率交易。策略优势在于简单易操作,风险控制到位。存在的不足之处在于仅做多、止损过于固定等,这些问题都可以通过参数优化、增加卖点、动态止损等方式得到改善。该策略适合追求高胜率、注重资金管理的投资者。
||
Overview
This strategy is based on the classic Commodity Channel Index (CCI) and only goes long. It enters the market when the CCI indicator is at an extremely low level (CCI <-150 or user-defined threshold) and regains strength (i.e. CCI> CCI of previous candle), with a filter on the "strength" of the prices themselves (i.e. the closing of the signal bar must be higher than a certain difference - fixed at 0.25% - from the opening).
The strategy exits when either the stop loss is triggered or prices rise above the CCI upper band.
The goal is to achieve a high percentage of profitable trades (well over 50%) rather than capturing the full duration of a trend. It is therefore suitable for those who "hate to see potential losses".
Strategy Logic
-
Construct CCI indicator and bands using ta.sma() and ta.dev() functions.
-
Use input to select start date for backtest.
-
Entry signal: CCI crosses below lower band and starts increasing. Additional filter requires close > open by 0.25%.
-
Exit 1: CCI rises above upper band, take profit.
-
Exit 2: Price drops below stop loss level, cut losses.
-
Strategy only goes long based on CCI strength, with stops to control risk.
Advantage Analysis
The strategy has the following advantages:
-
Identify overbought/oversold with CCI to capitalize on reversals.
-
Only long direction avoids excessive risk from bad trades.
-
Price strength filter ensures support formed before entry.
-
Stop loss mechanism limits per trade loss and manages capital.
-
Flexible backtest parameters to adjust entry filters.
-
High win rate suits investors focused on risk management.
-
Clear logic and simple implementation.
Risk Analysis
There are also some risks:
-
Going only long may miss short-term downtrends.
-
Poor CCI parameter tuning leads to failure.
-
Stop loss too loose fails to limit losses.
-
Strong uptrend blows through stops causing large losses.
-
High trade frequency increases transaction costs.
Possible solutions:
-
Optimize CCI parameters to find best values.
-
Adjust stop loss to balance risk and slippage.
-
Manage entry frequency considering costs.
-
Combine with trend and range filters.
Enhancement Opportunities
Some ways to improve the strategy:
-
Implement dynamic stops based on market volatility.
-
Add filters like MACD to avoid stops being too wide.
-
Incorporate short side when CCI overheats.
-
Consider costs, set minimum profit target.
-
Optimize parameters for time frame.
-
Machine learning for automated parameter tuning.
-
Add position sizing for dynamic allocation.
Conclusion
In summary, this long-only strategy capitalizes on CCI overbought/oversold levels with price strength filter and stop losses. It offers easy implementation, good risk control and high win percentage. The limitations of being long-only and fixed stops can be addressed through parameter optimization, short entries, dynamic stops etc. The strategy suits investors seeking high win rates and proper risk management.
[/trans]
Strategy Arguments
| Argument | Default | Description |
|---|---|---|
| v_input_1_close | 0 | src: close |
| v_input_int_1 | 20 | Period |
| v_input_float_1 | 8 | Stop Loss percentage |
| v_input_float_2 | 0.25 | Close of the signal bar higher than Open % |
| v_input_int_2 | 150 | Upper Band |
| v_input_int_3 | -150 | Low Band |
| v_input_int_4 | true | From Month |
| v_input_int_5 | true | From Day |
| v_input_int_6 | 2016 | From Year |
| v_input_int_7 | true | Thru Month |
| v_input_int_8 | true | Thru Day |
| v_input_int_9 | 2112 | Thru Year |
Source (PineScript)
/*backtest
start: 2022-11-08 00:00:00
end: 2023-11-14 00:00:00
period: 1d
basePeriod: 1h
exchanges: [{"eid":"Futures_Binance","currency":"BTC_USDT"}]
*/

//@version=5
strategy(title='CCI High Performance long only', overlay=false )
src = input(close)
length = input.int(20, title='Period', minval=1)
lossp = input.float(8, title='Stop Loss percentage', minval=0.5, step=0.5)
scart = input.float(0.25, title='Close of the signal bar higher than Open %', minval = 0)
upperline = input.int(150, title='Upper Band', minval=0, step=10)
lowline = input.int(-150, title='Low Band', maxval=0, step=10)


// construction of CCI (not on close but in totalprice) and of bands
ma = ta.sma(src, length)
cci = (src - ma) / (0.015 * ta.dev(src, length))
plot(cci, 'CCI', color=color.new(#996A15, 0))
band1 = hline(upperline, 'Upper Band', color=#C0C0C0, linestyle=hline.style_dashed)
band0 = hline(lowline, 'Lower Band', color=#C0C0C0, linestyle=hline.style_dashed)
fill(band1, band0, color=color.new(#9C6E1B, 90), title='Background')
// === INPUT BACKTEST RANGE ===
fromMonth = input.int(defval = 1,    title = "From Month",  minval = 1, maxval = 12)
fromDay   = input.int(defval = 1,    title = "From Day",    minval = 1, maxval = 31)
fromYear  = input.int(defval = 2016, title = "From Year",   minval = 1970)
thruMonth = input.int(defval = 1,    title = "Thru Month",  minval = 1, maxval = 12)
thruDay   = input.int(defval = 1,    title = "Thru Day",    minval = 1, maxval = 31)
thruYear  = input.int(defval = 2112, title = "Thru Year",   minval = 1970)
// === FUNCTION EXAMPLE limit for backtest ===
start     = timestamp(fromYear, fromMonth, fromDay, 00, 00)            // backtest start  window
finish    = timestamp(thruYear, thruMonth, thruDay, 23, 59)            // backtest finish window
window()  => time >= start and time <= finish ? true : false           // create function "within window of time"
//ENTRY CONDITIONS

// strategy: enter when CCI is under the low line and starts increasing. The filter is that the signal candle should mark a close higher than a x-percent
// (0.25%) of the open
// Exit when either when it reaches the target of a prices highest than high level of CCI or fixed stop loss (in percentage)
scart_level = open * (1+scart/100)
entryl = cci[1] < lowline[1] and cci > cci[1] and close > scart_level and window()
exit1 = cci> upperline
strategy.entry('Long', strategy.long, when=entryl)
strategy.close('Long', when=exit1, comment='target')

// money management (only stop loss)
losspel = strategy.position_avg_price * (1 - lossp / 100)
fixed_stop_long = close < losspel
strategy.close('Long', when=fixed_stop_long, comment='Stop Loss')
Detail
https://www.fmz.com/strategy/432225
Last Modified
2023-11-15 16:52:06