
8.4 KiB
Name
黄金交叉均线交易策略Golden-Cross-Moving-Average-Trading-Strategy
Author
ChaoZhang
Strategy Description
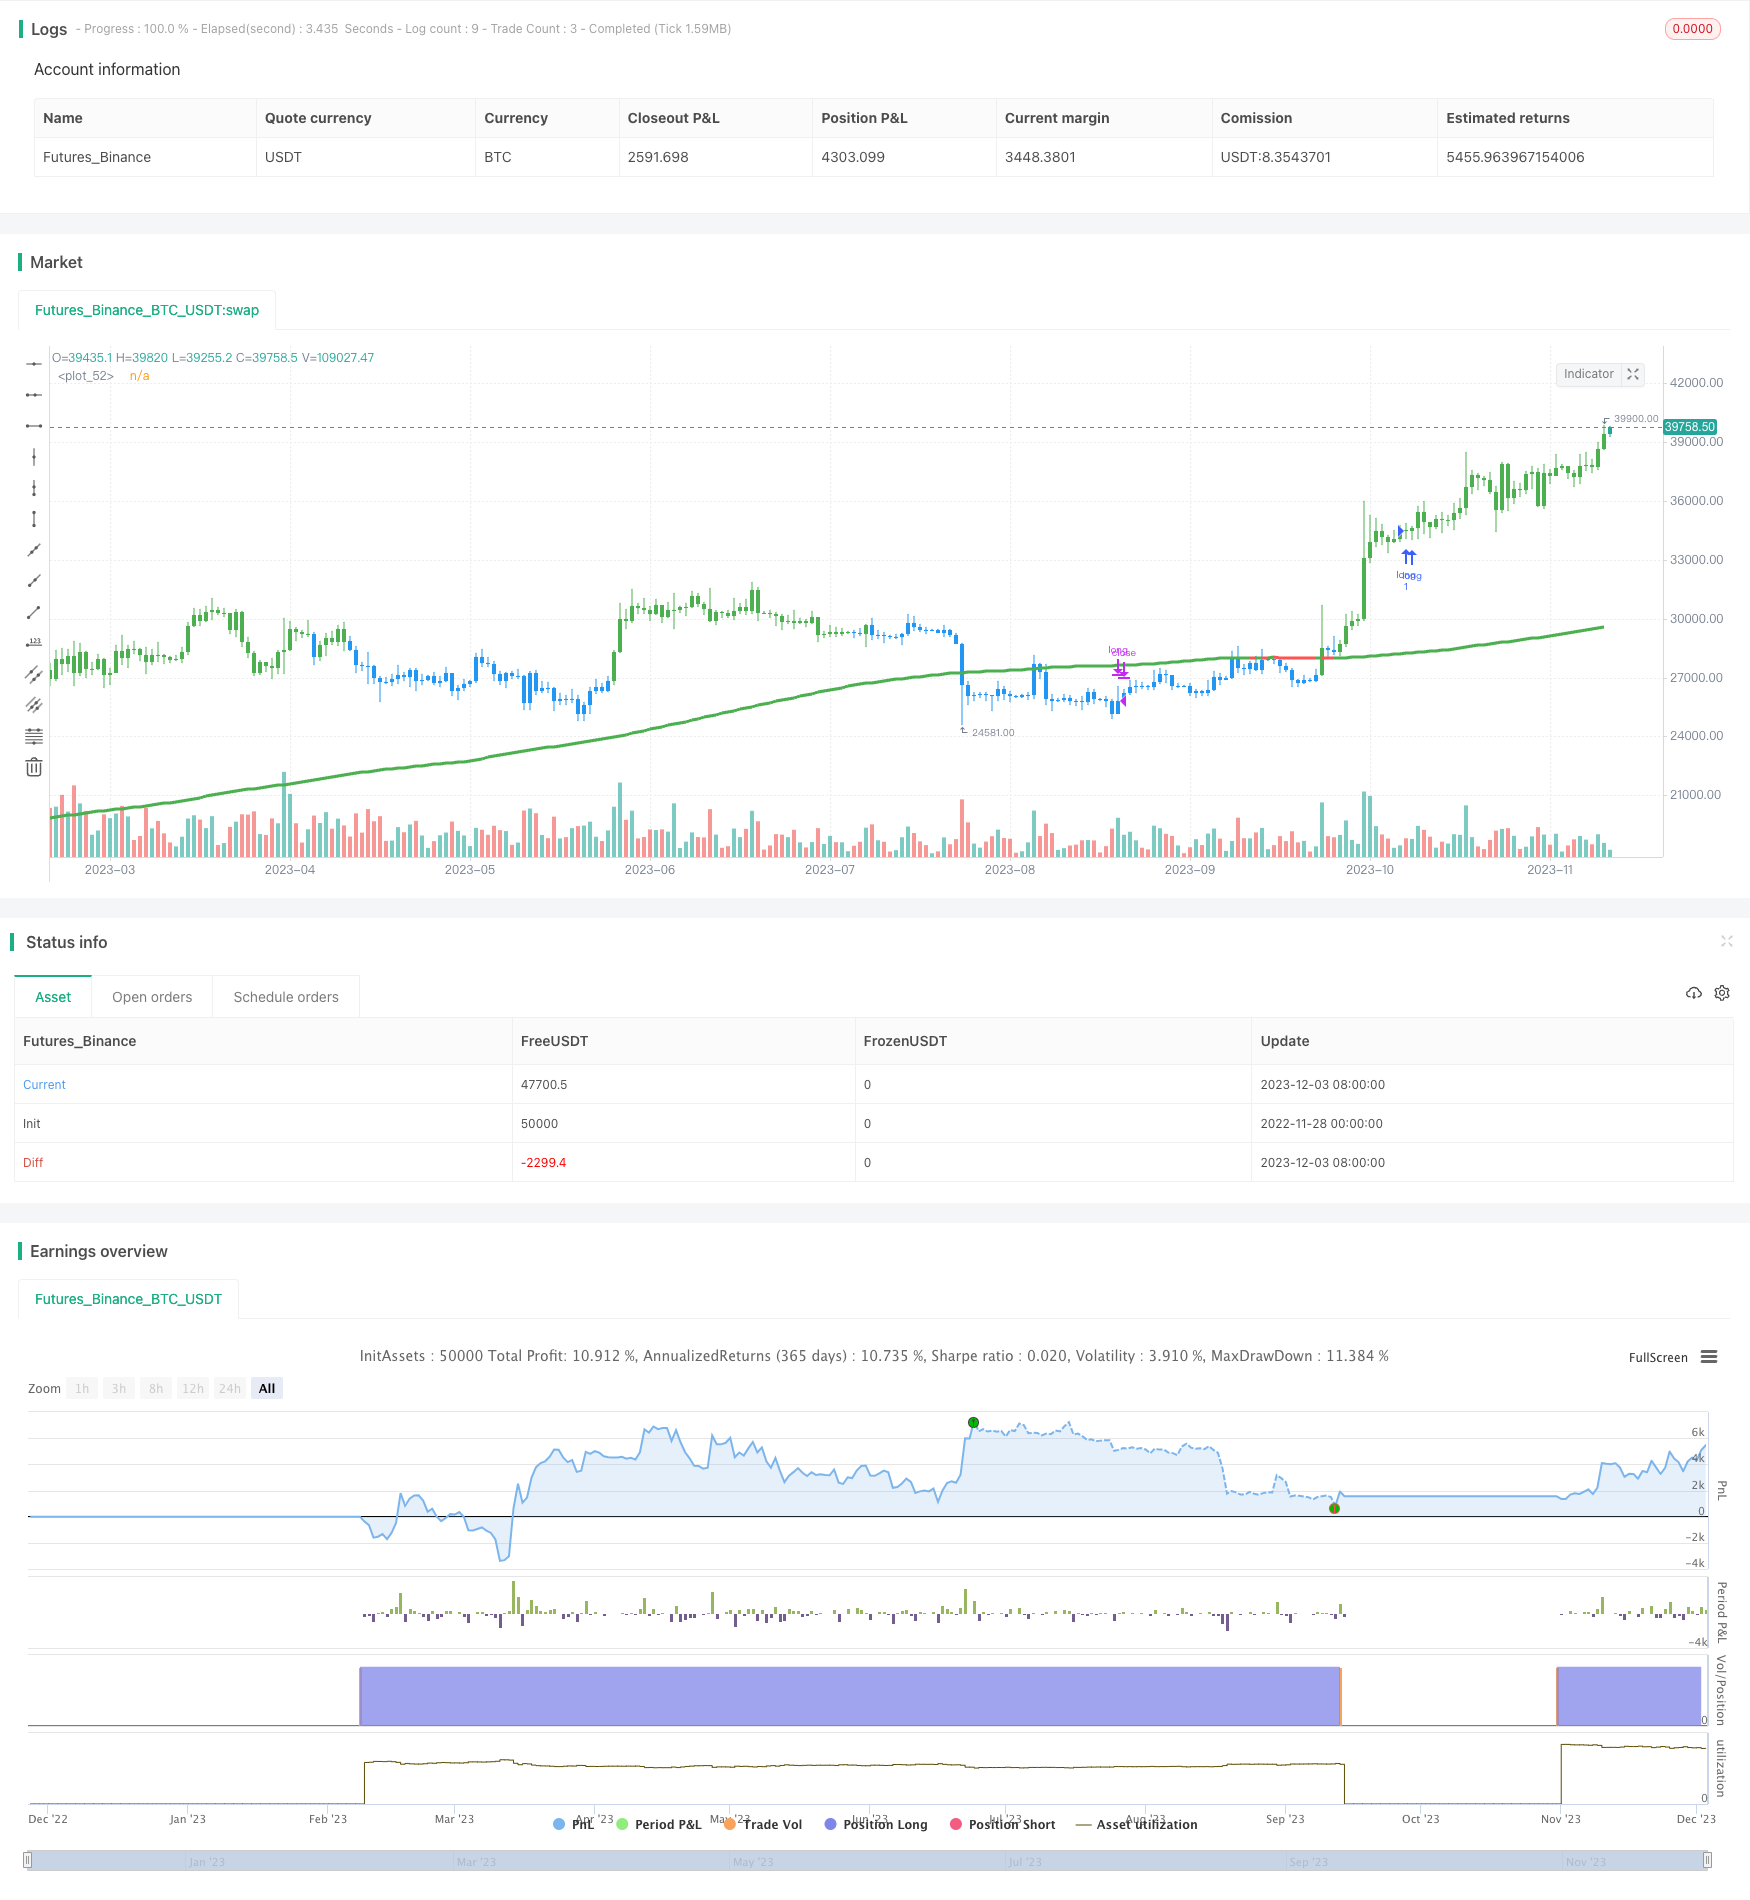
[trans]
概述
黄金交叉均线交易策略是一个非常简单的移动平均线交易策略。它的交易信号来自两条不同周期的简单移动平均线(SMA)的黄金交叉。具体来说,当较快周期的SMA线从下方突破较慢周期的SMA线时生成买入信号;当较快周期的SMA线从上方跌破较慢周期的SMA线时生成卖出信号。
策略原理
该策略使用两条移动平均线:一条是50周期的SMA快线,另一条是200周期的SMA慢线。
当SMA快线从下方向上突破SMA慢线时,产生买入信号,代表牛市来临。这种突破被称为“黄金交叉”。当SMA快线从上方向下突破SMA慢线时,产生卖出信号,代表熊市来临。这种突破被称为“死亡交叉”。
该策略只做多,不做空。也就是说,它只在黄金交叉时买入,在死亡交叉时卖出平仓。除此之外,策略中没有设置止损或止盈逻辑。
策略优势分析
该策略最大的优势在于非常简单和直观。移动平均线被广泛认为是显示市场趋势变化的有效技术指标。该策略正是利用了移动平均线的这一关键性质来判断市场的长线趋势。
另一个优势是参数设置比较固定。50周期和200周期的选取有一定的道理,不需要频繁调整,适合长期持有。
从历史数据来看,这种简单的移动平均线策略实现了不错的效果。
风险分析
该策略最大的风险也来自于其过于简单。由于没有设定止损逻辑,可能面临较大的单笔损失。这对于风险管理不利。
另外,移动平均线本身也存在一定滞后性。信号的产生需要一定的确认,可能错过短线操作机会。
优化方向
可以考虑在策略中加入其他技术指标,构建更加复杂的交易系统,以提高盈利率和胜率。例如可以加入相对强弱指标(RSI)等震荡指标来捕捉短线信号。
另一方面,也可以优化资金管理策略。设定合理的止损和止盈可以有效控制风险,这是移动这类趋势跟踪策略的常见做法。
总结
黄金交叉均线交易策略是一个高度简化的趋势跟踪策略。它利用移动平均线的黄金交叉和死亡交叉来判断市场长线趋势的变化,以此产生交易信号。该策略的优势在于非常简单直观,容易理解和跟踪,历史表现也不错。但同时也面临一定的风险,特别是在止损和止盈控制上比较缺失。未来可以通过加入其他指标或者优化资金管理来使策略更加稳健可靠。
||
Overview
The golden cross moving average trading strategy is a very simple moving average trading strategy. Its trading signals come from the golden cross of two simple moving averages (SMA) with different cycles. Specifically, a buy signal is generated when the faster cycle SMA crosses above the slower cycle SMA from below. A sell signal is generated when the faster cycle SMA crosses below the slower cycle SMA from above.
Strategy Principle
The strategy uses two moving averages: a 50-period SMA fast line and a 200-period SMA slow line.
When the SMA fast line breaks through the SMA slow line from below, a buy signal is generated, indicating a bull market is coming. This kind of breakthrough is called a "golden cross". When the SMA fast line breaks through the SMA slow line from above, a sell signal is generated, indicating a bear market is coming. This kind of breakthrough is called a "death cross".
The strategy only goes long without shorting. That is to say, it only buys at the golden cross and sells out at the death cross. Besides that, there is no stop loss or take profit logic set in the strategy.
Advantage Analysis
The biggest advantage of this strategy is that it is very simple and intuitive. Moving averages are widely considered an effective technical indicator for displaying changes in market trends. This strategy takes advantage of this key feature of moving averages to determine the long-term trend of the market.
Another advantage is that the parameter settings are relatively fixed. The choice of 50-period and 200-period has some rationale and does not need frequent adjustment, suitable for long-term holding.
Judging from historical data, this simple moving average strategy has achieved decent results.
Risk Analysis
The biggest risk of this strategy also comes from its over-simplification. As there is no stop loss logic set, it may face relatively large single losses. This is not beneficial for risk management.
In addition, moving averages themselves have some lagging. Signal generation requires some confirmation and may miss short-term trading opportunities.
Optimization
Other technical indicators can be considered to be incorporated into the strategy to build a more complex trading system and improve profitability and win rate. For example, oscillators like the relative strength index (RSI) can be added to capture short-term signals.
On the other hand, the money management strategy can also be optimized. Setting reasonable stop loss and take profit can effectively control risks, which is a common practice for this type of trend tracking strategy.
Summary
The golden cross moving average trading strategy is a highly simplified trend tracking strategy. It uses the golden cross and death cross of moving averages to determine changes in the long-term trend of the market, based on which trading signals are generated. The advantage of this strategy lies in its being very simple and intuitive, easy to understand and follow, and its decent historical performance. But at the same time, it also faces certain risks, especially the lack of control in terms of stop loss and take profit. In the future, the strategy can be made more robust and reliable by adding other indicators or optimizing capital management.
[/trans]
Strategy Arguments
| Argument | Default | Description |
|---|---|---|
| v_input_1 | true | Enable Bar Color? |
| v_input_2 | false | Show Fast Moving Average |
| v_input_3 | true | Show Slow Moving Average |
| v_input_4 | 50 | v_input_4 |
| v_input_5 | 200 | v_input_5 |
Source (PineScript)
/*backtest
start: 2022-11-28 00:00:00
end: 2023-12-04 00:00:00
period: 1d
basePeriod: 1h
exchanges: [{"eid":"Futures_Binance","currency":"BTC_USDT"}]
*/

//@version=2
strategy("Golden Cross, SMA 200 Long Only, Moving Average Strategy (by ChartArt)", shorttitle="CA_-_Golden_Cross_Strat", overlay=true)

// ChartArt's Golden Cross Strategy
//
// Version 1.0
// Idea by ChartArt on June 19, 2016.
//
// This moving average strategy is very easy to follow:
//
// The strategy goes long when the faster SMA 50 (the
// simple moving average of the last 50 bars) crosses
// above the SMA 200. Orders are closed when the SMA 50
// crosses below SMA 200. The strategy does not short.
//
// This simple strategy does not have any other
// stop loss or take profit money management logic.
//
// List of my work:
// https://www.tradingview.com/u/ChartArt/
//
//  __             __  ___       __  ___
// /  ` |__|  /\  |__)  |   /\  |__)  |
// \__, |  | /~~\ |  \  |  /~~\ |  \  |
//
//


// Input
switch1=input(true, title="Enable Bar Color?")
switch2=input(false, title="Show Fast Moving Average")
switch3=input(true, title="Show Slow Moving Average")
movingaverage_fast = sma(close, input(50))
movingaverage_slow = sma(close, input(200))

// Calculation
bullish_cross = crossover(movingaverage_fast, movingaverage_slow)
bearish_cross = crossunder(movingaverage_fast, movingaverage_slow)

// Strategy
if bullish_cross
    strategy.entry("long", strategy.long)

strategy.close("long", when = bearish_cross )

// Colors
bartrendcolor = close > movingaverage_fast and close > movingaverage_slow and change(movingaverage_slow) > 0 ? green : close < movingaverage_fast and close < movingaverage_slow and change(movingaverage_slow) < 0 ? red : blue
barcolor(switch1?bartrendcolor:na)

// Output
plot(switch2?movingaverage_fast:na,color = change(movingaverage_fast) > 0 ? green : red,linewidth=3)
plot(switch3?movingaverage_slow:na,color = change(movingaverage_slow) > 0 ? green : red,linewidth=3)

//
alertcondition(bullish_cross, title='Golden Cross (bullish)', message='Bullish')
alertcondition(bearish_cross, title='Death Cross (bearish)', message='Bearish')
Detail
https://www.fmz.com/strategy/434289
Last Modified
2023-12-05 10:35:02