
15 KiB
Name
高级别均线突破策略Trend-Following-Strategy-Based-on-Moving-Average-Breakout
Author
ChaoZhang
Strategy Description
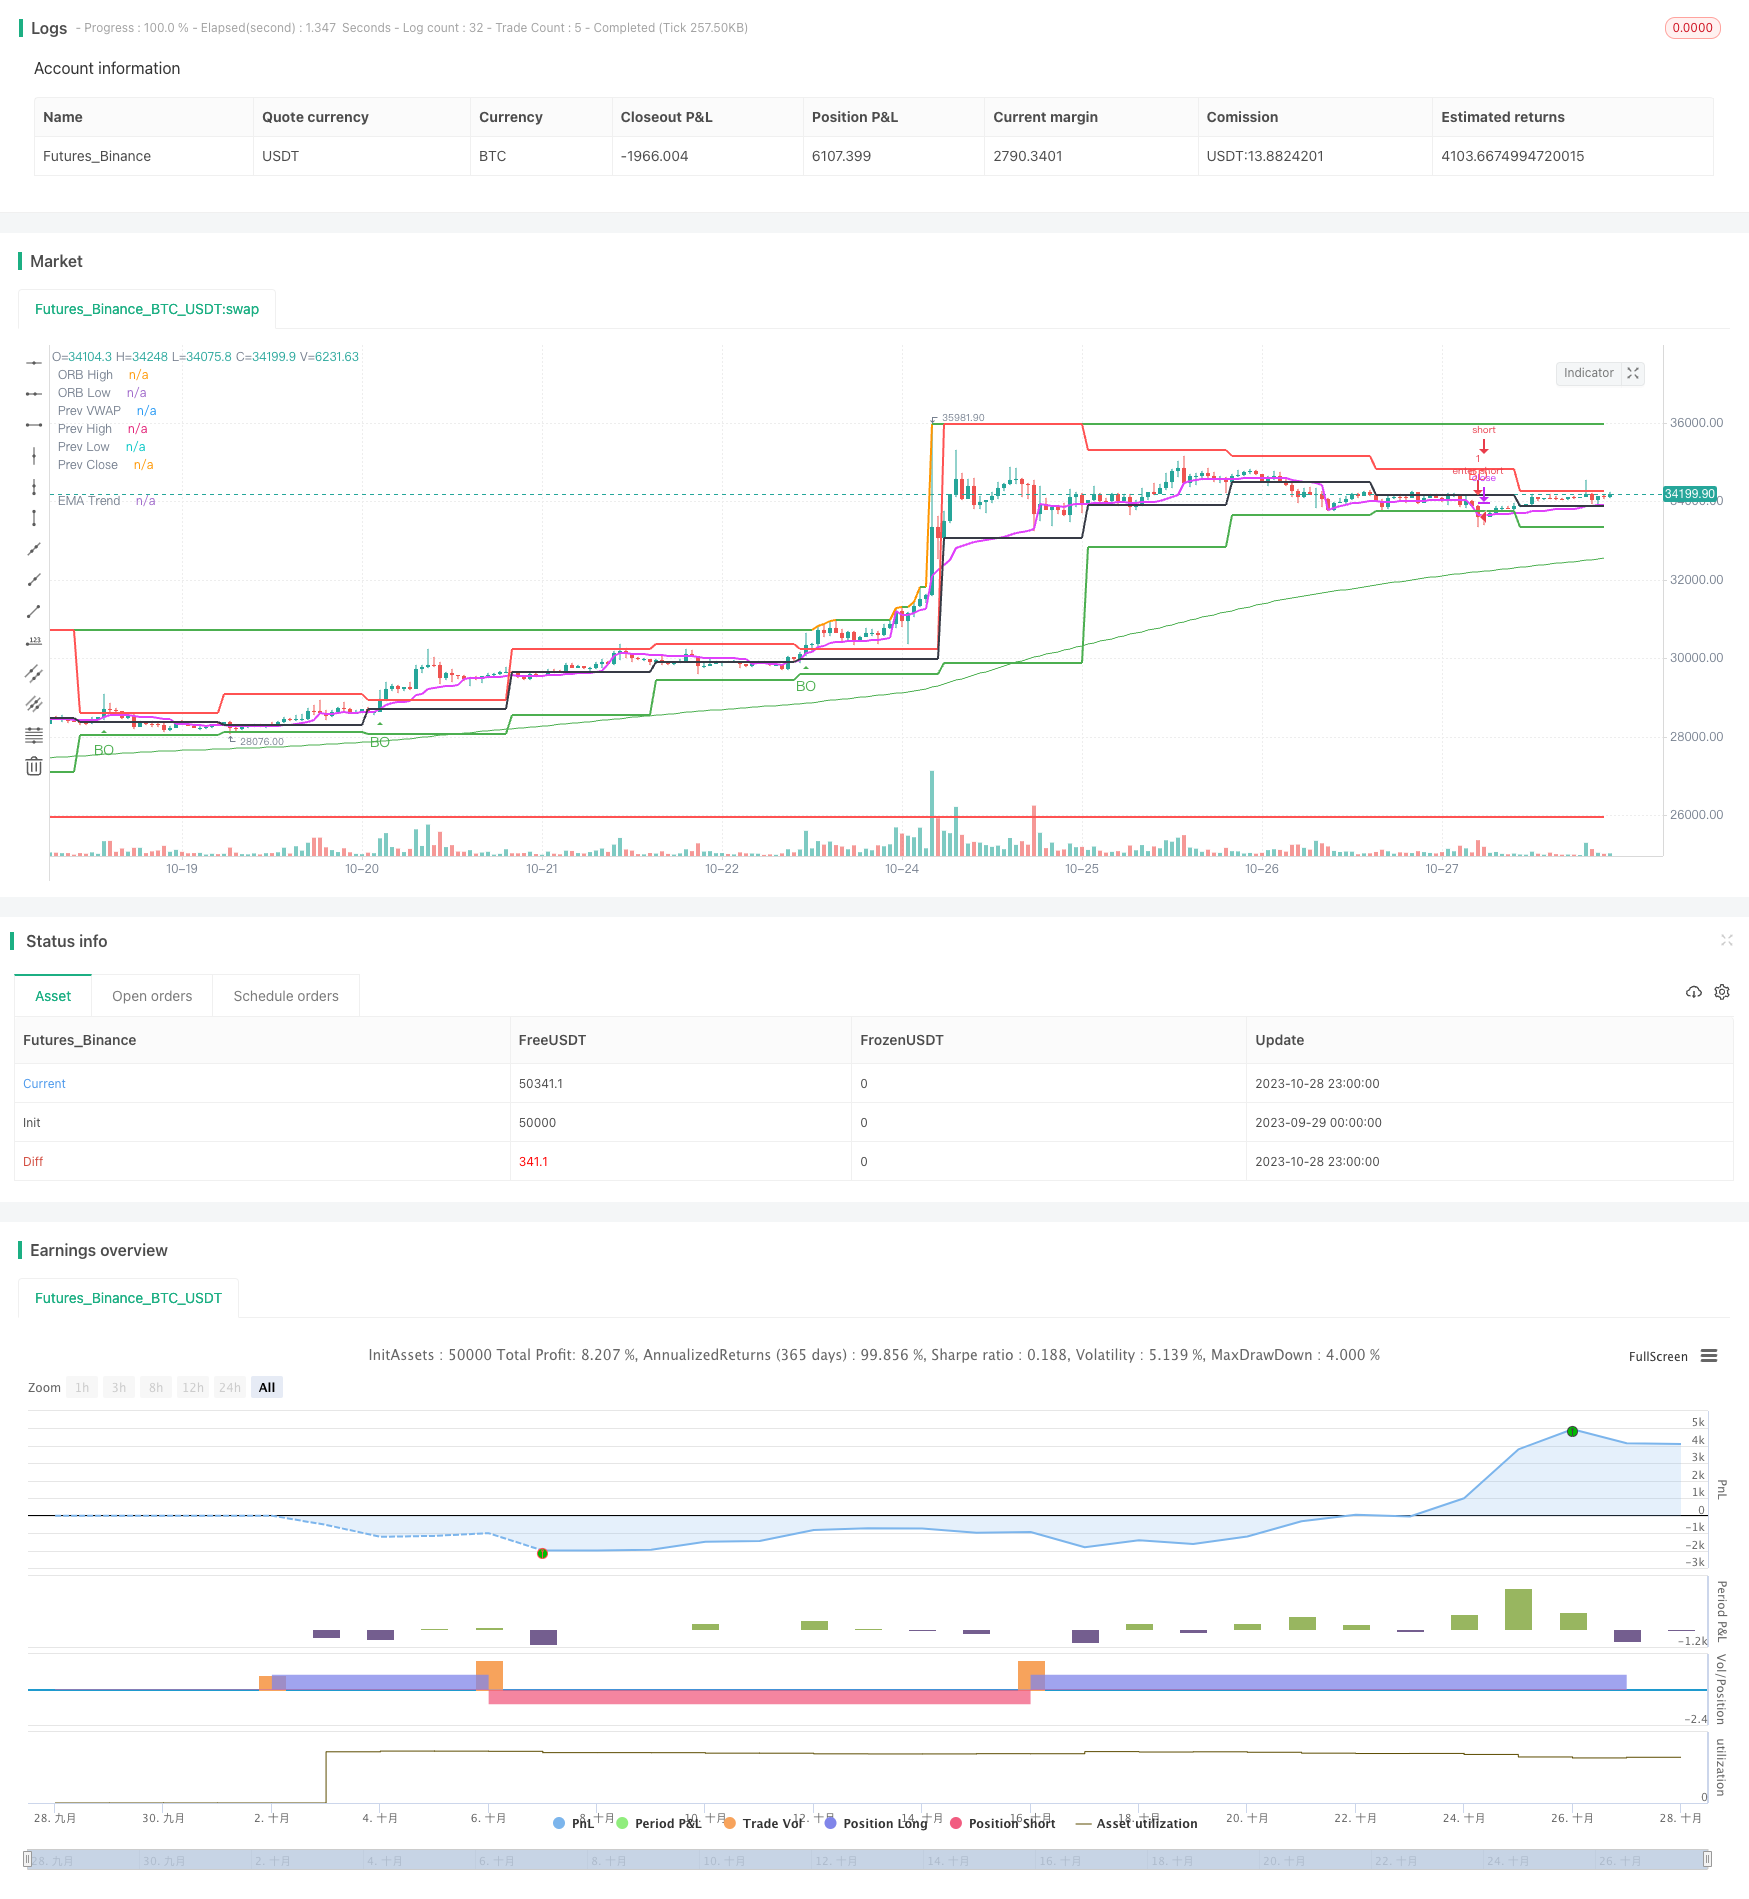
[trans]
概述
该策略的主要思想是利用高级别均线的突破来实现趋势交易。在高级别时间范围内,当价格突破上升或下破均线时,可以判断出趋势的开始,这时可以选择适当的方向进行跟踪。
策略原理
该策略通过Pine Script语言开发,主要分为以下几个部分:
-
输入参数
定义了均线周期参数period,默认值为200;定义了K线时间周期参数timeframe,默认值为日线"D"。
-
均线计算
使用ta.ema函数计算Exponential Moving Average均线。
-
突破判断
使用ta.crossover和ta.crossunder函数来判断价格是否突破或下破均线。
-
信号绘制
当发生突破时,在K线上绘制向上或向下的箭头。
-
交易开平仓
发生突破时选择方向开仓,双倍止损距离达到之后平仓。
该策略主要依靠高级别均线的趋势判断能力,通过简单的突破操作来实现趋势跟踪,属于较为传统的突破策略。
优势分析
该策略具有以下几点优势:
-
概念简单,容易理解和掌握。
-
仅依靠一个均线指标,参数调节简单。
-
突破操作容易形成趋势,不会频繁交易。
-
高级别周期清晰显示大趋势,不容易被短期波动影响。
-
可配置不同的时间周期组合,适应不同品种。
-
可轻松实现多品种跟踪,难以同时被套牢。
风险分析
该策略也存在一些风险:
-
突破信号可能发生假突破,无法有效过滤市场震荡。
-
无法有效利用短线机会获利。
-
大方向判断错误时,亏损可能比较严重。
-
均线周期和交易周期不匹配时,会出现过度交易或漏损情况。
-
无法实时止损,亏损扩大的可能性较大。
对应风险的解决方案包括:结合趋势指标、增加过滤条件、适当缩短持仓周期、动态调整止损位置等。
优化方向
该策略可以考虑从以下几个方面进行优化:
-
增加趋势指标的组合,如MACD、KD等,提高突破的可靠性。
-
增加交易量或布林线通道等过滤条件,避免假突破。
-
优化参数周期的匹配,使得持仓周期与趋势周期更加匹配。
-
增加实时止损策略,通过跟踪止损来控制单笔亏损。
-
考虑结合机器学习技术,实现参数的动态优化。
-
尝试多种资产配置组合,提高整体的稳定性。
总结
该策略总体来说较为简单实用,通过简单的均线突破来实现趋势跟踪,易于掌握,可以作为量化交易的入门策略之一。但也存在一些问题,需要通过组合指标、优化参数、动态止损等方式进行改进,使得策略更稳定高效。具有很大的优化空间和扩展性。
||
Overview
The core idea of this strategy is to follow the trend by detecting breakouts of moving averages across higher timeframes. When the price breaks out above or breaks down below the moving average on a higher timeframe, it signals the potential start of a new trend, allowing traders to take positions accordingly.
Strategy Logic
The strategy is developed in Pine Script and consists of the following main components:
-
Inputs
Defines input parameters period as the moving average period, default to 200; and timeframe as the bar timeframe, default to D (daily bars).
-
Moving Average
Calculates exponential moving average (EMA) using ta.ema function.
-
Breakout Detection
Identifies breakouts and breakdowns using ta.crossover and ta.crossunder functions.
-
Signal Plotting
Plots up and down arrows on bars when breakouts occur.
-
Trade Entries and Exits
Enters trade on breakout signals and exits when price reaches 2x stop loss distance.
The strategy mainly leverages the trend-following capacity of moving averages across higher timeframes. It implements simple breakout logic for trend trading, making it a conventional breakout strategy.
Advantage Analysis
The main advantages of this strategy include:
-
Simple logic, easy to understand and master.
-
Depends on only one indicator, with minimal parameter tuning.
-
Breakout signals tend to align with trend, avoiding excessive trading.
-
Higher timeframes clearly depict major trends without noise.
-
Flexible timeframe combinations cater to different products.
-
Easily scalable across products, avoiding simultaneous drawdowns.
Risk Analysis
The potential risks are:
-
Breakout signals may turn out to be false signals, unable to filter market noise effectively.
-
Unable to capitalize on short-term opportunities.
-
Massive losses if major trend direction is wrong.
-
Timeframe mismatch between moving average and trading timeframe may lead to over-trading or missed profit.
-
Lack of real-time stop loss may result in magnified losses.
Possible solutions include combining with trend-following indicators, adding filters, shortening holding period, implementing dynamic stop loss etc.
Enhancement Opportunities
The strategy can be improved in the following aspects:
-
Add trend-following indicators like MACD, KD to increase breakout reliability.
-
Add filters based on volume or Bollinger Bands to avoid false breakouts.
-
Optimize parameter tuning to match holding period with trend cycle.
-
Incorporate real-time stop loss to control single trade loss.
-
Explore machine learning techniques for dynamic parameter optimization.
-
Test various asset allocation combinations to enhance overall stability.
Conclusion
In summary, this is a simple and practical strategy for trend-following via moving average breakouts. It is easy to understand and implement, serving as a good introductory strategy for algo trading. But it also has some flaws that need to be addressed through combinations of indicators, parameter tuning, dynamic stop loss etc. Much room remains for enhancements and extensions.
[/trans]
Strategy Arguments
| Argument | Default | Description |
|---|---|---|
| v_input_int_1 | 15 | TimeRange |
| v_input_bool_5 | false | Hide the PDHCL (prev day High Close Low range) |
| v_input_bool_6 | false | Hide the Summary Table |
| v_input_1 | 0915-0930 | (?ORB settings)Time Range |
| v_input_bool_1 | false | (?ORB setting)Hide ORB Range |
| v_input_int_2 | 14 | (?StopLoss settings)ATR Period for placing SL |
| v_input_bool_2 | false | Show SL lines in chart |
| v_input_bool_3 | false | (?Strengh Settings)Ignore Momentum & Volume |
| v_input_int_3 | 14 | Momentum Period |
| v_input_int_4 | 50 | Bullish Momentum |
| v_input_int_5 | 50 | Bearish Momentum |
| v_input_int_6 | 20 | Volume Average Period |
| v_input_float_1 | true | Volume Strengh |
| v_input_int_7 | 200 | (?Trend Settings)Trend Period |
| v_input_bool_4 | false | Hide the trend line |
| v_input_float_2 | 2 | (?Trade settings)Risk:Reward |
| v_input_int_8 | 1500 | Close all trades, default is 3:00 PM, 1500 hours (integer) |
| v_input_bool_7 | true | Markets that never closed (Crypto, Forex, Commodity) |
| v_input_int_9 | true | Lot Size |
Source (PineScript)
/*backtest
start: 2023-09-29 00:00:00
end: 2023-10-29 00:00:00
period: 1h
basePeriod: 15m
exchanges: [{"eid":"Futures_Binance","currency":"BTC_USDT"}]
*/

// @version=5
// Open-Range-Breakout strategy
// No license. Free and Open Source.

strategy('Strategy: ORB', shorttitle="ORB", overlay=true , currency=currency.NONE, initial_capital=100000)

// Inputs
period = input.int(defval=15, title="TimeRange", tooltip="The range in minutes (default: 15m)")
sessionInput = input(defval="0915-0930", title="Time Range", group="ORB settings", tooltip='What is the timeperiod (default 9:15AM to 9:30AM, exchange timezone')
hide = input.bool(defval = false, title="Hide ORB Range", group="ORB setting", tooltip = 'Hide the ORB range drawing')

// SL Related
slAtrLen = input.int(defval=14, title="ATR Period for placing SL", group="StopLoss settings")
showSLLines = input.bool(defval=false, title="Show SL lines in chart", tooltip="Show SL lines also as dotted lines in chart. Note: chart may look untidy.", group="StopLoss settings")

// Further Filtering
ignoreMementumVolume = input.bool(defval=false, title="Ignore Momentum & Volume", tooltip="Ignore Momentum & Volume to find out trades", group="Strengh Settings")
rsiLen = input.int(defval=14, title="Momentum Period", group="Strengh Settings", tooltip = 'To determine the momentum, RSI period is set default to 100')
rsiBullish = input.int(defval=50, step=1, title="Bullish Momentum", group="Strengh Settings", tooltip = 'Bullish Momentum, default set to RSI as 50')
rsiBearish = input.int(defval=50, step=1, title="Bearish Momentum", group="Strengh Settings", tooltip = 'Bearish Momentum, default set to RSI as 50')
volAvg = input.int(defval=20, step=1, title="Volume Average Period", group="Strengh Settings", tooltip = 'To calculate average volume, how many historical bars are considered. Default: 20.')
volThreshold = input.float(defval=1, step=0.1, title="Volume Strengh", group="Strengh Settings", tooltip = 'Multiplier: How big the current bar volume compared to average of last 20')

trendPeriod = input.int(defval=200, step=1, title="Trend Period", group="Trend Settings", tooltip = 'To calculate trend, what period is considered. Default: 200.')
hideTrend = input.bool(defval = false, title="Hide the trend line", group="Trend Settings", tooltip = 'Hide the trend')

hidePDHCL = input.bool(defval = false, title="Hide the PDHCL (prev day High Close Low range)", tooltip = 'Hide the Previous Day High, Close, Low lines')

hideTable = input.bool(defval = false, title="Hide the Summary Table", tooltip = 'Hide the summary table.')

// Trade related
rrRatio = input.float(title='Risk:Reward', step=0.1, defval=2.0, group="Trade settings")
endOfDay = input.int(defval=1500, title="Close all trades, default is 3:00 PM, 1500 hours (integer)", group="Trade settings")
mktAlwaysOn = input.bool(defval=true, title="Markets that never closed (Crypto, Forex, Commodity)", tooltip="Some markers never closes. For those cases, make this checked.", group="Trade settings")
lotSize = input.int(title='Lot Size', step=1, defval=1, group="Trade settings")

// Util method

is_newbar(res) =>
	timeframe.change(time(res)) != 0

// print table
printTable(txt) =>
    var table t = table.new(position.bottom_right, 1, 1)
    table.cell(t, 0, 0, txt, text_halign = text.align_left, bgcolor = color.lime)

// globals
t = time(timeframe.period, sessionInput + ":1234567") // everyday
in_session = not na(t)
is_first = in_session and not in_session[1]
is_end_session = in_session[1] and not in_session
green(open, close) => close > open ? true : false
red(open, close) => close < open ? true : false

var float orb_high = na
var float orb_low = na
if is_first
    orb_high := high
    orb_low := low
else
    orb_high := orb_high[1]
    orb_low := orb_low[1]
if high > orb_high and in_session
    orb_high := high
if low < orb_low and in_session
    orb_low := low

plot(hide ? na : orb_high, style=plot.style_line, color=orb_high[1] != orb_high ? na : color.green, title="ORB High", linewidth=2)
plot(hide ? na : orb_low, style=plot.style_line, color=orb_low[1] != orb_low ? na : color.red, title="ORB Low", linewidth=2)


// PDHCL (Previous Day High Close Low)
[dh,dl,dc] = request.security(syminfo.ticker, "D", [high[1],low[1], close[1]], lookahead=barmerge.lookahead_on)
plot(hidePDHCL ? na : dh, title="Prev High",  color=color.red,  linewidth=2, trackprice=true, show_last = 1)
plot(hidePDHCL ? na : dl, title="Prev Low",  color=color.green,  linewidth=2, trackprice=true, show_last = 1)
plot(hidePDHCL ? na : dc, title="Prev Close",  color=color.black,  linewidth=2, trackprice=true, show_last = 1)
plot(hidePDHCL ? na : ta.vwap(close), title="Prev VWAP",  color=color.fuchsia,  linewidth=2, trackprice=true, show_last = 1)

var l1 = label.new(bar_index, hidePDHCL ? na : dh, 'PDH', style=label.style_label_right)

// Previous Day WWAP


// For SL calculation
atr = ta.atr(slAtrLen)
highestHigh = ta.highest(high, 7)
lowestLow = ta.lowest(low, 7)
longStop = showSLLines ? lowestLow - (atr * 1) : na
shortStop = showSLLines ? highestHigh + (atr * 1) : na
plot(longStop, title="Buy SL", color=color.green, style=plot.style_cross)
plot(shortStop, title="Sell SL", color=color.red, style=plot.style_cross)

// Momentum: rsi
rsi = ta.rsi(close, rsiLen)

// trend: EMA200
ema = ta.ema(close, trendPeriod)
plot(hideTrend ? na : ema, "EMA Trend", color=close > ema ? color.green : color.red, linewidth = 1)

// Volume-Weighed Moving Average calculation
vwmaAvg = ta.vwma(close, volAvg)
vwma_latest = volume
// plotshape((barstate.isconfirmed and (vwma_latest > (vwmaAvg * volThreshold))), title='VolumeData', text='', location=location.abovebar, style=shape.diamond, color=color.gray, textcolor=color.gray, size=size.tiny)

// Trade signals

longCond = barstate.isconfirmed and (ta.crossover(close, orb_high) or ta.crossover(close, dh)) and green(open, close) and (ignoreMementumVolume ? true : rsi > rsiBullish and (vwma_latest > (vwmaAvg * volThreshold)))
shortCond = barstate.isconfirmed and (ta.crossunder(close, orb_low) or ta.crossunder(close, dl)) and red(open, close) and (ignoreMementumVolume ? true : rsi < rsiBearish and (vwma_latest > (vwmaAvg * volThreshold)))

plotshape(longCond, title='Breakout', text='BO', location=location.belowbar, style=shape.triangleup, color=color.green, textcolor=color.green)
plotshape(shortCond, title='Breakout', text='BD', location=location.abovebar, style=shape.triangledown, color=color.red, textcolor=color.red)


// Trade execute
h = hour(time('1'), syminfo.timezone)
m = minute(time('1'), syminfo.timezone)
hourVal = h * 100 + m
totalTrades = strategy.opentrades + strategy.closedtrades
if (mktAlwaysOn or (hourVal < endOfDay))
    // Entry
    var float sl = na
    var float target = na
    if (longCond)
        strategy.entry("enter long", strategy.long, lotSize, limit=na, stop=na, comment="Enter Long")
        sl := longStop
        target := close + ((close - longStop) * rrRatio)
        alert('Buy:' + syminfo.ticker + ' ,SL:' + str.tostring(math.floor(sl)) + ', Target:' + str.tostring(target), alert.freq_once_per_bar)
    if (shortCond)
        strategy.entry("enter short", strategy.short, lotSize, limit=na, stop=na, comment="Enter Short")
        sl := shortStop
        target := close - ((shortStop - close) * rrRatio)
        alert('Sell:' + syminfo.ticker + ' ,SL:' + str.tostring(math.floor(sl)) + ', Target:' + str.tostring(target), alert.freq_once_per_bar)

    // Exit: target or SL
    if ((close >= target) or (close <= sl))
        strategy.close("enter long", comment=close < sl ? "Long SL hit" : "Long target hit")
    if ((close <= target) or (close >= sl))
        strategy.close("enter short", comment=close > sl ? "Short SL hit" : "Short target hit")
else if (not mktAlwaysOn)
    // Close all open position at the end if Day
    strategy.close_all(comment = "Close all entries at end of day.")


// Plotting table
if (not hideTable and is_end_session)
    message =  syminfo.ticker + " :\n\nORB Upper: " + str.tostring(math.round(orb_high)) + "\nORB Lower: " + str.tostring(math.round(orb_low)) + "\nPDH: " + str.tostring(math.round(dh)) + "\nPDC: " + str.tostring(math.round(dc)) + "\nPDL: " + str.tostring(math.round(dl)) + "\nVWAP: " + str.tostring(math.round(ta.vwap(close)))
    printTable(message)
    alert(message, alert.freq_once_per_bar_close)
Detail
https://www.fmz.com/strategy/430561
Last Modified
2023-10-30 12:22:28