
11 KiB
Name
高收益日线交易策略Cloud-Soaring-High-Yield-Daily-Trading-Strategy
Author
ChaoZhang
Strategy Description
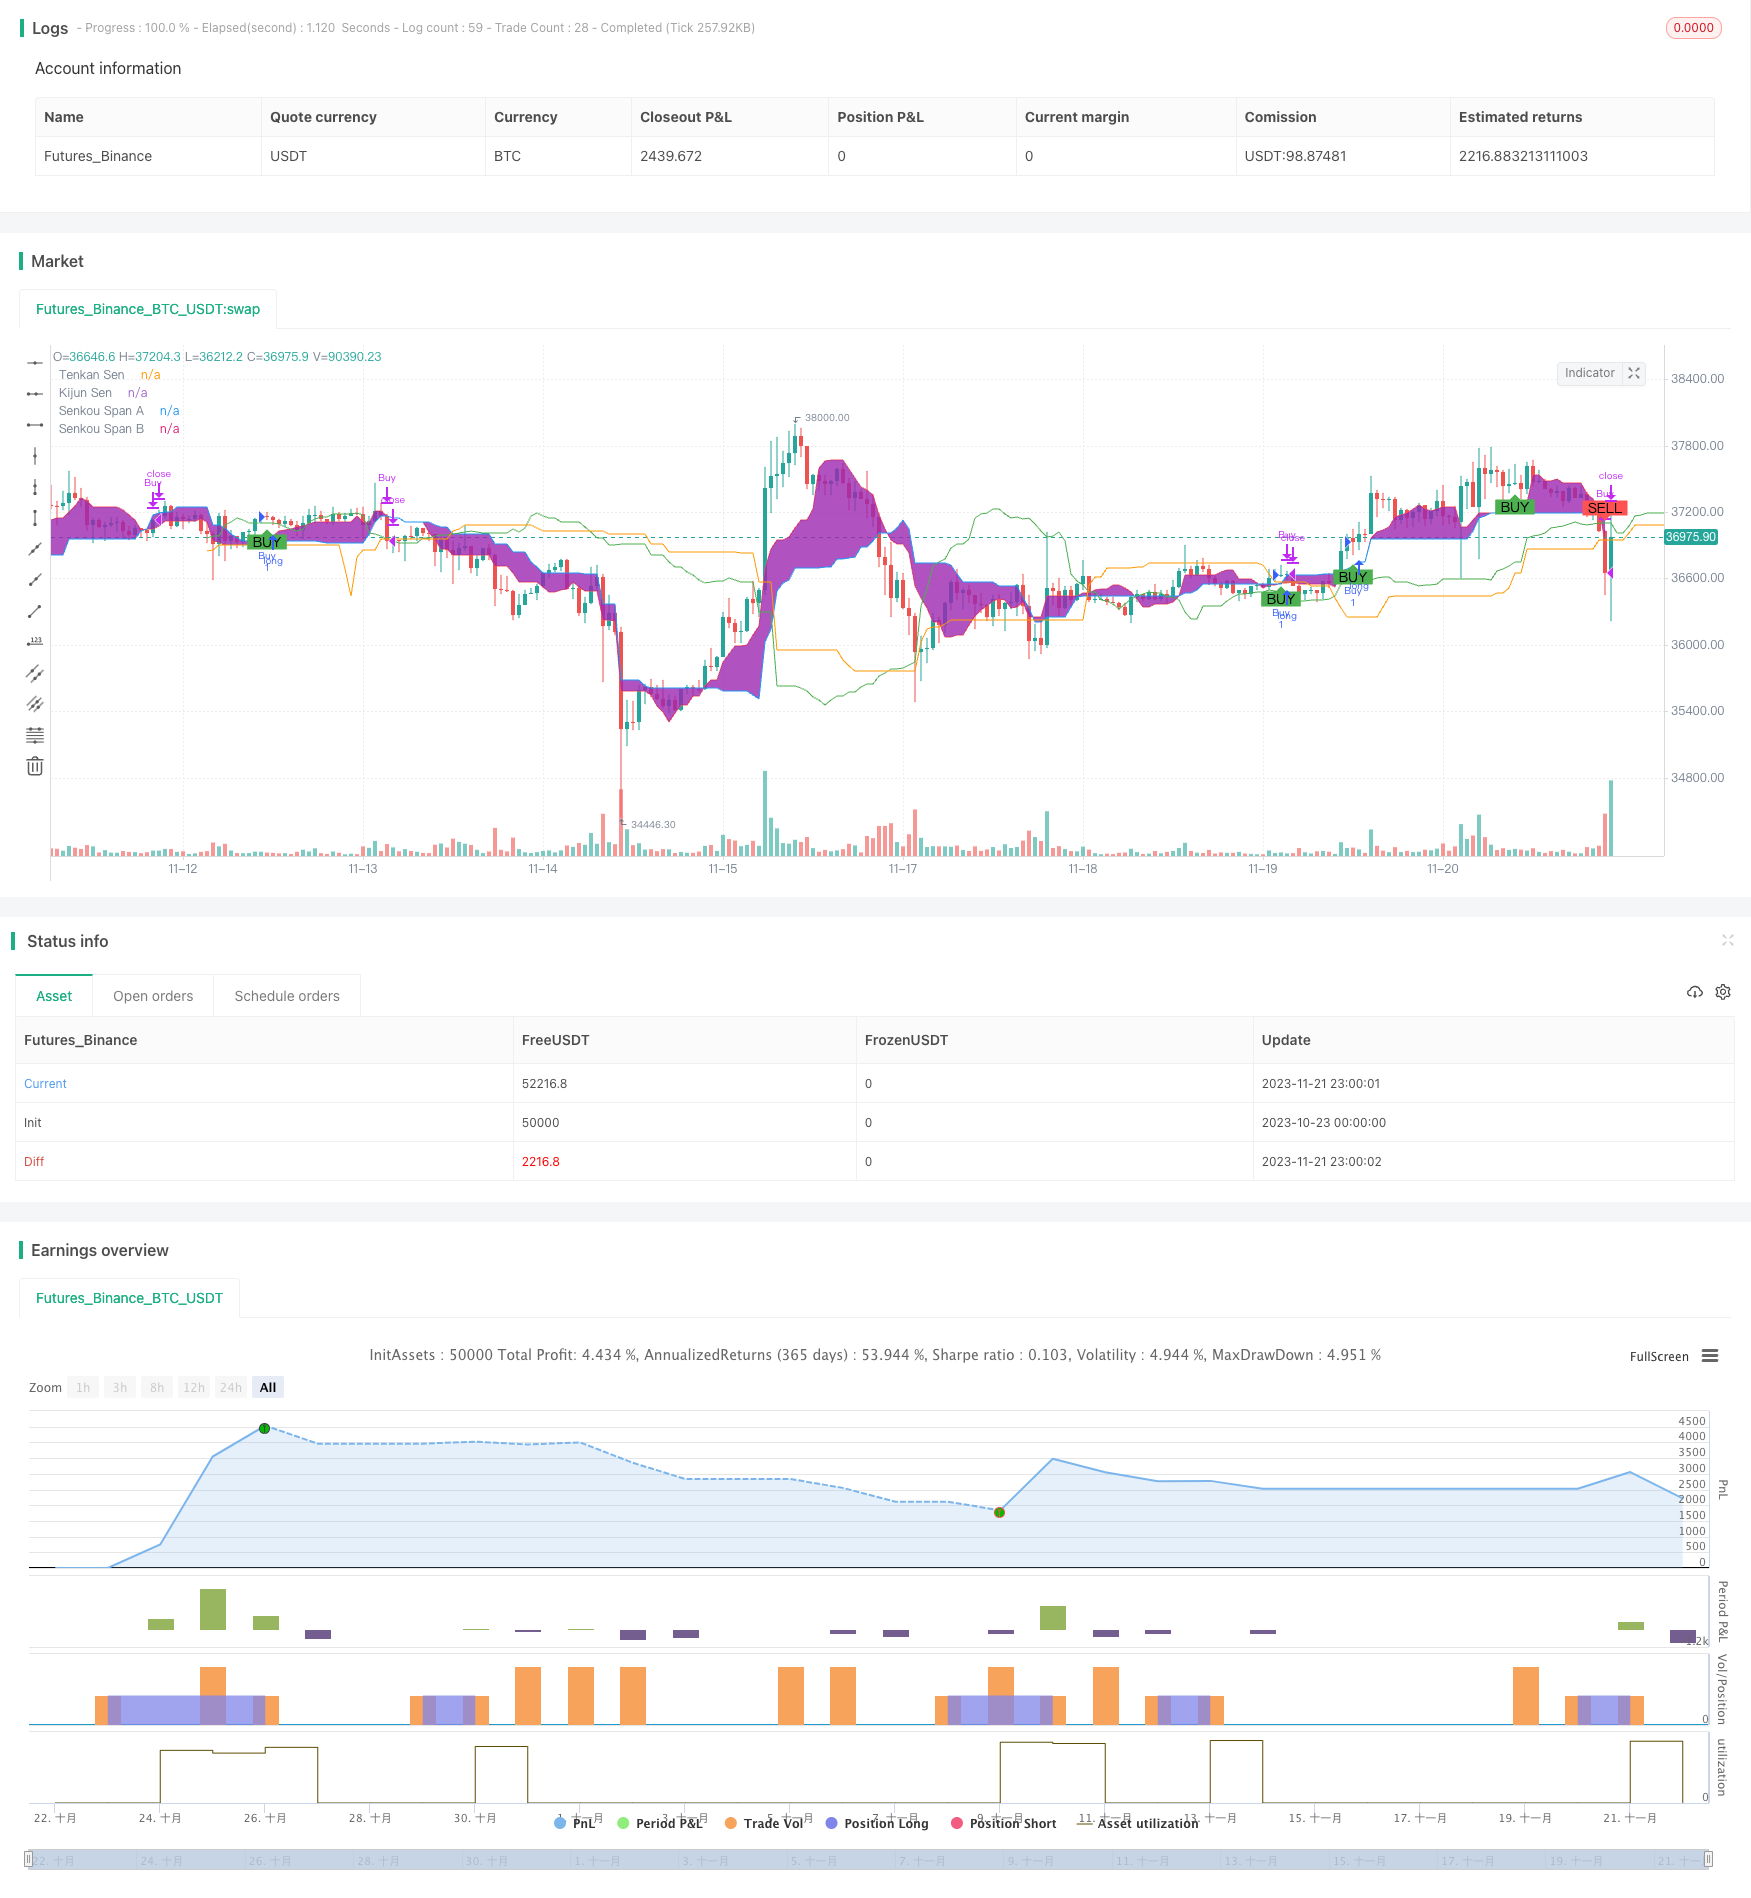
[trans]
概述
该策略运用著名的一目均衡图技术指标,识别股价的趋势和动量,实现自动化日内交易。当价格突破云层,并且转换线上穿基准线时买入;当出现下穿转化或价格跌破云层支持线时平仓。
原理
核心指标为一目均衡图的转换线、基准线、A云层线和B云层线。买入信号为价格大于云层,且转换线上穿基准线;卖出信号为转换线下穿基准线或价格低于云层。
该策略同时融合趋势跟踪和动量特征。转换线和基准线分别通过不同周期最高价和最低价的均值来描绘短期和中期的动量;而云层标识长期的支撑和压力区域。当短线动量指标转换线上穿中线指标基准线时,表示多头力量增强,价位上攻;当价格完全突破云层上方时,显示长线趋势转为上升,因此策略在此时产生买入信号。
相反,当转换线下穿基准线,动量转换为空方导向;或价格跌破云层,长线转为空头时,平仓信号被激活。此消彼长的交替转换避免追高杀跌,锁定了长短线态势统一的最佳买点和卖点。
优势分析
云飞翔高收益策略最大的优势在于,整合趋势和动量特征,平衡了操作频率和盈利水平,既保证了足够的交易次数,也规避了追涨杀跌的过度交易问题。一目均衡图作为常青指标,长盛不衰,应用广泛,可靠性得以保证。
特别需要强调的是,该策略买卖点选择的先进性。转换线和基准线构成自适应参数设定,避免人为参数调优的主观性和局限性;云层承担过滤器角色,为策略精确定位长短线一致之最优时点。此外,交叉与突破的组合运用,同时结合趋势和动量,也使策略的实战效能大为增强。总体而言,云飞翔策略在更高的胜率与更精准的进出场调控上,均非同一般。
风险分析
需要注意的是,云层在特定时期可能异常扩张或收缩,这会影响买卖信号的产生频率。如果遇到低波动和无明确趋势的区间市,策略买卖点可能较少。此外,一目均衡图指标组合较为复杂,个别组件失效时,会降低本策略的适用性。
针对这些情况,可通过动态调整一目均衡图参数来进行优化。譬如在低波动时缩小云层区间,提高交易频次;也可以引入附加判断指标,譬如成交量,避免误 operation。总体来说,云飞翔策略在大部分市况下都具有可靠的实盘效果。
优化方向
该策略还可扩展引入更多辅助技术指标,譬如布林带,进一步优化买卖点。也可以建立动态一目均衡图参数调整机制,基于不同的波动率和趋势状态切换参数组合,进一步提升策略的适应性。
总体而言,一目均衡图滤波器与动能指标交叉的框架不易改变,但可引入机器学习等方法,实现更加智能化、动态化的参数设定、范围调整,以及止盈止损标准的优化。这无疑能进一步锁定长短线朝同的精准买卖点。
总结
云飞翔高收益一目均衡图交易策略,成功结合趋势波段识别与动量指标,实现自动进出场。其买卖点选择算法的科学性与超前性,为追求长短线转换与高胜率交易的参与者提供了有力工具。面向未来,智能化动态参数调优空间广阔,必将使该策略交出更优异答卷。
||
Overview
This strategy leverages the renowned Ichimoku Kinko Hyo technology indicator to identify trend and momentum of asset prices and enables automated intraday trading. It goes long when price breaks through the cloud and the Tenkan line crosses over the Kijun line, and closes positions when the lines cross under or prices break down the cloud support level.
Principles
The core indicators consist of Tenkan line, Kijun line, Senkou Span A and Senkou Span B of the Ichimoku system. The buy signal activates when prices trade above the cloud and the Tenkan line crosses over the Kijun line. The sell signal triggers when the Tenkan line crosses below the Kijun line or prices drop below the cloud.
The strategy combines both trend following and momentum characteristics. The Tenkan and Kijun lines represent short-term and medium-term momentum respectively by averaging highest high and lowest low over different lookback periods. The cloud on the other hand identifies longer term support and resistance levels. When the momentum gauge Tenkan line crosses over the Kijun line, it signals strengthening upside momentum and prices tend to push higher. Together with prices breaking out above the top of the cloud decisively, it gives the confirmation that the longer term trend has turned bullish, hence a buy signal is generated.
On the contrary, when the Tenkan line crosses below the Kijun line, momentum flips bearish. Or when prices collapse below the cloud support, the long term trend turns downward. The sell signals get activated. This wax and wane configuration avoids chasing tops and selling lows. It locks in the optimal buy and sell points when both short term and long term trends align in the same direction.
Advantage Analysis
The biggest advantage of the Cloud Soaring High Yield strategy is integrating both trend and momentum lenses, achieving an excellent balance between trading frequency and profitability. It ensures adequate trading opportunities while avoiding excessive whipsaws from chasing surges and catching falls. The versatility and reliability of Ichimoku as a evergreen indicator cannot be understated.
What’s worth highlighting in particular is the sophistication in timing the strategy’s entry and exit signals. The adaptive parameter configuration of the Tenkan and Kijun lines avoids the subjectivity and restrictedness of manual parameter tuning. The cloud further acts as the filter to pinpoint the optimal ticks when both short term and long term trends concur. On top of that, the combination of crossovers and breakouts enriches the strategy by encapsulating both momentum and trend following, thereby enhancing its real world performance. In a nutshell, Cloud Soaring combines higher win rates and more precise entry/exit control to stand out from average strategies.
Risk Analysis
One caveat is that the cloud bands can expand or contract abnormally during certain periods, impacting the frequency of signal generation. In range-bound, low volatility environments with unclear trends, fewer trade signals may occur. In addition, with multiple intertwined components of Ichimoku, dysfunction of individual building blocks can dampen applicability of this strategy.
To address these weaknesses, dynamic adjustment of Ichimoku parameters can be explored for optimization, such as narrowing the cloud bands during low volatility regimes to increase participation rate. Supplementary indicators like trading volumes can also help validate signals and avoid false signals. Overall despite the limitations stated, satisfactory live performance of the Cloud Soaring strategy can still be achieved in most market conditions.
Enhancement Opportunities
The strategy can be further improved by introducing more complementary technical indicators, like Bollinger Bands, to refine entry and exit levels. Dynamic mechanism of tuning Ichimoku parameter settings can also be established, allowing alternating configurations based on changing volatility and trend landscapes, hence lifting adaptiveness.
In essence, the framework of Ichimoku filter and momentum oscillator crossover is robust. But methods like machine learning can be leveraged to enable smarter, more dynamic parameter configuration, range adjustment and stop loss/profit taking criteria setting - further optimizing the precise timing when long term and short term trends align.
Conclusion
The Cloud Soaring High Yield Ichimoku Trading Strategy succeeds in blending trend regime recognition and momentum indication for automated entries and exits. Its scientifically superior algorithms in locating buys and sells provide compelling solutions for those pursuing transitions between long term and short term trends while demanding high win rates. Moving forward, with ample room for intelligent dynamic parameter tuning, this strategy is poised to deliver even more exceptional outcomes.
[/trans]
Strategy Arguments
| Argument | Default | Description |
|---|---|---|
| v_input_1 | 9 | Tenkan Sen Periods |
| v_input_2 | 26 | Kijun Sen Periods |
| v_input_3 | 52 | Senkou Span B Periods |
| v_input_4 | 26 | Displacement |
Source (PineScript)
/*backtest
start: 2023-10-23 00:00:00
end: 2023-11-22 00:00:00
period: 1h
basePeriod: 15m
exchanges: [{"eid":"Futures_Binance","currency":"BTC_USDT"}]
*/

//@version=4
strategy("High Yield Ichimoku Cloud Strategy", shorttitle="HY Ichimoku", overlay=true)

// Ichimoku Cloud settings
tenkanPeriods = input(9, title="Tenkan Sen Periods")
kijunPeriods = input(26, title="Kijun Sen Periods")
senkouSpanBPeriods = input(52, title="Senkou Span B Periods")
displacement = input(26, title="Displacement")

// Calculating the Ichimoku lines
tenkanSen = (highest(high, tenkanPeriods) + lowest(low, tenkanPeriods)) / 2
kijunSen = (highest(high, kijunPeriods) + lowest(low, kijunPeriods)) / 2
senkouSpanA = (tenkanSen + kijunSen) / 2
senkouSpanB = (highest(high, senkouSpanBPeriods) + lowest(low, senkouSpanBPeriods)) / 2
chikouSpan = close[displacement]

// Plotting the Ichimoku Cloud
p1 = plot(tenkanSen, color=color.red, title="Tenkan Sen")
p2 = plot(kijunSen, color=color.blue, title="Kijun Sen")
p3 = plot(senkouSpanA, color=color.green, title="Senkou Span A", offset=displacement)
p4 = plot(senkouSpanB, color=color.orange, title="Senkou Span B", offset=displacement)
fill(p1, p2, color=color.purple, transp=80, title="Cloud")

// Buy and Sell conditions
buyCondition = crossover(tenkanSen, kijunSen) and close > max(senkouSpanA, senkouSpanB)[displacement]
sellCondition = crossunder(tenkanSen, kijunSen) and close < min(senkouSpanA, senkouSpanB)[displacement]

// Execute trade if conditions are met
if (buyCondition)
    strategy.entry("Buy", strategy.long)

if (sellCondition)
    strategy.close("Buy")

// Strategy exit conditions
strategy.close("Buy", when = crossunder(tenkanSen, kijunSen) or close < min(senkouSpanA, senkouSpanB)[displacement])

// Plot buy/sell signals
plotshape(series=buyCondition, title="Buy Signal", location=location.belowbar, color=color.green, style=shape.labelup, text="BUY")
plotshape(series=sellCondition, title="Sell Signal", location=location.abovebar, color=color.red, style=shape.labeldown, text="SELL")
Detail
https://www.fmz.com/strategy/432970
Last Modified
2023-11-23 10:56:49