
8.8 KiB
Name
震荡反转均线系统策略EMA-Oscillation-Reversal-System-Strategy
Author
ChaoZhang
Strategy Description
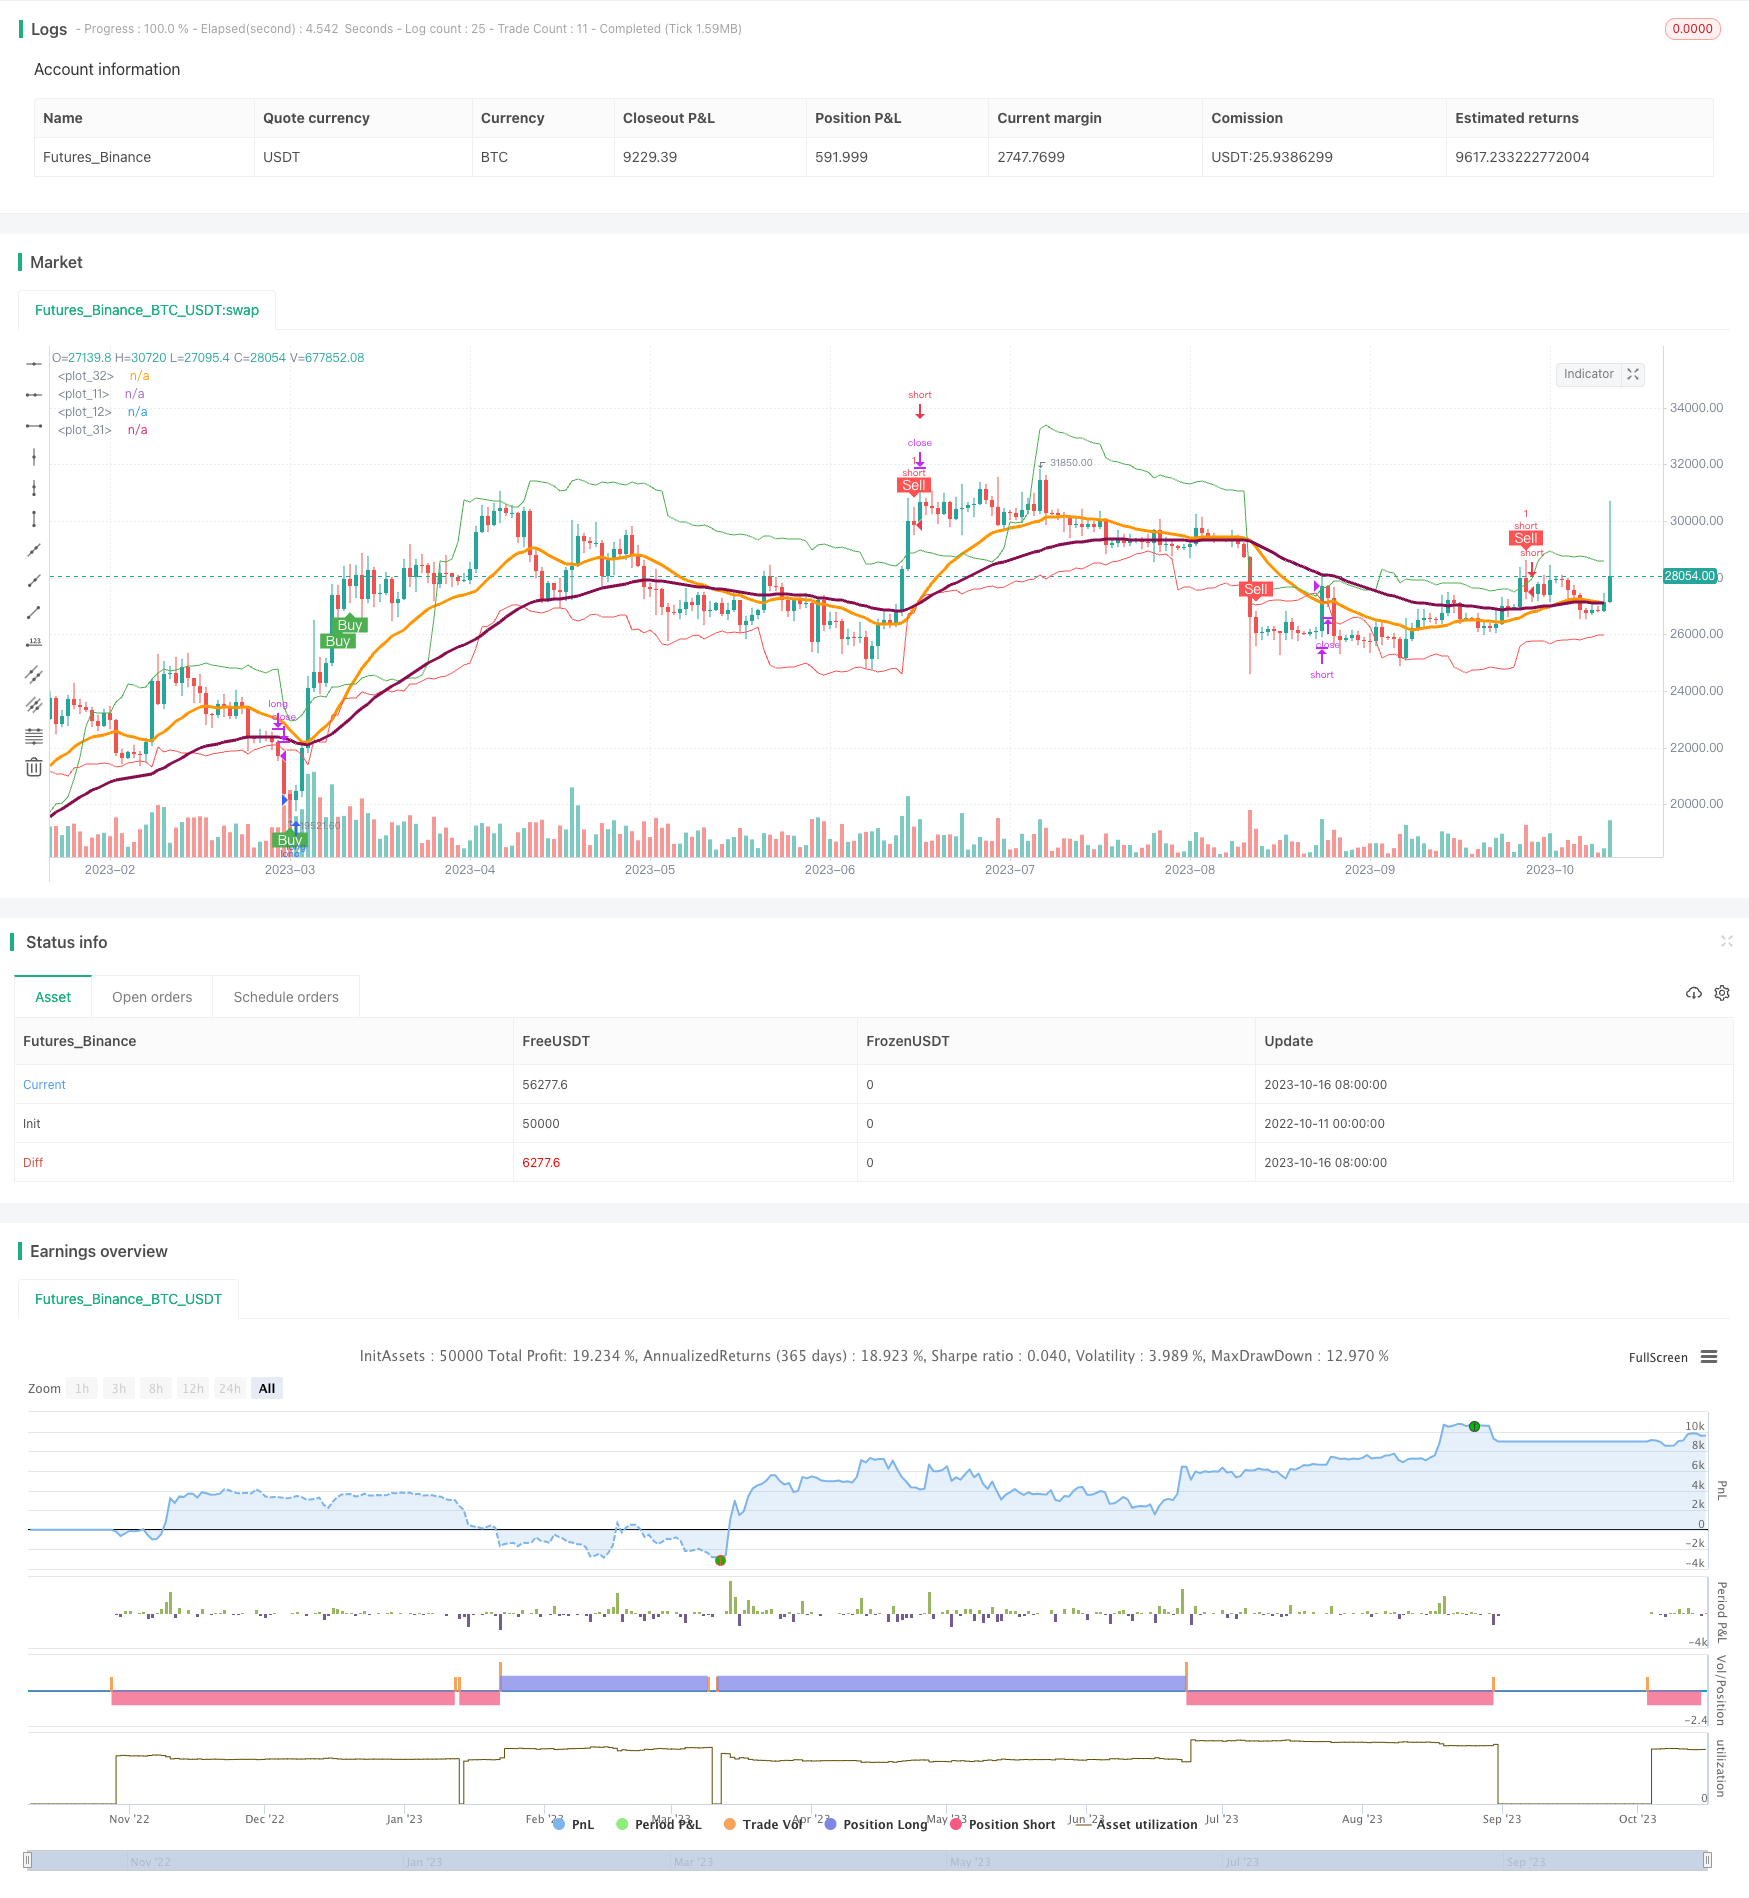
[trans]
概述
该策略利用均线系统判断趋势方向,并结合波动率指标避免低波动的震荡市场,采用震荡止损进行交易管理。
原理
该策略通过比较快速均线和慢速均线的位置关系来判断趋势方向。当快速均线上穿慢速均线时看多,下穿看空。为了避免震荡市场,策略还引入了布林带指标。通过计算布林带的宽度变化率,当变化率超过设定阈值时产生交易信号。最后,策略采用Chande利空策略的通道作为震荡止损,避免被困于震荡市场。
具体来说,策略的交易逻辑如下:
-
计算快速均线(默认20日)和慢速均线(默认50日)。
-
计算布林带(默认40日,2倍标准差)的宽度变化率。
-
当快速均线上穿慢速均线,并且布林带宽度变化率超过设定阈值(默认9%),产生多头信号。
-
当快速均线下穿慢速均线,并且布林带宽度变化率超过设定阈值(默认9%),产生空头信号。
-
计算Chande利空通道作为止损位。
-
多头止损为最高价-ATR倍数,空头止损为最低价+ATR倍数。
优势
-
使用均线系统判断趋势方向,可以有效跟踪趋势。
-
引入布林带宽度变化率避免震荡市场,可以减少不必要的交易。
-
采用震荡止损,可以及时止损离场,避免被困于震荡。
-
多种参数可调,可以针对不同市场进行优化。
-
策略逻辑清晰易理解,便于学习运用。
风险
-
均线系统存在延迟,可能错过快速反转的机会。
-
布林带参数设置不当可能过滤掉有效交易信号。
-
震荡止损过于敏感可能造成过频交易。
-
参数优化不到位可能导致持仓风险。
-
无法适应突发重大事件造成的市场剧烈变化。
优化方向
-
可以测试不同参数的均线组合,寻找最佳参数。
-
可以测试不同周期的布林带参数,找到最佳波动过滤效果。
-
可以结合其他指标进行入场确认,提高信号质量。
-
可以引入动态止损策略,让止损更好地跟踪市场。
-
可以结合机器学习技术自动优化参数,适应市场变化。
总结
该策略整合均线系统、布林带指标和震荡止损技术,形成了一个相对稳定的趋势跟踪系统。通过参数优化可以获得不错的策略效果。但仍需警惕趋势反转和市场震荡的风险,此外机器学习等技术可以进一步提升策略的稳健性。总体来说,该策略作为学习练手的策略还是非常适合的。
||
Overview
This strategy uses a moving average system to determine trend direction and combines volatility index to avoid low volatility oscillating markets, with chandelier exit to manage trades.
Principle
The strategy judges trend direction by comparing fast and slow moving averages. It goes long when fast MA crosses above slow MA, and goes short when fast MA crosses below slow MA. To avoid oscillating markets, the strategy also incorporates Bollinger Bands. It generates trading signals when the rate of change of BB width exceeds a threshold. Finally, the strategy uses Chandelier exits as stop loss to avoid being trapped in range-bound markets.
Specifically, the trading logic is as follows:
-
Calculate fast MA (default 20-day) and slow MA (default 50-day).
-
Calculate the rate of change of Bollinger Band (default 40-day, 2 standard deviations) width.
-
Go long when fast MA crosses above slow MA, and BB width change rate exceeds default threshold 9%.
-
Go short when fast MA crosses below slow MA, and BB width change rate exceeds default threshold 9%.
-
Calculate Chandelier long and short stops.
-
Long stop is highest high - ATR * multiplier. Short stop is lowest low + ATR * multiplier.
Advantages
-
MA system effectively tracks trends.
-
BB width change filters out oscillation, reducing unnecessary trades.
-
Chandelier exits timely stop losses avoiding being trapped.
-
Multiple adjustable parameters for optimization.
-
Clear logic, easy to understand and implement.
Risks
-
MA lag may miss fast reversals.
-
Improper BB parameters may filter valid signals.
-
Excessive chandelier exits cause over-trading.
-
Inadequate parameter optimization leads to holding risks.
-
Unable to adapt to extreme market changes from major events.
Optimization
-
Test different MA combinations to find optimal parameters.
-
Test different BB periods for best volatility filter.
-
Add other indicators for entry confirmation.
-
Introduce dynamic stops to better track markets.
-
Utilize machine learning to auto-optimize for changing markets.
Summary
This strategy integrates MA system, BB indicator and chandelier exits to form a relatively stable trend following system. Proper parameter optimization can achieve good results. But risks of trend reversal and oscillation remain. Machine learning can further enhance robustness. Overall a good strategy for learning.
[/trans]
Strategy Arguments
| Argument | Default | Description |
|---|---|---|
| v_input_1 | 22 | highest high o lowest low period |
| v_input_2 | 4 | multiplicador |
| v_input_3 | 50 | moving averages period |
| v_input_4 | 20 | moving averages period2 |
| v_input_5 | 0 | moving averages type: ema |
| v_input_6 | 40 | Bollinger bands 1 period |
| v_input_7_close | 0 | Bollinger band 1 source: close |
| v_input_8 | 2 | Bollinger Bands 1 factor |
| v_input_9 | false | Show Bollinger bands 1 |
| v_input_10 | 9 | widen % |
| v_input_11 | true | enable long |
| v_input_12 | true | enable short |
Source (PineScript)
/*backtest
start: 2022-10-11 00:00:00
end: 2023-10-17 00:00:00
period: 1d
basePeriod: 1h
exchanges: [{"eid":"Futures_Binance","currency":"BTC_USDT"}]
*/

// This source code is subject to the terms of the Mozilla Public License 2.0 at https://mozilla.org/MPL/2.0/
// © juanchez

//@version=4
strategy("CHI", overlay = true, close_entries_rule = "ANY")

n = input(title= "highest high o lowest low period", defval= 22)
f= input(title= "multiplicador", defval= 4)
long = highest(high, n) - atr(n)*f
short= lowest(low, n) + atr(n)*f
plot(long, color= color.red)
plot(short, color= color.green)

//moving averages
period= input(title= "moving averages period", defval= 50)
period2= input(title= "moving averages period2", defval= 20)
type= input(title= "moving averages type", options= ["sma", "ema"], defval= "ema")

//moving average function
mo(p, t) =>
    if t == "sma"
        sma(close[barstate.islast ? 1: 0], p)
    else  if t== "ema"
        ema(close[barstate.islast ? 1: 0], p)

m= mo(period, type)
m2= mo(period2, type)

trend= m2 > m

plot(m, color = color.maroon, linewidth = 3)
plot(m2, linewidth= 3)


//BOLLINGER BANDS ENTRIES
bb1_period= input(title= "Bollinger bands 1 period", defval=40, minval=1)
bb1_source=input(title="Bollinger band 1 source", defval=close)
bb1_multi=input(title="Bollinger Bands 1 factor", defval=2, minval=1, step=0.1)
show_bb1= input(title="Show Bollinger bands 1", defval=false)
//BOLLINGER BANDS
_bb(src, lenght, multi)=>
    float moving_avg= sma(src[barstate.islast? 1: 0], lenght)
    float deviation= stdev(src[barstate.islast? 1: 0], lenght)
    float lowerband = moving_avg - deviation*multi
    float upperband = moving_avg + deviation*multi

    [moving_avg, lowerband, upperband]

[bb1, lowerband1, upperband1]= _bb(bb1_source,  bb1_period, bb1_multi)

//FIRST BAND
plot(show_bb1? bb1 : na, title="BB1 Moving average", linewidth= 3, color= color.fuchsia)
plot(show_bb1? upperband1 : na, title="BB1 Upper Band", linewidth= 3, color= color.green)
plot(show_bb1? lowerband1 : na, title="BB1 Lower Band", linewidth= 3, color= color.red)

//BB's Width threshold
thresh= input(title= "widen %", defval= 9, minval = 0, step = 1, maxval= 100)

widht= (upperband1 - lowerband1)/bb1
roc= change(widht)/widht[1]*100
cross=crossover(roc, thresh)

// entry
//long
elong= input(true, title= "enable long")
longcondition= m2 > m and cross and elong

//short
eshort= input(true, title= "enable short")
shortcondition= m2 < m and cross and eshort


plotshape(longcondition? true: false , location= location.belowbar, style= shape.labelup, size= size.small, color= color.green, text= "Buy", textcolor= color.white)
plotshape(shortcondition? true: false , location= location.abovebar, style= shape.labeldown, size= size.small, color= color.red, text= "Sell", textcolor= color.white)

out= crossunder(close, long)
outt= crossover(close, short)

strategy.entry("long", strategy.long, when = longcondition)
strategy.close("long", when = out)

strategy.entry("short", strategy.short, when = shortcondition)
strategy.close("short", when = outt)
Detail
https://www.fmz.com/strategy/429576
Last Modified
2023-10-18 12:23:13