
9.9 KiB
Name
量子量价策略Quantum-Volume-Strategy
Author
ChaoZhang
Strategy Description
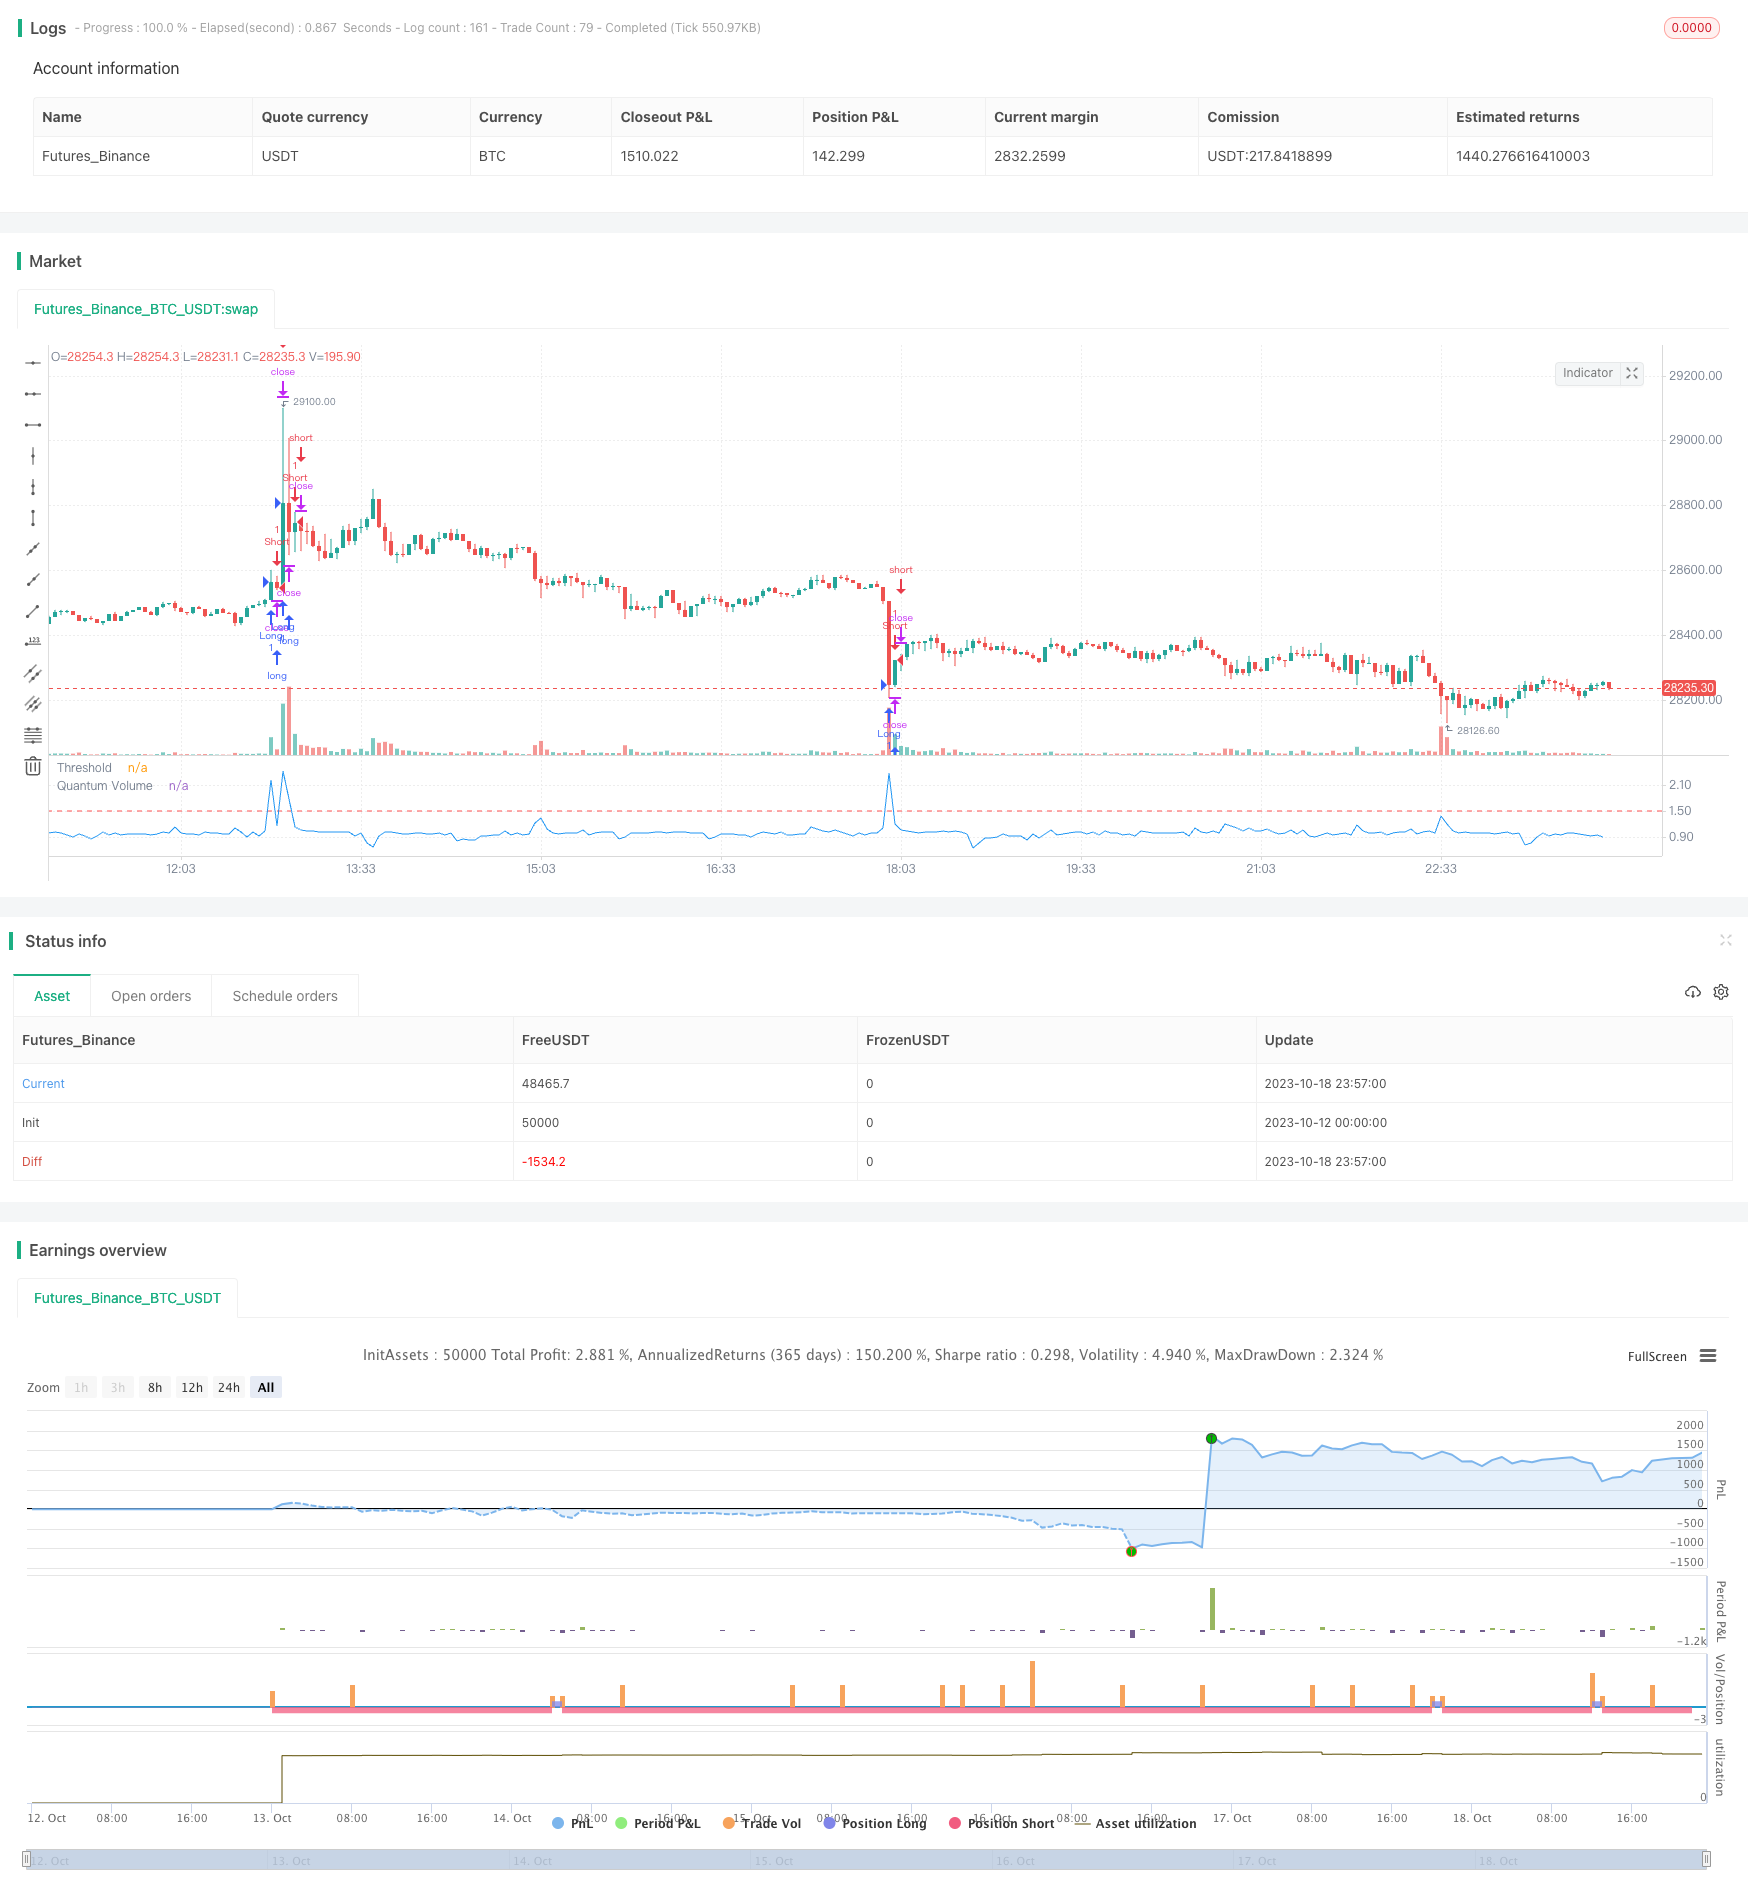
[trans]
概述
量子量价策略是一种基于量子量价指标的交易策略。该策略通过计算一定周期内的量子量价指标,并设定阈值,当指标上穿或下穿阈值时产生交易信号。该策略主要用于捕捉市场量能突破带来的趋势性价格变动。
策略原理
该策略的核心指标是量子量价指标。量子量价指标是将一定周期内的成交量移动平均线与上一周期的成交量移动平均线进行比率计算,通过比较量能的同比变化判断量能增强或减弱的程度。当量能显著增强时,量子量价指标大幅上升,通常预示着价格趋势性上涨;当量能明显减弱时,量子量价指标大幅下降,常常预示着价格趋势性下跌。
具体来说,该策略首先计算14周期的量子量价指标,然后设定1.5的指标阈值。当指标上穿阈值时产生做多信号;当指标下穿阈值时产生做空信号。做多信号表示量能放大,预测价格向上;做空信号表示量能缩减,预测价格向下。因此,该策略通过量能突破带来的量价反转预测价格趋势性变化。
优势分析
这种策略具有以下几个优势:
-
捕捉趋势早期信号。量子量价指标的计算基于成交量,能够提前捕捉到量能变化带来的价格趋势转折。使用该指标可以在价格趋势开始早期产生交易信号。
-
回避假突破。由于该策略基于量能指标,可以过滤掉无实际量能支持的假突破信号,避免不必要的交易亏损。
-
参数设置简单。该策略仅需要设置量子量价指标的参数,没有复杂的多参数优化过程,使用起来简单直观。
-
可融入各种交易系统。量子量价指标没有特定的使用限制,可以轻松地融入多种交易策略体系中,具有很强的适用性。
-
程序化交易友好。该策略完全基于clear规则,信号产生方式简单系统,非常适合程序化和算法交易。
风险分析
该策略也存在一些风险需要注意:
-
容易产生误信号。量子量价指标对交易量变化非常敏感,市场中可能出现一些异常的量价关系导致指标产生误信号。
-
需识别趋势期。该策略最适合趋势性行情,需要结合其他指标来识别趋势和盘整行情,避免在盘整中产生错误信号。
-
需控制交易频率。该策略交易频率可能较高,需要适当控制仓位规模和交易频率,以控制交易成本和风险。
-
需严格止损。由于无法完美预测价格变化,该策略需要严格的止损方式来控制单笔损失。
-
指标容易优化。量子量价指标的周期和参数可以多种组合,需要谨防过度优化。
优化方向
该策略可以从以下几个方面进行优化:
-
结合趋势判断指标,设置趋势过滤条件,避免在盘整中交易。例如结合SMA指标判断价格趋势方向。
-
增加整体仓位管理机制,例如基于资金管理的固定份额交易方式,控制单笔损失风险。
-
设置回撤止损方式,当价格向相反方向回撤一定幅度时止损出场,控制损失。
-
优化量子量价指标的参数,测试不同周期参数对策略效果的影响。也可以测试添加平滑等处理。
-
添加多个量能指标,进行综合判断。单一指标容易产生误信号,可以加入更多量能指标进行验证。
-
对交易信号设置过滤条件,例如连续3天指标阈值突破才入场,可以减少无谓交易。
总结
量子量价策略是一种典型的基于量能指标的交易策略。它通过计算量子量价指标判断量能变化,预测价格趋势性变动点。该策略可以有效捕捉趋势早期机会,避免追涨杀跌,是一种非常适合程序化交易的策略思路。但该策略也存在一定的误信号风险,需要进行适当优化并严格掌控风险,才能发挥策略的最大效果。总体来说,量子量价策略作为一种量能指标策略,可以为量化交易体系提供独特的Alpha,具有非常高的实用价值。
||
Overview
The Quantum Volume Strategy is a trading strategy based on the Quantum Volume indicator. This strategy generates trading signals when the Quantum Volume indicator crosses above or below a threshold value over a certain period. The strategy aims to capture trending price moves driven by significant changes in trading volume.
Strategy Logic
The core indicator of this strategy is the Quantum Volume indicator. The Quantum Volume indicator calculates the ratio between the moving average of volume over a certain period and the moving average of volume over the previous period. By comparing the relative changes in volume, it judges the strengthening or weakening of trading momentum. When trading momentum strengthens markedly, the Quantum Volume indicator surges, usually presaging a trending price rise. When momentum weakens significantly, the Quantum Volume indicator declines sharply, often foreshadowing a trending price fall.
Specifically, this strategy first calculates the 14-period Quantum Volume indicator, then sets a threshold of 1.5 for the indicator. A buy signal is generated when the indicator crosses above the threshold, and a sell signal is generated when the indicator crosses below the threshold. The buy signal indicates expanding momentum predicting an upside price move, while the sell signal represents contracting momentum calling for a downside price move. Therefore, the strategy aims to predict trending price reversals based on momentum breakouts reflected in volume.
Advantage Analysis
This strategy has several key advantages:
-
Captures early trend signals. The Quantum Volume indicator, based on volume data, can early detect trend reversals driven by volume changes. Using this indicator can generate trading signals at the very beginning of emerging trends.
-
Avoids false breakouts. Relying on volume momentum, this strategy filters out false breakout signals not supported by actual trading activity, avoiding unnecessary losses.
-
Simple parameter setting. The strategy only needs to set the parameters for the Quantum Volume indicator without complex multi-parameter optimization, making it simple and intuitive to use.
-
Flexibility. The Quantum Volume indicator has no rigid usage restrictions and can be easily incorporated into various trading systems, giving it strong adaptability.
-
Algorithm friendly. The strategy is completely rule-based with simple and systematic signal generation, making it very suitable for algorithmic and automated trading.
Risk Analysis
Some risks of this strategy should be noted:
-
Prone to whipsaws. The Quantum Volume indicator is very sensitive to volume changes. Abnormal volume-price patterns in the market may cause whipsaw signals.
-
Needs trend identification. This strategy works best in trending markets. Other indicators should be used to identify trends and ranges to avoid wrong signals during consolidations.
-
High trading frequency. The strategy may generate frequent trades. Position sizing and trade frequency should be controlled to manage costs and risks.
-
Strict stop loss needed. As price movements cannot be perfectly predicted, a tight stop loss is required to limit losses on individual trades.
-
Overoptimization risk. The parameters and periods of the Quantum Volume indicator can be optimized in many ways. Overoptimization should be avoided.
Improvement Directions
The strategy can be enhanced in several aspects:
-
Add trend filters using indicators like SMA to avoid trading in ranges.
-
Implement position sizing rules based on account size to control single trade risk.
-
Set trailing stop loss to lock in profits as price moves favorably.
-
Optimize parameters of the Quantum Volume indicator through robust backtesting. Smoothing techniques can also be tested.
-
Incorporate additional volume indicators for consensus confirmation to avoid false signals.
-
Add signal filters such as requiring 3 consecutive closes beyond thresholds to reduce unwanted trades.
Summary
The Quantum Volume Strategy is a representative trading strategy based on volume momentum. It forecasts trend reversals by assessing changes in momentum reflected in the Quantum Volume indicator. This strategy can effectively capture early trend opportunities and avoid chasing momentum extremes. With proper enhancements and risk management, the Quantum Volume Strategy can significantly improve the performance of quantitative trading systems. Overall, as a unique alpha source based on volume analysis, the Quantum Volume Strategy has immense practical value for algo trading.
[/trans]
Strategy Arguments
| Argument | Default | Description |
|---|---|---|
| v_input_1 | 14 | Quantum Volume Period |
| v_input_2 | 1.5 | Quantum Volume Threshold |
Source (PineScript)
/*backtest
start: 2023-10-12 00:00:00
end: 2023-10-19 00:00:00
period: 3m
basePeriod: 1m
exchanges: [{"eid":"Futures_Binance","currency":"BTC_USDT"}]
*/

//@version=5
strategy("Quantum Volume Strategy")

// Quantum Volume indicator inputs
qvPeriod = input(14, "Quantum Volume Period")
qvThreshold = input(1.5, "Quantum Volume Threshold")

// Calculate Quantum Volume
qv = ta.sma(volume, qvPeriod) / ta.sma(volume, qvPeriod)[1]

// Entry conditions
enterLong = ta.crossover(qv, qvThreshold)
enterShort = ta.crossunder(qv, qvThreshold)

// Exit conditions
exitLong = ta.crossunder(qv, qvThreshold)
exitShort = ta.crossover(qv, qvThreshold)

// Strategy orders
if (enterLong)
    strategy.entry("Long", strategy.long)
if (enterShort)
    strategy.entry("Short", strategy.short)

if (exitLong)
    strategy.close("Long")
if (exitShort)
    strategy.close("Short")

// Plot Quantum Volume and threshold
plot(qv, title = "Quantum Volume", color = color.blue)
hline(qvThreshold, "Threshold", color = color.red)
Detail
https://www.fmz.com/strategy/429775
Last Modified
2023-10-20 16:28:44