
7.4 KiB
Name
量化黄金交叉策略Quantitative-Golden-Cross-Strategy
Author
ChaoZhang
Strategy Description
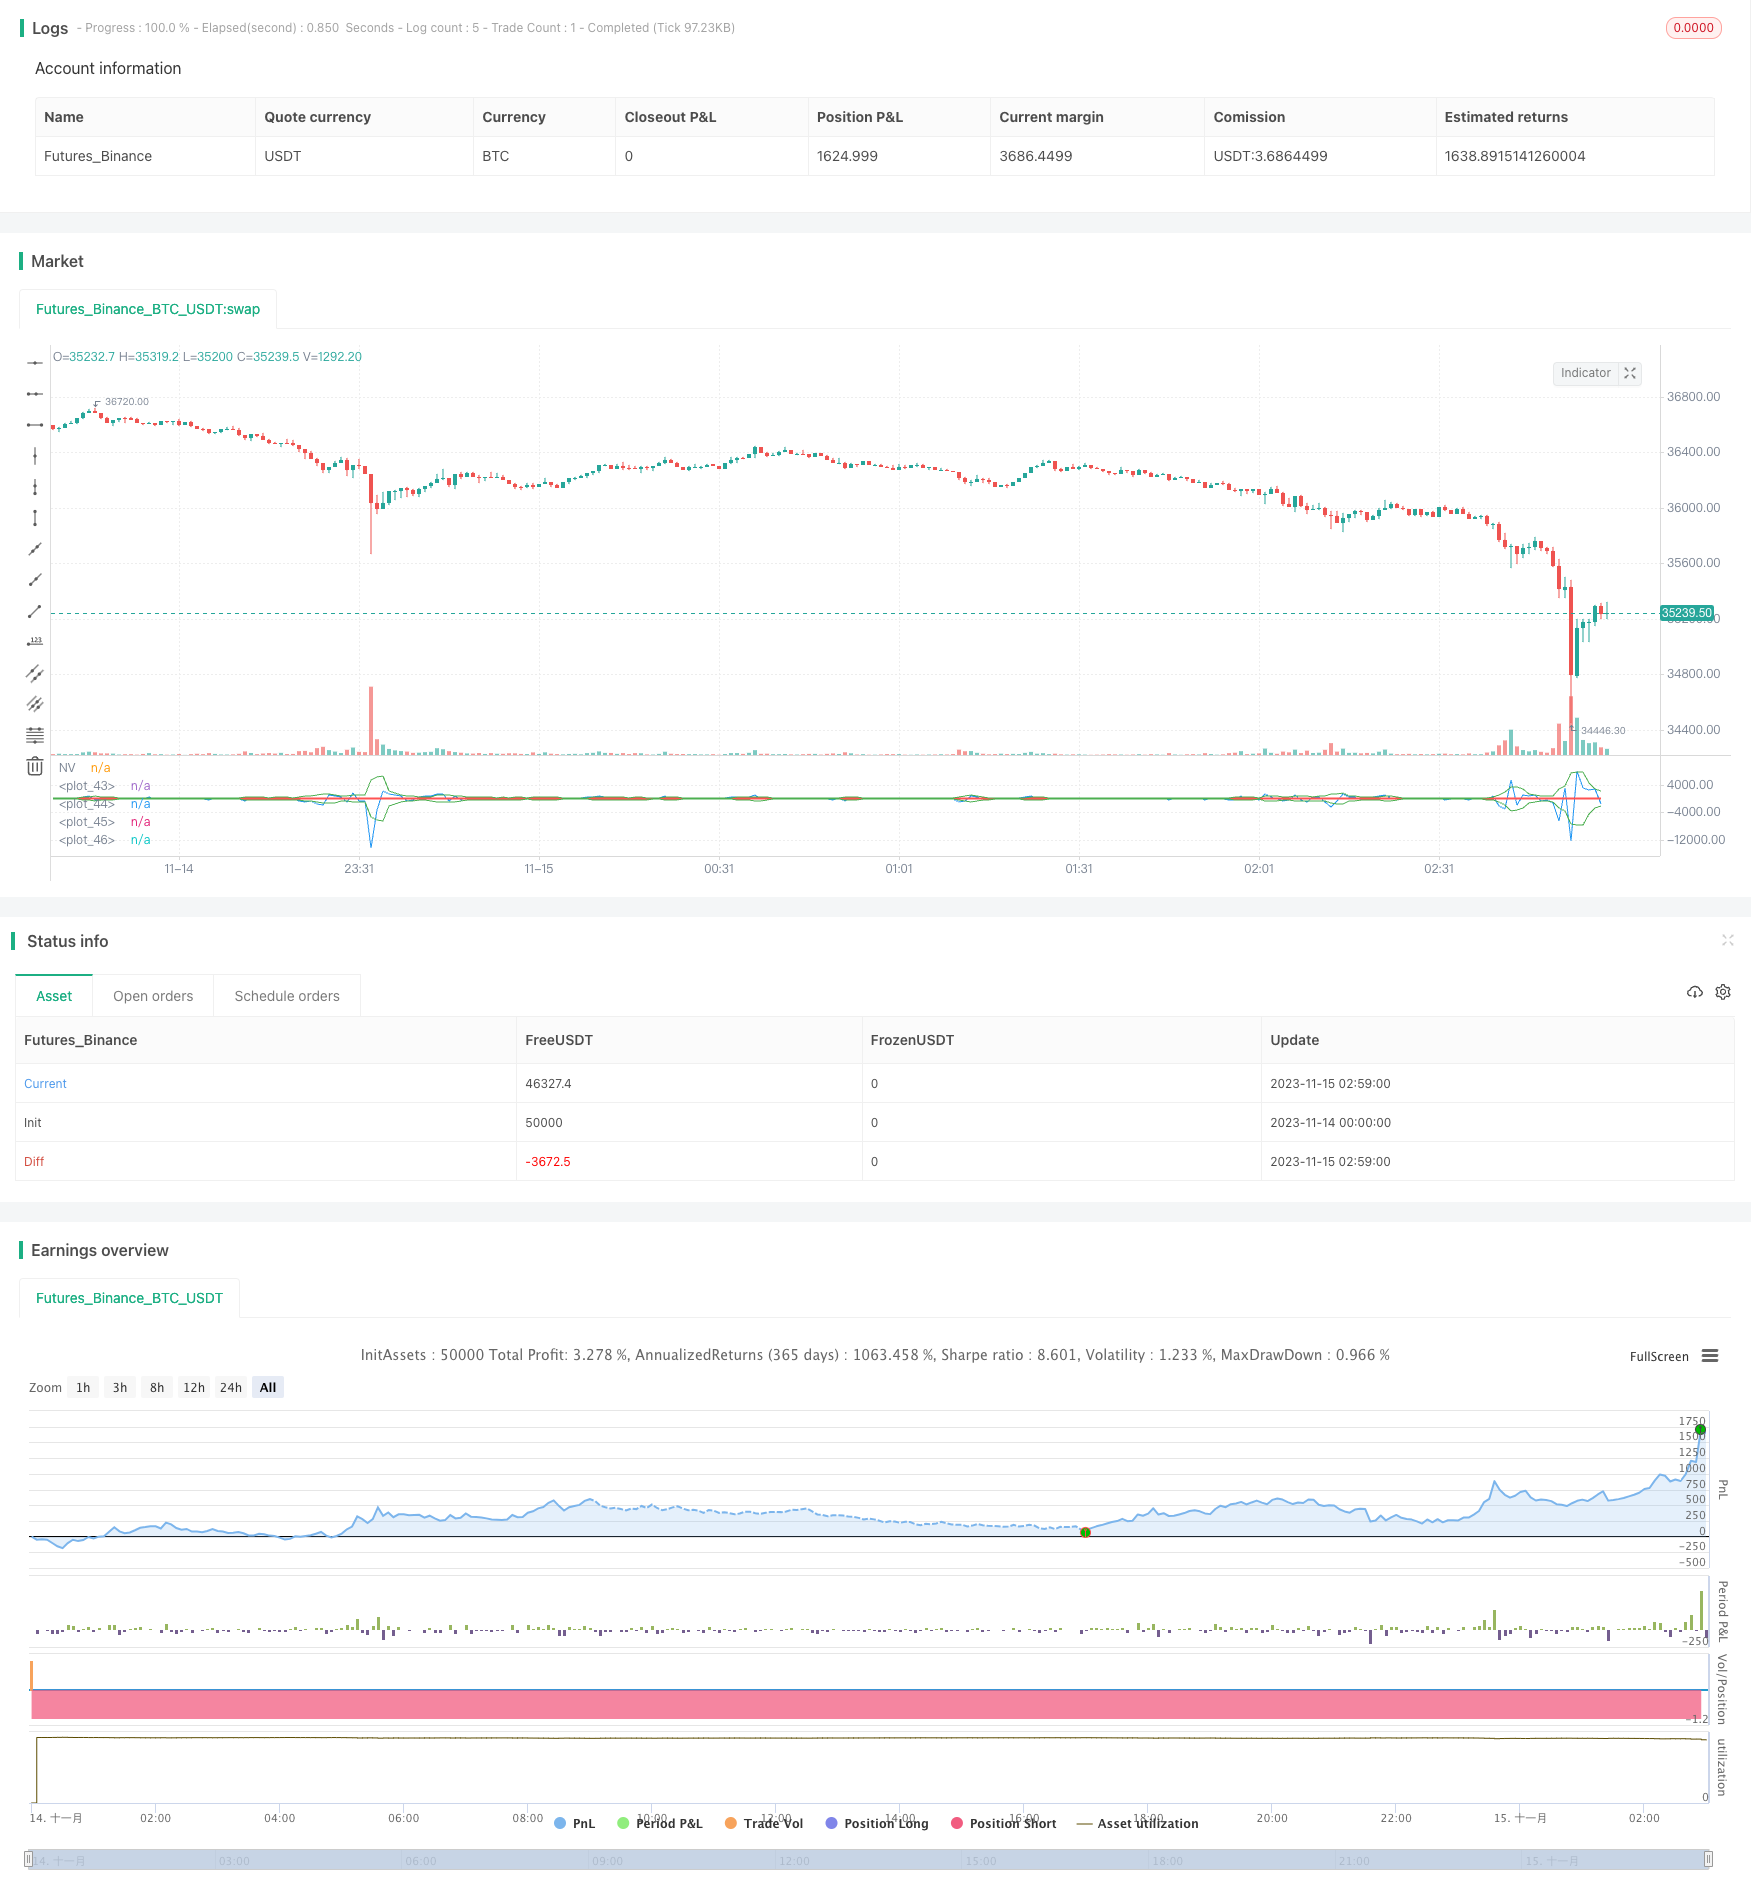
[trans]
概述
本策略通过计算自定义净量指标,实现量化黄金交叉买入和死叉卖出的交易策略。该策略属于趋势跟随型策略。
策略原理
策略的核心逻辑是计算自定义的净量(NV)指标。NV指标通过判断价格的变化方向,如果为正则取当日成交量,如果为负则取当日成交量的负值,如果无变化则取0。这样可以更清晰地反映价格变化和成交量的关系。
之后,策略计算NV指标的3日简单移动平均线,分别作为黄金交叉线和死叉线。当NV指标从下向上突破黄金交叉线时,做多;当NV从上向下突破死叉线时,做空。
此外,策略还设置了参数化的起止时间,对交易时间进行控制。
策略优势
该策略最大的优势是策略简单清晰,容易理解,参数设置灵活,可自定义交易品种、交易时段等。此外,该策略属于趋势跟随型策略,能够有效捕捉价格趋势,降低交易频率,获得较高的盈利率。
策略风险
该策略主要存在以下风险:
-
日跟随策略,不能及时反应价格变化趋势。可能错过部分交易机会或者无法及时止损。
-
量化黄金交叉本身具有一定的滞后性,可能导致入场偏晚,扩大亏损。
-
无法有效过滤市场噪音,容易被套。
可采用动态移动平均,结合其他指标过滤降低风险。
策略优化方向
该策略可以从以下几个方面进行优化:
-
增加止损策略,利用移动止损、隔夜止损等方式控制单笔损失。
-
增加过滤指标,利用MACD、KDJ等其他指标过滤误报信号,提高策略稳定性。
-
参数优化,通过遗传算法、马尔可夫链等方法迭代寻找最优参数组合。
-
策略组合,与其他非相关策略进行组合,可以进一步分散风险,提高整体收益率。
总结
本策略通过量化黄金交叉实现了简单有效的趋势跟随,虽然存在一定程度的滞后性,但参数设置灵活,容易理解,是一种适合初学者实践的策略。通过持续优化,可以逐步提升策略效果,降低风险。
||
Overview
This strategy calculates a custom net volume indicator to implement a trading strategy of buying on golden crossover and selling on death crossover. This strategy belongs to the trend following strategy.
Strategy Principle
The core logic of the strategy is to calculate a custom net volume (NV) indicator. The NV indicator judges the direction of price changes. If positive, it takes the daily volume. If negative, it takes the negative value of the daily volume. If unchanged, it takes 0. This can more clearly reflect the relationship between price changes and volume.
The strategy then calculates the 3-day simple moving average line of the NV indicator, respectively, as the golden cross line and death cross line. When the NV indicator breaks through the golden cross line from bottom to top, go long. When NV breaks through the death cross line from top to bottom, go short.
In addition, the strategy also sets parameterized start and end times to control trading hours.
Advantages of Strategy
The biggest advantage of this strategy is that the strategy is simple and clear, easy to understand, flexible parameter settings, customizable trading varieties, trading hours, etc. In addition, this strategy belongs to a trend-following strategy that can effectively capture price trends, reduce trading frequency, and achieve higher returns.
Risks of Strategy
The main risks of this strategy are:
-
The daily following strategy cannot respond promptly to changes in price trends. It may miss some trading opportunities or fail to stop losses in time.
-
The quantitative golden cross itself has certain hysteresis, which may lead to late entry and amplified losses.
-
Unable to effectively filter out market noise and susceptible to traps.
Moving averages can be used dynamically, combined with other indicators to reduce risks.
Optimization Directions
The strategy can be optimized in the following aspects:
-
Increase stop loss strategies to control single loss with moving stop loss, overnight stop loss methods.
-
Increase filtering indicators and use MACD, KDJ and other indicators to filter false signals and improve strategy stability.
-
Parameter optimization, iterative search for the optimal parameter combination through genetic algorithms, Markov chains and other methods.
-
Strategy portfolio can be combined with other unrelated strategies to further diversify risks and increase overall returns.
Conclusion
This strategy implements simple and effective trend following through quantitative golden crosses. Although there is a certain degree of hysteresis, the parameter settings are flexible and easy to understand. It is a strategy suitable for beginners to practice. Through continuous optimization, the strategy effect can be gradually improved and risks reduced.
[/trans]
Strategy Arguments
| Argument | Default | Description |
|---|---|---|
| v_input_1_close | 0 | VA Source: close |
| v_input_2 | 50 | VHigh Amount |
| v_input_3 | -50 | VLow Amount |
| v_input_4 | true | From Month |
| v_input_5 | true | From Day |
| v_input_6 | 2018 | From Year |
| v_input_7 | true | To Month |
| v_input_8 | true | To Day |
| v_input_9 | 9999 | To Year |
Source (PineScript)
/*backtest
start: 2023-11-14 00:00:00
end: 2023-11-15 03:00:00
period: 1m
basePeriod: 1m
exchanges: [{"eid":"Futures_Binance","currency":"BTC_USDT"}]
*/

//@version=3
strategy(title="@DankCoins - Customized Net Volume")
src = input(defval = close, title = "VA Source")
nv = change(src) > 0 ? volume : change(src) < 0 ? -volume : 0*volume


// Inputs //
VHigh = input(defval = 50, title = "VHigh Amount")
VLow = input(defval = -50, title = "VLow Amount")


// === INPUT BACKTEST RANGE ===
FromMonth = input(defval = 1, title = "From Month", minval = 1, maxval = 12)
FromDay   = input(defval = 1, title = "From Day", minval = 1, maxval = 31)
FromYear  = input(defval = 2018, title = "From Year", minval = 2012)
ToMonth   = input(defval = 1, title = "To Month", minval = 1, maxval = 12)
ToDay     = input(defval = 1, title = "To Day", minval = 1, maxval = 31)
ToYear    = input(defval = 9999, title = "To Year", minval = 2012)

MAV1 = sma(volume, 3)
MAV2 = -sma(volume, 3)

enterShort = crossunder(nv, MAV1)
exitShort = crossunder(nv, MAV2)
enterLong = crossover(nv, MAV2)
exitLong = crossover(nv, MAV1)

// Time Function
start     = timestamp(FromYear, FromMonth, FromDay, 00, 00)  // backtest start window
finish    = timestamp(ToYear, ToMonth, ToDay, 23, 59)        // backtest finish window
window()  => time >= start and time <= finish ? true : false // create function "within window of time"


strategy.entry(id="Long Entry", long=true, when=enterLong and window())
strategy.entry(id="Short Entry", long=false, when=enterShort and window())
strategy.exit("Exit Long", from_entry = "Long Entry",  when=exitLong and window())
strategy.exit("Exit Short", from_entry = "Short Entry",  when=exitShort and window())


// Plot
plot(nv, color=blue, title="NV")
plot(VHigh, color=red)
plot(VLow, color=red)
plot(MAV1, color=green)
plot(MAV2, color=green)
Detail
https://www.fmz.com/strategy/432879
Last Modified
2023-11-22 14:39:33