
11 KiB
Name
量化波浪挤压策略Momentum-Squeeze-Strategy
Author
ChaoZhang
Strategy Description
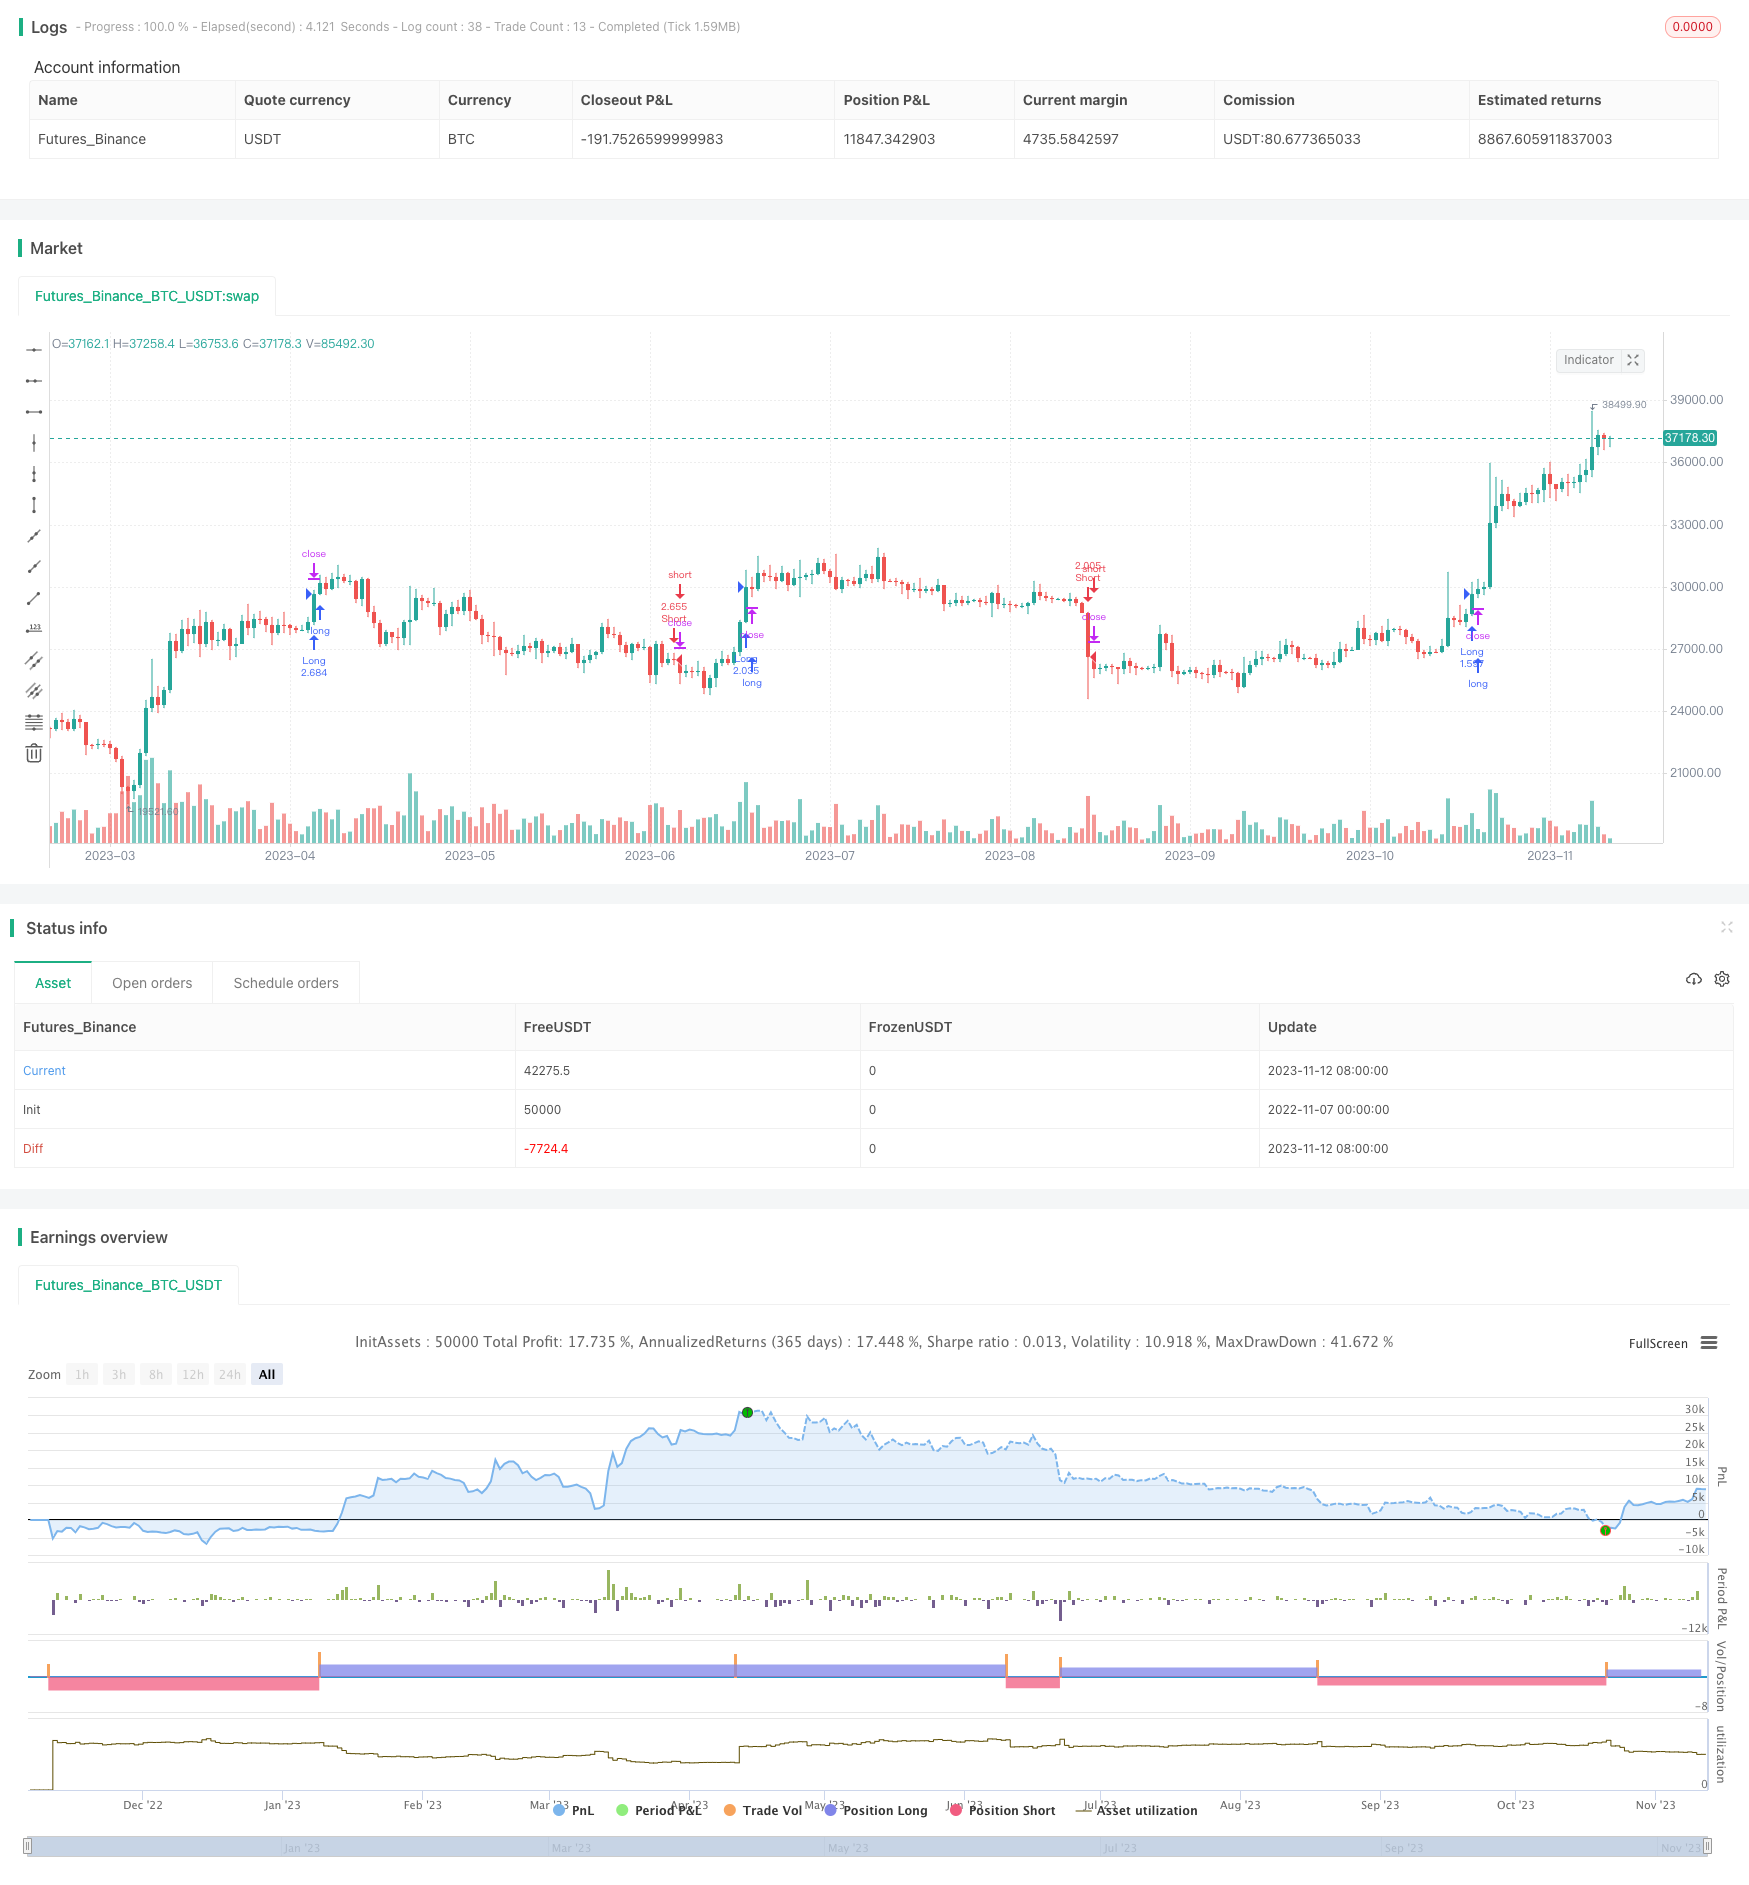 [trans]
概述
该策略的主要思想是结合Lazy Bear的动量指标和Crypto Face的MFI指标,在趋势向上时买入,在趋势向下时卖出,实现追踪市场趋势的量化交易策略。
策略原理
-
使用Lazy Bear的动量指标BlueWave,其通过计算close价与20日高点、低点和close均价的线性回归,来判断趋势方向。当BlueWave上穿0时,表示趋势向上;当BlueWave下穿0时,表示趋势向下。
-
使用Crypto Face改进的MFI指标,其通过计算近58日涨跌额和成交量,来判断资金流向。MFI大于0表示资金流入,MFI小于0表示资金流出。
-
当BlueWave上穿0且MFI大于0时,发出买入信号,开仓做多;当BlueWave下穿0且MFI小于0时,发出卖出信号,开仓做空。
-
设置止损止盈条件,追踪市场趋势实现盈利,同时控制风险。
策略优势
-
组合使用两个指标,可以更准确判断市场趋势方向。
-
BlueWave指标平滑曲线,避免被异常数据带偏,判断市场趋势更可靠。
-
MFI指标可以判断资金流向,避免假突破带来亏损。
-
策略参数较少,容易实现和操作。
-
可灵活设置止损止盈条件,控制交易风险。
-
可设置买入卖出时间段,避开市场特定时间的异常波动。
策略风险
-
大盘持续下跌时,该策略可能继续追低做空而发生亏损。
-
指标产生假信号时,可能入场后被套。
-
止损点设置过大,亏损扩大的风险。
-
波动过大市场,止损点被突破的概率较大。
-
参数优化不当,可能导致策略效果欠佳。
-
策略产生过于频繁交易信号,增加交易费用和滑点成本。
优化方向
-
优化BlueWave和MFI的参数,使指标更稳定可靠。
-
结合趋势指标,避免持续做空亏损。
-
动态调整止损止盈比例,降低被套概率。
-
优化开仓条件,减少假信号。
-
考虑加入仓位控制,避免追涨杀跌。
-
结合机器学习算法,使买卖点更精确。
总结
该策略通过组合使用BlueWave和MFI两个指标判断趋势方向,在趋势向上时做多,向下时做空,能够有效跟踪市场趋势获利。但也存在一些参数设置、止损止盈、持续下跌等方面的风险,需要进一步优化参数设置、止损机制、过滤条件等,以提高策略效果和稳定性。总体来说,该策略较为简单直观,在长线追踪趋势方面效果较好,但需要警惕被困于震荡行情中造成亏损。
||
Overview
The main idea of this strategy is to combine Lazy Bear's momentum indicator and Crypto Face's MFI indicator to go long when the trend goes up and go short when the trend goes down, realizing a quantitative trading strategy that follows market trends.
Strategy Logic
-
Use Lazy Bear's momentum indicator BlueWave, which calculates the linear regression of close price versus the 20-day highest high, lowest low and close average to determine the trend direction. When BlueWave crosses above 0, it indicates an upward trend; when it crosses below 0, it indicates a downward trend.
-
Use the improved MFI indicator by Crypto Face, which calculates the sum of price change and volume over the past 58 days to determine the money flow. MFI greater than 0 indicates money inflow, less than 0 indicates outflow.
-
When BlueWave crosses above 0 and MFI is greater than 0, a buy signal is generated to open a long position; when BlueWave crosses below 0 and MFI is less than 0, a sell signal is generated to open a short position.
-
Set stop loss and take profit conditions to follow the market trend for profit, while controlling risks.
Advantages
-
Combining two indicators can more accurately determine market trend direction.
-
BlueWave's smooth curve avoids bias from outliers, making trend judgement more reliable.
-
MFI can determine money flow, avoiding losses from false breakouts.
-
The strategy has few parameters and is easy to implement and operate.
-
Flexible stop loss and take profit settings help control trading risks.
-
Trading sessions can be set to avoid abnormal volatility during specific market times.
Risks
-
Continued downtrend may lead to successive short positions and losses.
-
False signals may lead to being trapped after entering positions.
-
Oversized stop loss may amplify losses.
-
High volatility may frequently hit stop loss points.
-
Improper parameter optimization may lead to poor strategy performance.
-
Too frequent trading signals may increase transaction costs and slippage.
Enhancement
-
Optimize parameters of BlueWave and MFI for more steady and reliable signals.
-
Incorporate trend indicators to avoid sustained short losses.
-
Dynamically adjust stop loss/take profit ratios to lower being trapped probability.
-
Refine entry conditions to reduce false signals.
-
Consider position sizing to avoid chasing rallies and dumping dips.
-
Combine with machine learning models for more accurate entry and exit points.
Conclusion
This strategy combines BlueWave and MFI indicators to determine trend direction, going long on uptrends and short on downtrends, effectively following market trends for profits. However, risks exist in parameter settings, stop loss/take profit, sustained downtrends etc, requiring further optimization on parameter tuning, stop loss mechanisms, filter conditions etc to improve strategy performance and robustness. Overall, the strategy is intuitive and works well for long-term trend following, but losses may be incurred when trapped in ranging markets.
[/trans]
Strategy Arguments
| Argument | Default | Description |
|---|---|---|
| v_input_1 | true | (?SL/TP For Long Strategy)Enable Long Strategy |
| v_input_2 | 50 | Stoploss % |
| v_input_3 | 50 | Take Profit % |
| v_input_4 | true | (?SL/TP For Short Strategy)Enable Short Strategy |
| v_input_5 | 50 | Stoploss % |
| v_input_6 | 50 | Take Profit % |
| v_input_7 | true | (?Date Range)Start Date |
| v_input_8 | true | Start Month |
| v_input_9 | 1804 | Start Year |
| v_input_10 | true | End Date |
| v_input_11 | true | End Month |
| v_input_12 | 2077 | End Year |
Source (PineScript)
/*backtest
start: 2022-11-07 00:00:00
end: 2023-11-13 00:00:00
period: 1d
basePeriod: 1h
exchanges: [{"eid":"Futures_Binance","currency":"BTC_USDT"}]
*/

// @version=4
// This source code is subject to the terms of the Mozilla Public License 2.0 at https://mozilla.org/MPL/2.0/
// © Bunghole 2021
strategy(title="Crypto Squeeze Strategy", initial_capital = 100000, default_qty_type = strategy.percent_of_equity, default_qty_value = 100, pyramiding = 0, currency = 'USD', overlay=true)

//// Stoploss and Take Profit Parameters
// Enable Long Strategy
enable_long_strategy = input(true, title="Enable Long Strategy", group="SL/TP For Long Strategy",inline="1")
long_stoploss_value = input(defval=50, title='Stoploss %', type=input.float, minval=0.1, group="SL/TP For Long Strategy",inline="2")
long_stoploss_percentage = (close * (long_stoploss_value / 100)) / syminfo.mintick
long_takeprofit_value = input(defval=50, title='Take Profit %', type=input.float, minval=0.1, group="SL/TP For Long Strategy",inline="2")
long_takeprofit_percentage = (close * (long_takeprofit_value / 100)) / syminfo.mintick

// Enable Short Strategy
enable_short_strategy = input(true, title="Enable Short Strategy", group="SL/TP For Short Strategy",inline="3")
short_stoploss_value = input(defval=50, title='Stoploss %', type=input.float, minval=0.1, group= "SL/TP For Short Strategy",inline="4")
short_stoploss_percentage = (close * (short_stoploss_value / 100)) / syminfo.mintick
short_takeprofit_value = input(defval=50, title='Take Profit %', type=input.float, minval=0.1, group="SL/TP For Short Strategy",inline="4")
short_takeprofit_percentage = (close * (short_takeprofit_value / 100)) / syminfo.mintick

// Plot Stoploss & Take Profit Levels
long_stoploss_price = strategy.position_avg_price * (1 - long_stoploss_value/100)
long_takeprofit_price = strategy.position_avg_price * (1 + long_takeprofit_value/100)
short_stoploss_price = strategy.position_avg_price * (1 + short_stoploss_value/100)
short_takeprofit_price = strategy.position_avg_price * (1 - short_takeprofit_value/100)
plot(enable_long_strategy and not enable_short_strategy ? long_stoploss_price: na, color=#ff0000, style=plot.style_linebr, linewidth=2, title="Long SL Level")
plot(enable_long_strategy and not enable_short_strategy ? long_takeprofit_price: na, color=#008000, style=plot.style_linebr, linewidth=2, title="Long TP Level")
plot(enable_short_strategy and not enable_long_strategy ? short_stoploss_price: na, color=#ff0000, style=plot.style_linebr, linewidth=2, title="Short SL Level")
plot(enable_short_strategy and not enable_long_strategy ? short_takeprofit_price: na, color=#008000, style=plot.style_linebr, linewidth=2, title="Short TP Level")

// Date Range
start_date = input(title="Start Date", type=input.integer, defval=1, minval=1, maxval=31, group="Date Range")
start_month = input(title="Start Month", type=input.integer, defval=1, minval=1, maxval=12, group="Date Range")
start_year = input(title="Start Year", type=input.integer, defval=1804, minval=1800, maxval=3000, group="Date Range")
end_date = input(title="End Date", type=input.integer, defval=1, minval=1, maxval=3, group="Date Range")
end_month = input(title="End Month", type=input.integer, defval=1, minval=1, maxval=12, group="Date Range")
end_year = input(title="End Year", type=input.integer, defval=2077, minval=1800, maxval=3000, group="Date Range")
in_date_range = (time >= timestamp(syminfo.timezone, start_year, start_month, start_date, 0, 0)) and (time < timestamp(syminfo.timezone, end_year, end_month, end_date, 0, 0))


//// Indicator Inputs
// Lazy Bear's Momentum Indicator
BlueWave = linreg(close - avg(avg(highest(high, 20), lowest(low, 20)), sma(close, 20)), 20, 0)

// Replicated version of Crypto Face's MFI Indicator
mfiUpper = sum(volume * (change(hlc3) <= 0 ? 0 : hlc3), 58)
mfiLower = sum(volume * (change(hlc3) >= 0 ? 0 : hlc3), 58)
_mfiRsi(mfiUpper, mfiLower) =>
    if mfiLower == 0
        100
    if mfiUpper == 0
        0
	100.0 - (100.0 / (1.0 + mfiUpper / mfiLower))

mf = _mfiRsi(mfiUpper, mfiLower)
mfi = (mf - 50) * 3


//// Strategy
// Creating Long and Short Strategy
buy_signal = crossover(BlueWave, 0) and mfi > 0
sell_signal = crossunder(BlueWave, 0) and mfi < 0

// Long Strategy
if buy_signal and in_date_range and enable_long_strategy == true
    strategy.entry("Long", true, when=buy_signal, alert_message="Open Long Position")
    strategy.exit("Long  SL/TP", from_entry="Long", loss=long_stoploss_percentage, profit=long_takeprofit_percentage, alert_message="Your Long SL/TP Limit As Been Triggered.")
    strategy.close("Long", when=sell_signal, alert_message="Close Long Position")

// Short Strategy
if sell_signal and in_date_range and enable_short_strategy == true
    strategy.entry("Short", false, when = sell_signal, alert_message="Open Short Position")
    strategy.exit("Short SL/TP", from_entry="Short", loss=short_stoploss_percentage, profit=short_takeprofit_percentage, alert_message="Your Short SL/TP Limit As Been Triggered.")
    strategy.close("Short", when=buy_signal, alert_message="Close Short Position")
Detail
https://www.fmz.com/strategy/432095
Last Modified
2023-11-14 14:04:24