
20 KiB
Name
量化交易精准多空策略Fibonacci-Zone-DCA-Strategy
Author
ChaoZhang
Strategy Description
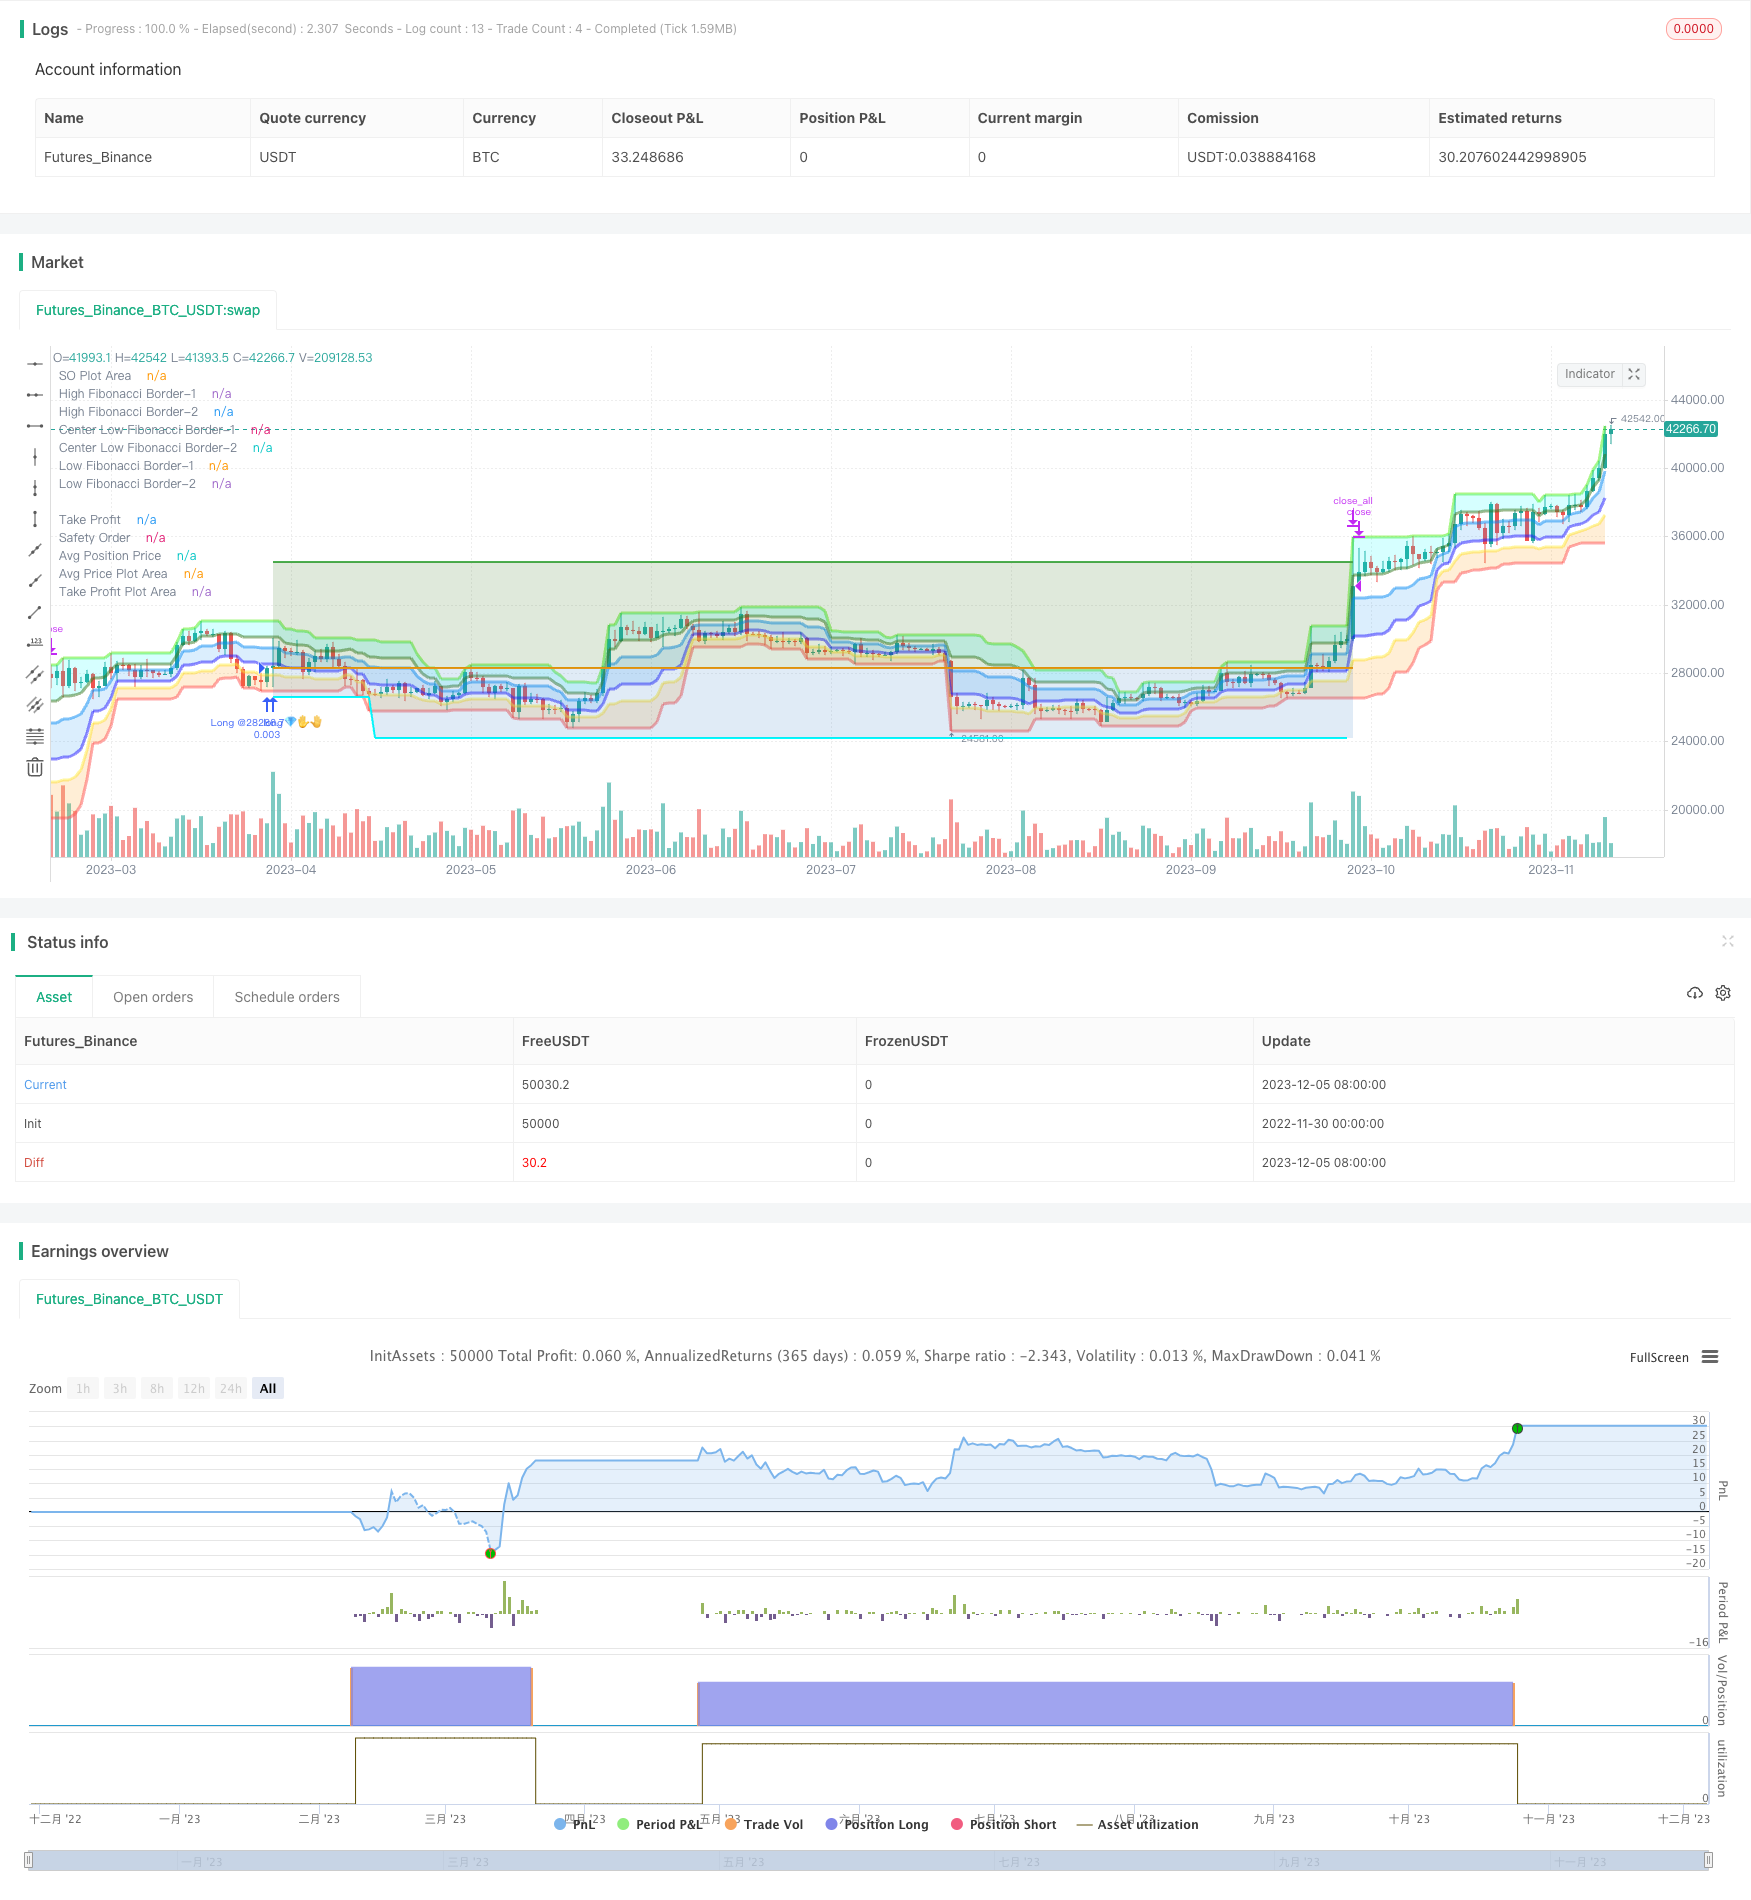
[trans]
概述
本文主要介绍了一个基于布林通道、ADX指标结合K线进行多空判断的量化交易策略。该策略采用布林通道判断市场趋势和波动性,并结合ADX指标判断市场趋势强弱,在强劲趋势市场选择方向做多做空,在震荡行情则盘整观望,最大程度规避风险。
策略原理
-
- 根据布林通道上下轨判断市场趋势方向。价格位于上轨之上为多头行情,位于下轨之下为空头行情。
-
- 布林通道带宽度反映了市场波动性和风险。布林带越宽表示市场越震荡,风险越大,这时应避免建仓。
-
- ADX指标判断市场趋势强弱。ADX值大于25时表示趋势行情,这时判断布林通道方向选择建仓方向。ADX小于25时表示震荡行情,这时应避免交易。
-
- 在决定做多做空方向后,根据ATR指标设定止损位。ATR用于衡量市场波动幅度,根据ATR倍数设置止损距离。
-
- 止盈根据布林上下轨来设置。多头止盈为下轨,空头止盈为上轨。或者根据ATR指标的ATR倍数来设置固定止盈距离。
-
- 在止损位和止盈位之间进行盈亏管理,设置移动止损来锁定盈利。
策略优势
-
结合布林通道和ADX指标判断方向,能清晰判断多空并进行选择性建仓,避免在震荡行情无谓交易。
-
利用布林带宽度判断波动率风险,布林带收窄时机会高但风险也小。布林带变宽时避免交易。
-
ATR止损设置让风险可控,最大程度避免止损被追杀。
-
根据布林通道设置止盈位,没有止盈追高止盈追低的风险。
-
移动止盈在盈利后及时止盈确保利润,并继续跟踪趋势运行。
策略风险
-
布林通道和ADX指标都存在压力的可能性。如果出现背离则可能造成错误判断。
-
ATR指标仅能反映历史波动,无法预测未来波动。实际止损被追的风险仍存在。
-
布林通道区域划分主观,可能出现漏掉机会的情况。
-
移动止损只能在盘中进行,存在间隔期无法移动的风险。
-
回测数据拟合风险。真实市场中难以复制测试报告。
策略优化
-
整合更多指标进行互信,避免布林通道和ADX指标出现虚假信号。
-
ATR止损可再加入跳空止损。或者利用深度学习算法预测市场波动设置止损。
-
优化布林通道的通道参数,使其能拥抱更大的行情机会。
-
利用更高效的程序化交易系统进行无人值守移动止损。
-
在更长的时间周期和更多品种组合进行回测,确保策略稳健性。
总结
本策略整合布林通道、ADX指标等多个指标信号,在判断明确趋势方向后进行选择性建仓,并采用ATR指标优化止损止盈设置,最大限度控制风险与盈利比,是一个值得推荐的量化交易策略。我们看到该策略还有很多可优化的空间,期待未来迭代版本的产出。
||
Overview
This article mainly introduces a quantitative trading strategy based on Fibonacci Zones and DCA setup with ADX indicators. The strategy uses Fibonacci Zones to determine trend and volatility, combines with ADX indicators to measure trend strength, enters trades following the major trend direction in strong trending markets, avoids trading in sideways markets, to maximize profits while minimizing risks.
Principles
-
- Uses Fibonacci Zones formed with Donchian Channels to determine market trend direction. The zones divide into uptrend, ranging and downtrend zones.
-
- Uses ADX and DI indicators to measure trend strength and direction. ADX above 25 indicates a trending market.
-
- Enters long trades when price breaks into uptrend Fibonacci zone according to trend strength and direction. Add subsequent safety orders to average down.
-
- Sets initial stop loss based on entry price and safety order formula. Moves stop loss up to lock in profits.
-
- Exits strategy with profit target by percentage or touching price levels related to Fibonacci zone borders.
Advantages
-
Captures big trending moves while avoiding whipsaws in choppy markets.
-
Fibonacci zones work as dynamic support/resistance levels to identify turning points.
-
DCA allows better entries and maximizes profit potential from trends.
-
ADX gauges trend strength to avoid bad trades. DI shows bullish/bearish bias.
-
All components like TP, SO and SL prices update dynamically and automatically.
Risks
-
ADX and DI can give false signals without additional indicator confirmation.
-
Areas in Fibonacci zones are subjective and may miss opportunities.
-
DCA fails if the price trends strongly against position before SO triggered.
-
Trail stop or profit target may exit before reaching full potential.
-
Backtest bias and curve fitting risks may not replicate live performance.
Enhancements
-
Add more indicators like RSI, stochastics to confirm signals.
-
Optimize ADX and Fibonacci input parameters for better performance.
-
Experiment with more intelligent trailing stop loss algorithms.
-
Expand testing on more symbols and timeframes to ensure robustness.
-
Use machine learning predictions for dynamic stop loss and take profit.
Conclusion
This strategy combines Fibonacci statistics and indicators like ADX for identifying high probability setups to go long or avoid trading altogether. The dynamic DCA position sizing ensures good entries while managing risks. With further optimizations, it has the potential to be a robust mechanical trading system. We look forward to more advanced versions in future.
[/trans]
Strategy Arguments
| Argument | Default | Description |
|---|---|---|
| v_input_1 | timestamp(01 Jan 2015 00:00 +0000) | (?Date Range)Start Time |
| v_input_2 | timestamp(31 Dec 2050 23:59 +0000) | End Time |
| v_input_source_1_close | 0 | (?Trade Entry Settings)Source: close |
| v_input_3 | 14 | Fibonacci length |
| v_input_int_1 | 14 | ADX Smoothing |
| v_input_int_2 | 14 | DI Length |
| v_input_int_3 | 25 | Min ADX value to open trade |
| v_input_string_1 | 0 | Open a trade when the price moves:: 2-Higher than the top of the Downtrend Fib zone |
| v_input_bool_1 | false | Only open trades on bullish +DI (Positive Directional Index)? (off for contrarian traders) |
| v_input_int_4 | false | Min +DI value to open trade |
| v_input_int_5 | 100 | Max +DI value to open trade |
| v_input_4 | 100 | Base order |
| v_input_5 | 200 | Safety order |
| v_input_float_3 | 6 | Price deviation to open safety orders (%) |
| v_input_float_4 | 2 | Safety order volume scale |
| v_input_float_5 | 1.4 | Safety order step scale |
| v_input_6 | 5 | Max safety orders |
| v_input_string_2 | 0 | (?Trade Exit Settings)Take profit using:: Target Take Profit (%) |
| v_input_float_1 | 22 | Target Take Profit (%) |
| v_input_float_2 | false | Trailing deviation. Default= 0.0 (%) |
Source (PineScript)
/*backtest
start: 2022-11-30 00:00:00
end: 2023-12-06 00:00:00
period: 1d
basePeriod: 1h
exchanges: [{"eid":"Futures_Binance","currency":"BTC_USDT"}]
*/

// © Fibonacci Zone DCA Strategy - R3c0nTrader ver 2022-06-12
// For backtesting with 3Commas DCA Bot settings
// Thank you "eykpunter" for granting me permission to use "Fibonacci Zones" to create this strategy
// Thank you "junyou0424" for granting me permission to use "DCA Bot with SuperTrend Emulator" which I used for adding bot inputs, calculations, and strategy
//@version=5
strategy('Fibonacci Zone DCA Strategy - R3c0nTrader', shorttitle='Fibonacci Zone DCA Strategy', overlay=true )

// Strategy Inputs
// Start and End Dates
i_startTime = input(defval=timestamp('01 Jan 2015 00:00 +0000'), title='Start Time', group="Date Range")
i_endTime = input(defval=timestamp('31 Dec 2050 23:59 +0000'), title='End Time', group="Date Range")
inDateRange = true

// Fibonacci Settings
sourceInput = input.source(close, "Source", group="Trade Entry Settings")
per = input(14, title='Fibonacci length', tooltip='Number of bars to look back. Recommended for beginners to set ADX Smoothing and DI Length to the same value as this.', group="Trade Entry Settings")
hl = ta.highest(high, per)  //High Line (Border)
ll = ta.lowest(low, per)  //Low Line  (Border)
dist = hl - ll  //range of the channel
hf = hl - dist * 0.236  //Highest Fibonacci line
cfh = hl - dist * 0.382  //Center High Fibonacci line
cfl = hl - dist * 0.618  //Center Low Fibonacci line
lf = hl - dist * 0.764  //Lowest Fibonacci line

// ADX Settings
lensig = input.int(14, title="ADX Smoothing", tooltip='Fibonacci signals work best when market is trending. ADX is used to measure trend strength. Default value is 14. Recommend for beginners to match this with Fibonacci length and DI Length',minval=1, maxval=50, group="Trade Entry Settings")
len = input.int(14, minval=1, title="DI Length", tooltip='Fibonacci signals work best when market is trending. DI Length is used to calculate ADX to measure trend strength. Default value is 14. Recommend for beginners to match this with Fibonacci length and ADX Smoothing.', group="Trade Entry Settings")
adx_min = input.int(25, title='Min ADX value to open trade', tooltip='Use this to set the minium ADX value (trend strength) to open trade. 25 or higher is recommended for beginners. 0 to 20 is a weak trend. 25 to 35 is a strong trend. 35 to 45 is a very strong trend. 45 to 100 is an extremely strong trend.', group="Trade Entry Settings")
up = ta.change(high)
down = -ta.change(low)
plusDM = na(up) ? na : (up > down and up > 0 ? up : 0)
minusDM = na(down) ? na : (down > up and down > 0 ? down : 0)
trur = ta.rma(ta.tr, len)
di_plus = fixnan(100 * ta.rma(plusDM, len) / trur)
di_minus = fixnan(100 * ta.rma(minusDM, len) / trur)
sum = di_plus + di_minus
adx = 100 * ta.rma(math.abs(di_plus - di_minus) / (sum == 0 ? 1 : sum), lensig)
fib_choice = input.string("2-Higher than the top of the Downtrend Fib zone", title="Open a trade when the price moves:", options=["1-To the bottom of Downtrend Fib zone", "2-Higher than the top of the Downtrend Fib zone", "3-Higher than the bottom of Ranging Fib Zone", "4-Higher than the top of Ranging Fib Zone", "5-Higher than the bottom of Uptrend Fib Zone", "6-To the top of Uptrend Fib Zone"],
   tooltip='There are three fib zones. The options are listed from the bottom zone to the top zone. The bottom zone is the Downtrend zone; the middle zone is the Ranging zone; The top fib zone is the Uptrend zone;',
   group="Trade Entry Settings")
di_choice = input.bool(false, title="Only open trades on bullish +DI (Positive Directional Index)? (off for contrarian traders)", tooltip=
   'Default is disabled. If you want to be more selective (you want a bullish confirmation), enable this and it will only open trades when the +DI (Positive Directional Index) is higher than the -DI (Negative Directional Index). Contrarian traders (buy the dip) should leave this disabled',
   group="Trade Entry Settings")
di_min = input.int(0, title='Min +DI value to open trade',
   tooltip='Default is zero. Use this to set the minium +DI value to open the trade. Try incrementing this value if you want to be more selective and filter for more bullish moves (e.g. 20-25). For Contrarian traders, uncheck "Only open trades on bullish DI" option and set Min +DI to zero',
   group="Trade Entry Settings")
di_max = input.int(100, title='Max +DI value to open trade', tooltip='Default is 100. Use this to set the maxium +DI value to open trade. For Contrarian traders, uncheck "Only open trades on bullish DI" option and try a Max +DI value no higher than 20 or 25', group="Trade Entry Settings")
di_inrange = di_plus >= di_min and di_plus <= di_max

// Truncate function
truncate(number, decimals) =>
    factor = math.pow(10, decimals)
    int(number * factor) / factor

//Declare take_profit
take_profit = float(0.22)

// Take Profit Drop-down menu option
tp_choice = input.string("Target Take Profit (%)", title="Take profit using:", options=["Target Take Profit (%)", "High Fibonacci Border-1", "High Fibonacci Border-2"], tooltip=
   'Select how to exit your trade and take profit. Then specify below this option the condition to exit. "High Fibonacci Border-1" is the top-most Fibonacci line in the green uptrend zone. "High Fibonacci Border-2" is the bottom Fibonacci line in the green uptrend zone. You can find these lines on the "Style" tab and toggle them off/on to locate these lines for more clarity',
   group="Trade Exit Settings")
if tp_choice == "Target Take Profit (%)"
    take_profit := input.float(22.0, title='Target Take Profit (%)', step=0.5, minval=0.0, tooltip='Only used if "Target Take Profit (%)" is selected above.', group="Trade Exit Settings") / 100
    take_profit
else if tp_choice == "High Fibonacci Border-1"
    take_profit := float(hl)
    take_profit
else if tp_choice == "High Fibonacci Border-2"
    take_profit := float(hf)
    take_profit

trailing = input.float(0.0, title='Trailing deviation. Default= 0.0 (%)', step=0.5, minval=0.0, group="Trade Exit Settings") / 100
base_order = input(100.0, title='Base order', group="Trade Entry Settings")
safe_order = input(200.0, title='Safety order', group="Trade Entry Settings")
price_deviation = input.float(6.0, title='Price deviation to open safety orders (%)', step=0.25, minval=0.0, group="Trade Entry Settings") / 100
safe_order_volume_scale = input.float(2.0, step=0.5, title='Safety order volume scale', group="Trade Entry Settings")
safe_order_step_scale = input.float(1.4, step=0.1, title='Safety order step scale', group="Trade Entry Settings")
max_safe_order = input(5, title='Max safety orders', group="Trade Entry Settings")

var current_so = 0
var initial_order = 0.0
var previous_high_value = 0.0
var original_ttp_value = 0.0

// Calculate our key levels
take_profit_level = strategy.position_avg_price * (1 + take_profit)

if tp_choice == "Target Take Profit (%)"
    take_profit_level := strategy.position_avg_price * (1 + take_profit)
else
    take_profit_level := take_profit

fib_trigger = bool(false)
if fib_choice == "2-Higher than the top of the Downtrend Fib zone"
    fib_trigger := ta.crossover(sourceInput, lf)
else if fib_choice == "1-To the bottom of Downtrend Fib zone"
    fib_trigger := sourceInput <= ll
else if fib_choice == "3-Higher than the bottom of Ranging Fib Zone"
    fib_trigger := ta.crossover(sourceInput, cfl)
else if fib_choice == "4-Higher than the top of Ranging Fib Zone"
    fib_trigger := ta.crossover(sourceInput, cfh)
else if fib_choice == "5-Higher than the bottom of Uptrend Fib Zone"
    fib_trigger := ta.crossover(sourceInput, hf)
else if fib_choice == "6-To the top of Uptrend Fib Zone"
    fib_trigger := sourceInput >= hl


// If option enabled for enter trades only when DI is positive, then open trade based on user settings
if di_choice == true and strategy.position_size == 0 and sourceInput > 0 and inDateRange and fib_trigger and adx >= adx_min and di_plus > di_minus and di_inrange
    strategy.entry('Long @' + str.tostring(sourceInput)+'?✋?', strategy.long, qty=base_order / sourceInput)
    initial_order := sourceInput
    current_so := 1
    previous_high_value := 0.0
    fib_trigger := false
    original_ttp_value := 0
    original_ttp_value

// Open First Position when candle source value crosses above the 'Low Fibonacci Border-1'
else if di_choice == false and strategy.position_size == 0 and sourceInput > 0 and inDateRange and fib_trigger and adx >= adx_min and di_inrange
    strategy.entry('Long @' + str.tostring(sourceInput)+'?✋?', strategy.long, qty=base_order / sourceInput)
    initial_order := sourceInput
    current_so := 1
    previous_high_value := 0.0
    fib_trigger := false
    original_ttp_value := 0
    original_ttp_value

threshold = 0.0

if safe_order_step_scale == 1.0
    threshold := initial_order - initial_order * price_deviation * safe_order_step_scale * current_so
    threshold

else if current_so <= max_safe_order
    threshold := initial_order - initial_order * ((price_deviation * math.pow(safe_order_step_scale, current_so) - price_deviation) / (safe_order_step_scale - 1))
    threshold

else if current_so > max_safe_order
    threshold := initial_order - initial_order * ((price_deviation * math.pow(safe_order_step_scale, max_safe_order) - price_deviation) / (safe_order_step_scale - 1))
    threshold

// Average down when lowest candle value crosses below threshold
if current_so > 0 and low <= threshold and current_so <= max_safe_order and previous_high_value == 0.0
    // Trigger a safety order at the Safety Order "threshold" price
    strategy.entry('?? SO ' + str.tostring(current_so) + '@' + str.tostring(threshold), direction=strategy.long, qty=safe_order * math.pow(safe_order_volume_scale, current_so - 1) / threshold)
    current_so += 1
    current_so

// Take Profit!
// Take profit when take profit level is equal to or higher than the high of the candle
if take_profit_level <= high and strategy.position_size > 0 or previous_high_value > 0.0
    if trailing > 0.0
        if previous_high_value > 0.0
            if high >= previous_high_value
                previous_high_value := sourceInput
                previous_high_value
            else
                previous_high_percent = (previous_high_value - original_ttp_value) * 1.0 / original_ttp_value
                current_high_percent = (high - original_ttp_value) * 1.0 / original_ttp_value
                if previous_high_percent - current_high_percent >= trailing
                    strategy.close_all(comment='Close (trailing) @' + str.tostring(truncate(current_high_percent * 100, 3)) + '%')
                    current_so := 0
                    previous_high_value := 0
                    original_ttp_value := 0
                    original_ttp_value
        else
            previous_high_value := high
            original_ttp_value := high
            original_ttp_value
    else
        strategy.close_all(comment='? Close @' + str.tostring(high))
        current_so := 0
        previous_high_value := 0
        original_ttp_value := 0
        original_ttp_value

// Plot Fibonacci Areas
fill(plot(hl, title='High Fibonacci Border-1', color=color.new(#53ed0f, 50), linewidth=3), plot(hf, title='High Fibonacci Border-2', color=color.new(#38761d, 50), linewidth=3), color=color.new(#00FFFF, 80), title='Uptrend Fibonacci Zone @ 23.6%')  //uptrend zone
fill(plot(cfh, title='Center Low Fibonacci Border-1', color=color.new(#0589f4, 50), linewidth=3), plot(cfl, title='Center Low Fibonacci Border-2', color=color.new(#2018ff, 50), linewidth=3), color=color.new(color.blue, 80), title='Ranging Fibonacci Zone @ 61.8%')  // ranging zone
fill(plot(lf, title='Low Fibonacci Border-1', color=color.new(color.yellow, 50), linewidth=3), plot(ll, title='Low Fibonacci Border-2', color=color.new(color.red, 50), linewidth=3), color=color.new(color.orange, 80), title='Downtrend Fibonacci Zone @ 76.4%')  //down trend zone

// Plot TP
plot(strategy.position_size > 0 ? take_profit_level : na, style=plot.style_linebr, color=color.green, linewidth=2, title="Take Profit")

// Plot All Safety Order lines except for last one as bright blue
plot(strategy.position_size > 0 and current_so <= max_safe_order and current_so > 0 ? threshold : na, style=plot.style_linebr, color=color.new(#00ffff,0), linewidth=2, title="Safety Order")

// Plot Last Safety Order Line as Red
plot(strategy.position_size > 0 and current_so > max_safe_order ? threshold : na, style=plot.style_linebr, color=color.red, linewidth=2, title="No Safety Orders Left")

// Plot Average Position Price Line as Orange
plot(strategy.position_size > 0 ? strategy.position_avg_price : na, style=plot.style_linebr, color=color.orange, linewidth=2, title="Avg Position Price")

// Fill TP Area and SO Area
h1 = plot(strategy.position_avg_price, color=color.new(#000000,100), title="Avg Price Plot Area", display=display.none, editable=false)
h2 = plot(take_profit_level, color=color.new(#000000,100), title="Take Profit Plot Area", display=display.none, editable=false)
h3 = plot(threshold, color=color.new(#000000,100), title="SO Plot Area", display=display.none, editable=false)

// Fill TP Area and SO Area
fill(h1,h2,color=color.new(#38761d,80), title="Take Profit Plot Area")
// Current SO Area
fill(h1,h3,color=color.new(#3d85c6,80), title="SO Plot Area")
Detail
https://www.fmz.com/strategy/434575
Last Modified
2023-12-07 16:19:11