
10 KiB
Name
趋势ATR横向突破策略Honey-Trend-ATR-Breakout-Strategy
Author
ChaoZhang
Strategy Description
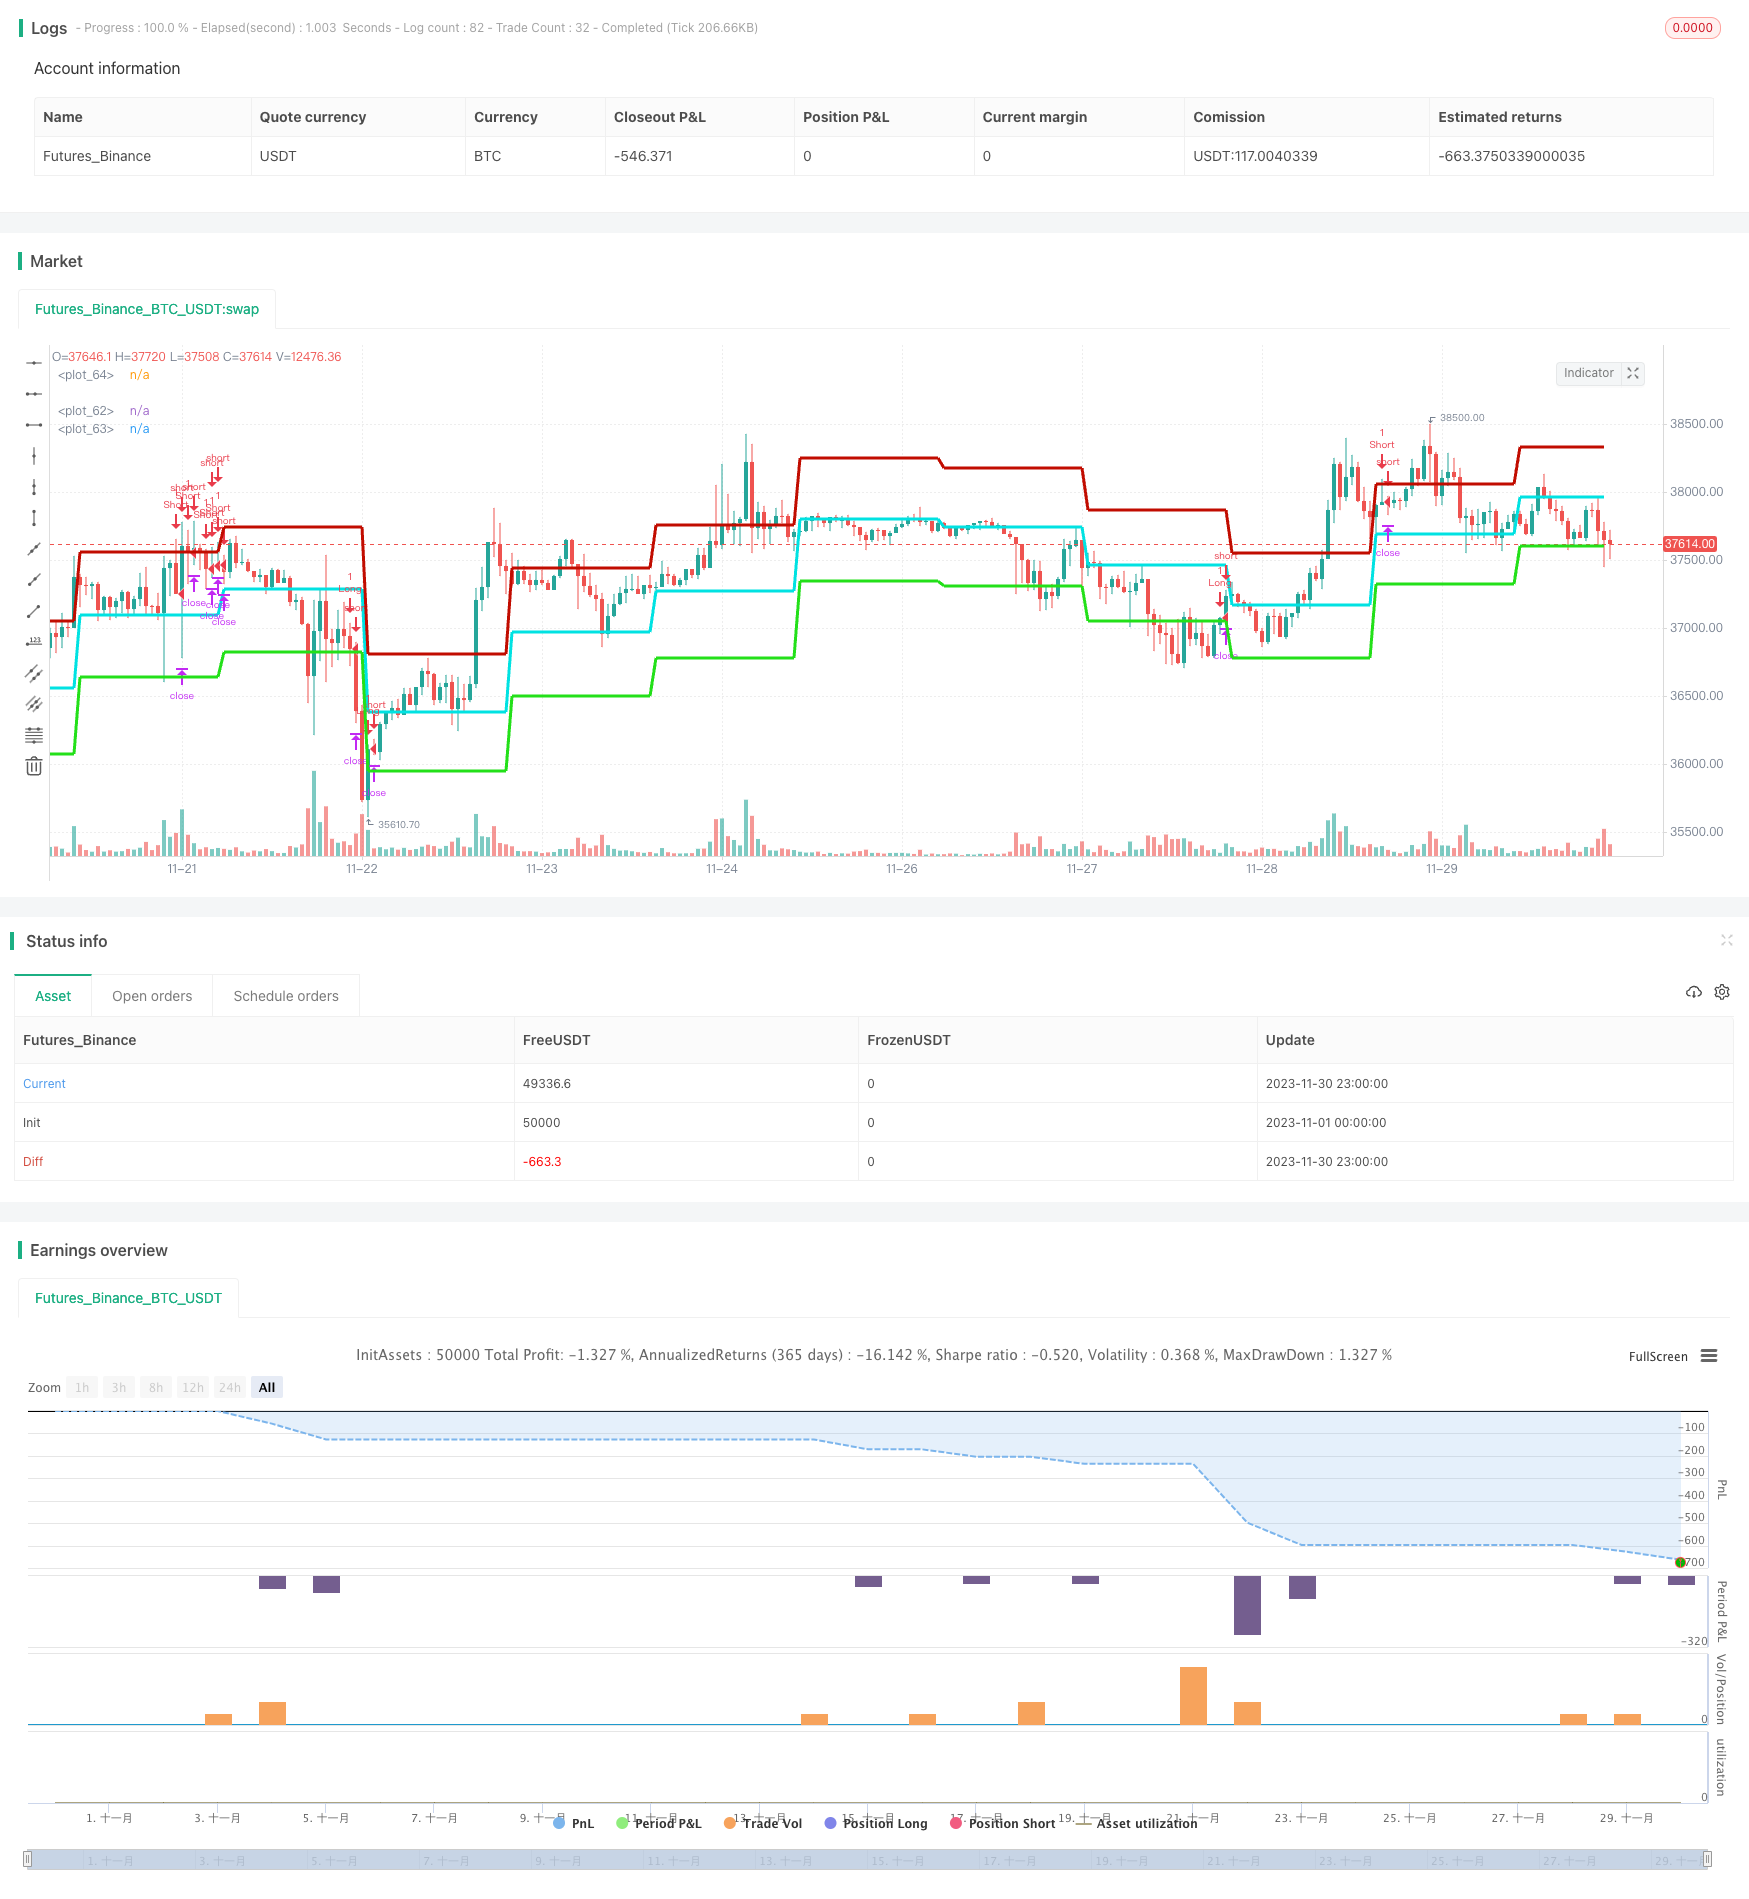 [trans]
概述
蜜蜂趋势ATR横向突破策略是一种基于ATR指标与布林带进行交易信号生成的中短线突破型策略。它主要监测股价在一定宽度的上下ATR通道内的趋势变化,在下穿下轨或上穿上轨时,结合趋势过滤进行交易决策。
策略原理
该策略主要由三部分组成:
-
ATR通道:通过ATR指标计算股价的波动范围,并以该范围上下形成通道。通道宽度通过ATR lookback周期和ATRdivisor因子控制。
-
蜜蜂线:以股价中枢线为基准线。中枢线计算方法为:昨日高低收的平均值。
-
趋势过滤:通过离差动向指标计算价格趋势,并设定信号周期,当 pricesig '>': pricesig[3] 时为趋势向上,当 pricesig '<' pricesig[3]时为趋势向下。
具体交易信号生成逻辑为:
多头信号: pricesig > pricesig[3] 且 价格下穿下轨 时做多;
空头信号: pricesig < pricesig[3] 且 价格上穿上轨 时做空;
其他情况无交易。
该策略同时设定止盈止损条件,以控制交易风险。
优势分析
蜜蜂趋势ATR突破策略具有如下优势:
-
采用ATR指标计算股价波动范围,能动态捕捉市场变化;
-
结合中枢线评估股价横盘并设置通道突破交易点,避免追高杀跌;
-
离差动向指标进行趋势判断,避免逆势交易,提高胜率;
-
设置止盈止损条件控制单笔风险;
-
策略参数设定灵活,可调整通道宽度、ATR周期等因素优化策略。
风险分析
该策略也存在一定风险:
-
中短线交易波动大,风险相对较高,需要谨慎资金管理;
-
股价剧烈波动时,ATR通道范围计算可能不准,容易造成错误交易;
-
离差动向指标对趋势判断也可能犯错,从而影响交易信号的准确性。
针对以上风险,可通过适当调整ATR通道参数、加大趋势过滤信号周期等方式进行优化和改进。
优化方向
该策略可从以下几个方面进行优化:
-
调整ATR通道宽度,降低或提高参数atrDivisor,压缩或放大通道范围。
-
调整ATR lookback周期参数,改变通道对最近波动的敏感度。
-
调整趋势信号周期参数,改善多空趋势判断的准确性。
-
加入其他指标进行多因子验证,提高交易信号质量。
-
优化止盈止损算法,改进风险控制。
总结
蜜蜂趋势ATR突破策略整合运用股价波动范围分析和趋势判断指标,在捕捉市场热点的同时控制交易风险,是一种灵活度高、适应性强的量化策略。该策略可通过参数调整与信号优化不断改进,具有广阔的运用前景。
||
Overview
The Honey Trend ATR Breakout Strategy is a medium-term breakout strategy based on ATR indicator and Bollinger Bands for trading signal generation. It mainly monitors the trend changes of stock prices within a certain width of upper and lower ATR channels. When prices break through the lower or upper rail, combined with trend filtering, it makes trading decisions.
Strategy Principle
The strategy consists of three main parts:
-
ATR Channel: Calculate the fluctuation range of stock prices through ATR indicator and form a channel up and down within this range. The channel width is controlled by ATR lookback period and ATRdivisor factor.
-
Bee Line: Take the midline of stock prices as the baseline. The calculation method of midline is: the average value of yesterday's high, low and close prices.
-
Trend Filtering: Calculate the price trend through DMI indicator and set signal cycle. When pricesig '>': pricesig[3], the trend is up. When pricesig '<' pricesig[3], the trend is down.
The specific logic for generating trading signals is:
Long signal: pricesig '>' pricesig[3] and price break through the lower rail of channel.
Short signal: pricesig '<' pricesig[3] and price break through the upper rail of channel.
No trading in other situations.
The strategy also sets stop profit and stop loss conditions to control trading risks.
Advantage Analysis
The Honey Trend ATR Breakout Strategy has the following advantages:
-
Use ATR indicator to calculate the fluctuation range of stock prices, which can dynamically capture market changes;
-
Combine the midline to evaluate the sideways of stock prices and set the channel breakout trading points to avoid chasing highs and killing lows;
-
DMI indicator is used to determine the trend and avoid trading against the trend, improving the win rate;
-
Set stop profit and stop loss conditions to control the risk of single trade;
-
The strategy parameters are flexible enough to optimize the strategy by adjusting the channel width, ATR cycle and other factors.
Risk Analysis
The strategy also has some risks:
-
Medium-term trading has relatively large fluctuations and high risks. Prudent money management is required.
-
ATR channel range calculation may be inaccurate when stock prices fluctuate sharply, which easily leads to wrong trades.
-
DMI indicator may also make mistakes in trend judgment, thus affecting the accuracy of trading signals.
In response to the above risks, parameters like ATR channel can be adjusted and signal cycles can be increased for optimization and improvement.
Optimization Directions
The strategy can be optimized in the following aspects:
-
Adjust ATR channel width by modifying atrDivisor up or down to compress or expand the channel range.
-
Adjust ATR lookback cycle parameter to change the sensitivity of channel to recent fluctuations.
-
Adjust trend signal cycle parameter to improve the accuracy of bullish and bearish trend judgments.
-
Add other indicators for multi-factor verification to improve signal quality.
-
Optimize stop profit and stop loss algorithms to improve risk control.
Conclusion
The Honey Trend ATR Breakout Strategy integrates the analysis of price fluctuation range and trend judgment indicators. While capturing market hotspots, it also controls trading risks. It is a flexible and adaptable quantitative strategy. This strategy can be continuously improved through parameter adjustment and signal optimization, with broad application prospects.
[/trans]
Strategy Arguments
| Argument | Default | Description |
|---|---|---|
| v_input_1 | D | Pivot Timeframe |
| v_input_2 | D | ATR Band Timeframe (Lower timeframe = wider bands) |
| v_input_3 | 13 | ATR lookback (Lower = bands more responsive to recent price action) |
| v_input_4 | 2 | ATR divisor (Lower = wider bands) |
| v_input_5 | 2 | Momentum Period |
| v_input_6 | 20 | Slow Period |
| v_input_7 | 5 | Fast Period |
| v_input_8 | 3 | Smoothing Period |
| v_input_9 | 4 | Signal Period |
| v_input_10 | 50 | Extreme Value |
| v_input_11 | false | Take Profit (In Market MinTick Value) |
| v_input_12 | 100 | Stop Loss (In Market MinTick Value) |
Source (PineScript)
/*backtest
start: 2023-11-01 00:00:00
end: 2023-11-30 23:59:59
period: 1h
basePeriod: 15m
exchanges: [{"eid":"Futures_Binance","currency":"BTC_USDT"}]
*/

//@version=2
strategy(title="Strategy - Bobo PATR Swing", overlay=true, default_qty_type = strategy.fixed, default_qty_value = 1, initial_capital = 10000)

// === STRATEGY RELATED INPUTS AND LOGIC ===
PivottimeFrame = input(title="Pivot Timeframe",  defval="D")
ATRSDtimeFrame = input(title="ATR Band Timeframe (Lower timeframe = wider bands)",  defval="D")
len = input(title="ATR lookback (Lower = bands more responsive to recent price action)",  defval=13)
myatr = atr(len)
dailyatr = request.security(syminfo.tickerid, ATRSDtimeFrame, myatr[1])
atrdiv = input(title="ATR divisor (Lower = wider bands)", type=float, defval=2)
pivot0 = (high[1] + low[1]  + close[1]) / 3
pivot = request.security(syminfo.tickerid, PivottimeFrame, pivot0)
upperband1 = (dailyatr / atrdiv) + pivot
lowerband1 = pivot - (dailyatr / atrdiv)
middleband = pivot

// == TREND CALC ===
i1=input(2, "Momentum Period", minval=1) //Keep at 2 usually
i2=input(20, "Slow Period", minval=1)
i3=input(5, "Fast Period", minval=1)
i4=input(3, "Smoothing Period", minval=1)
i5=input(4, "Signal Period", minval=1)
i6=input(50, "Extreme Value", minval=1)
hiDif = high - high[1]
loDif = low[1] - low
uDM = hiDif > loDif and hiDif > 0 ? hiDif : 0
dDM =  loDif > hiDif and loDif > 0 ? loDif : 0
ATR = rma(tr(true), i1)
DIu = 100 * rma(uDM, i1) / ATR
DId = 100 * rma(dDM, i1) / ATR
HLM2 =  DIu - DId
DTI = (100 * ema(ema(ema(HLM2, i2), i3), i4)) /  ema(ema(ema(abs(HLM2), i2), i3), i4)
signal = ema(DTI, i5)


// === RISK MANAGEMENT INPUTS ===
inpTakeProfit   = input(defval = 0, title = "Take Profit (In Market MinTick Value)", minval = 0)
inpStopLoss     = input(defval = 100, title = "Stop Loss (In Market MinTick Value)", minval = 0)

// === RISK MANAGEMENT VALUE PREP ===
// if an input is less than 1, assuming not wanted so we assign 'na' value to disable it.
useTakeProfit   = inpTakeProfit  >= 1 ? inpTakeProfit  : na
useStopLoss     = inpStopLoss    >= 1 ? inpStopLoss    : na

// === STRATEGY - LONG POSITION EXECUTION ===
enterLong = (((low<=lowerband1) and (close >lowerband1)) or ((open <= lowerband1) and (close > lowerband1))) and (strategy.opentrades <1) and (atr(3) > atr(50)) and (signal>signal[3])
exitLong = (high > middleband)
strategy.entry(id = "Long", long = true, when = enterLong)
strategy.close(id = "Long", when = exitLong)

// === STRATEGY - SHORT POSITION EXECUTION ===
enterShort = (((high>=upperband1) and (close < upperband1)) or ((open >= upperband1) and (close < upperband1))) and (strategy.opentrades <1) and (atr(3) > atr(50)) and (signal<signal[3])
exitShort = (low < middleband)
strategy.entry(id = "Short", long = false, when = enterShort)
strategy.close(id = "Short", when = exitShort)

// === STRATEGY RISK MANAGEMENT EXECUTION ===
strategy.exit("Exit Long", from_entry = "Long", profit = useTakeProfit, loss = useStopLoss)
strategy.exit("Exit Short", from_entry = "Short", profit = useTakeProfit, loss = useStopLoss)

// === CHART OVERLAY ===
plot(upperband1, color=#C10C00, linewidth=3)
plot(lowerband1, color=#23E019, linewidth=3)
plot(middleband, color=#00E2E2, linewidth=3)
//plot(strategy.equity, title="equity", color=red, linewidth=2, style=areabr)
Detail
https://www.fmz.com/strategy/434486
Last Modified
2023-12-06 18:03:38