
17 KiB
Name
趋势跟踪短线交易策略Trend-Following-Short-term-Trading-Strategy
Author
ChaoZhang
Strategy Description
 [trans]
概述
该策略是一种基于多个指标判断趋势的短线交易策略。它综合运用了包括WOW、BMA、BarColor、SuperTrend、DI、TTS、RSI和WTO等8个指标来判断趋势方向,并以此制定买入和卖出决策。
策略原理
该策略首先计算并判断WOW、BMA、BarColor、SuperTrend、DI、TTS、RSI和WTO这8个指标的趋势方向。
WOW指标是根据价格中的实体位置来判断多空趋势的。如果实体位置接近上轨,为看涨;如果接近下轨,为看跌。
BMA指标是根据SMA多空关系来判断趋势,如果收盘价SMA上穿开盘价SMA为看涨,下穿为看跌。
BarColor指标是根据K线颜色来判断趋势,连续多个阳线为看涨,阴线为看跌。
SuperTrend指标是根据平均波动范围来判断价格趋势,价格在上轨之上为看涨,下轨之下为看跌。
DI指标是根据多空动量大小关系来判断趋势,多头动量大于空头动量为看涨,反之为看跌。
TTS指标根据价格与均线的位置关系来判断多空趋势。
RSI指标根据相对强弱指标的位置来判断趋势方向。
WTO指标根据波动性指标的多空来判断趋势方向。
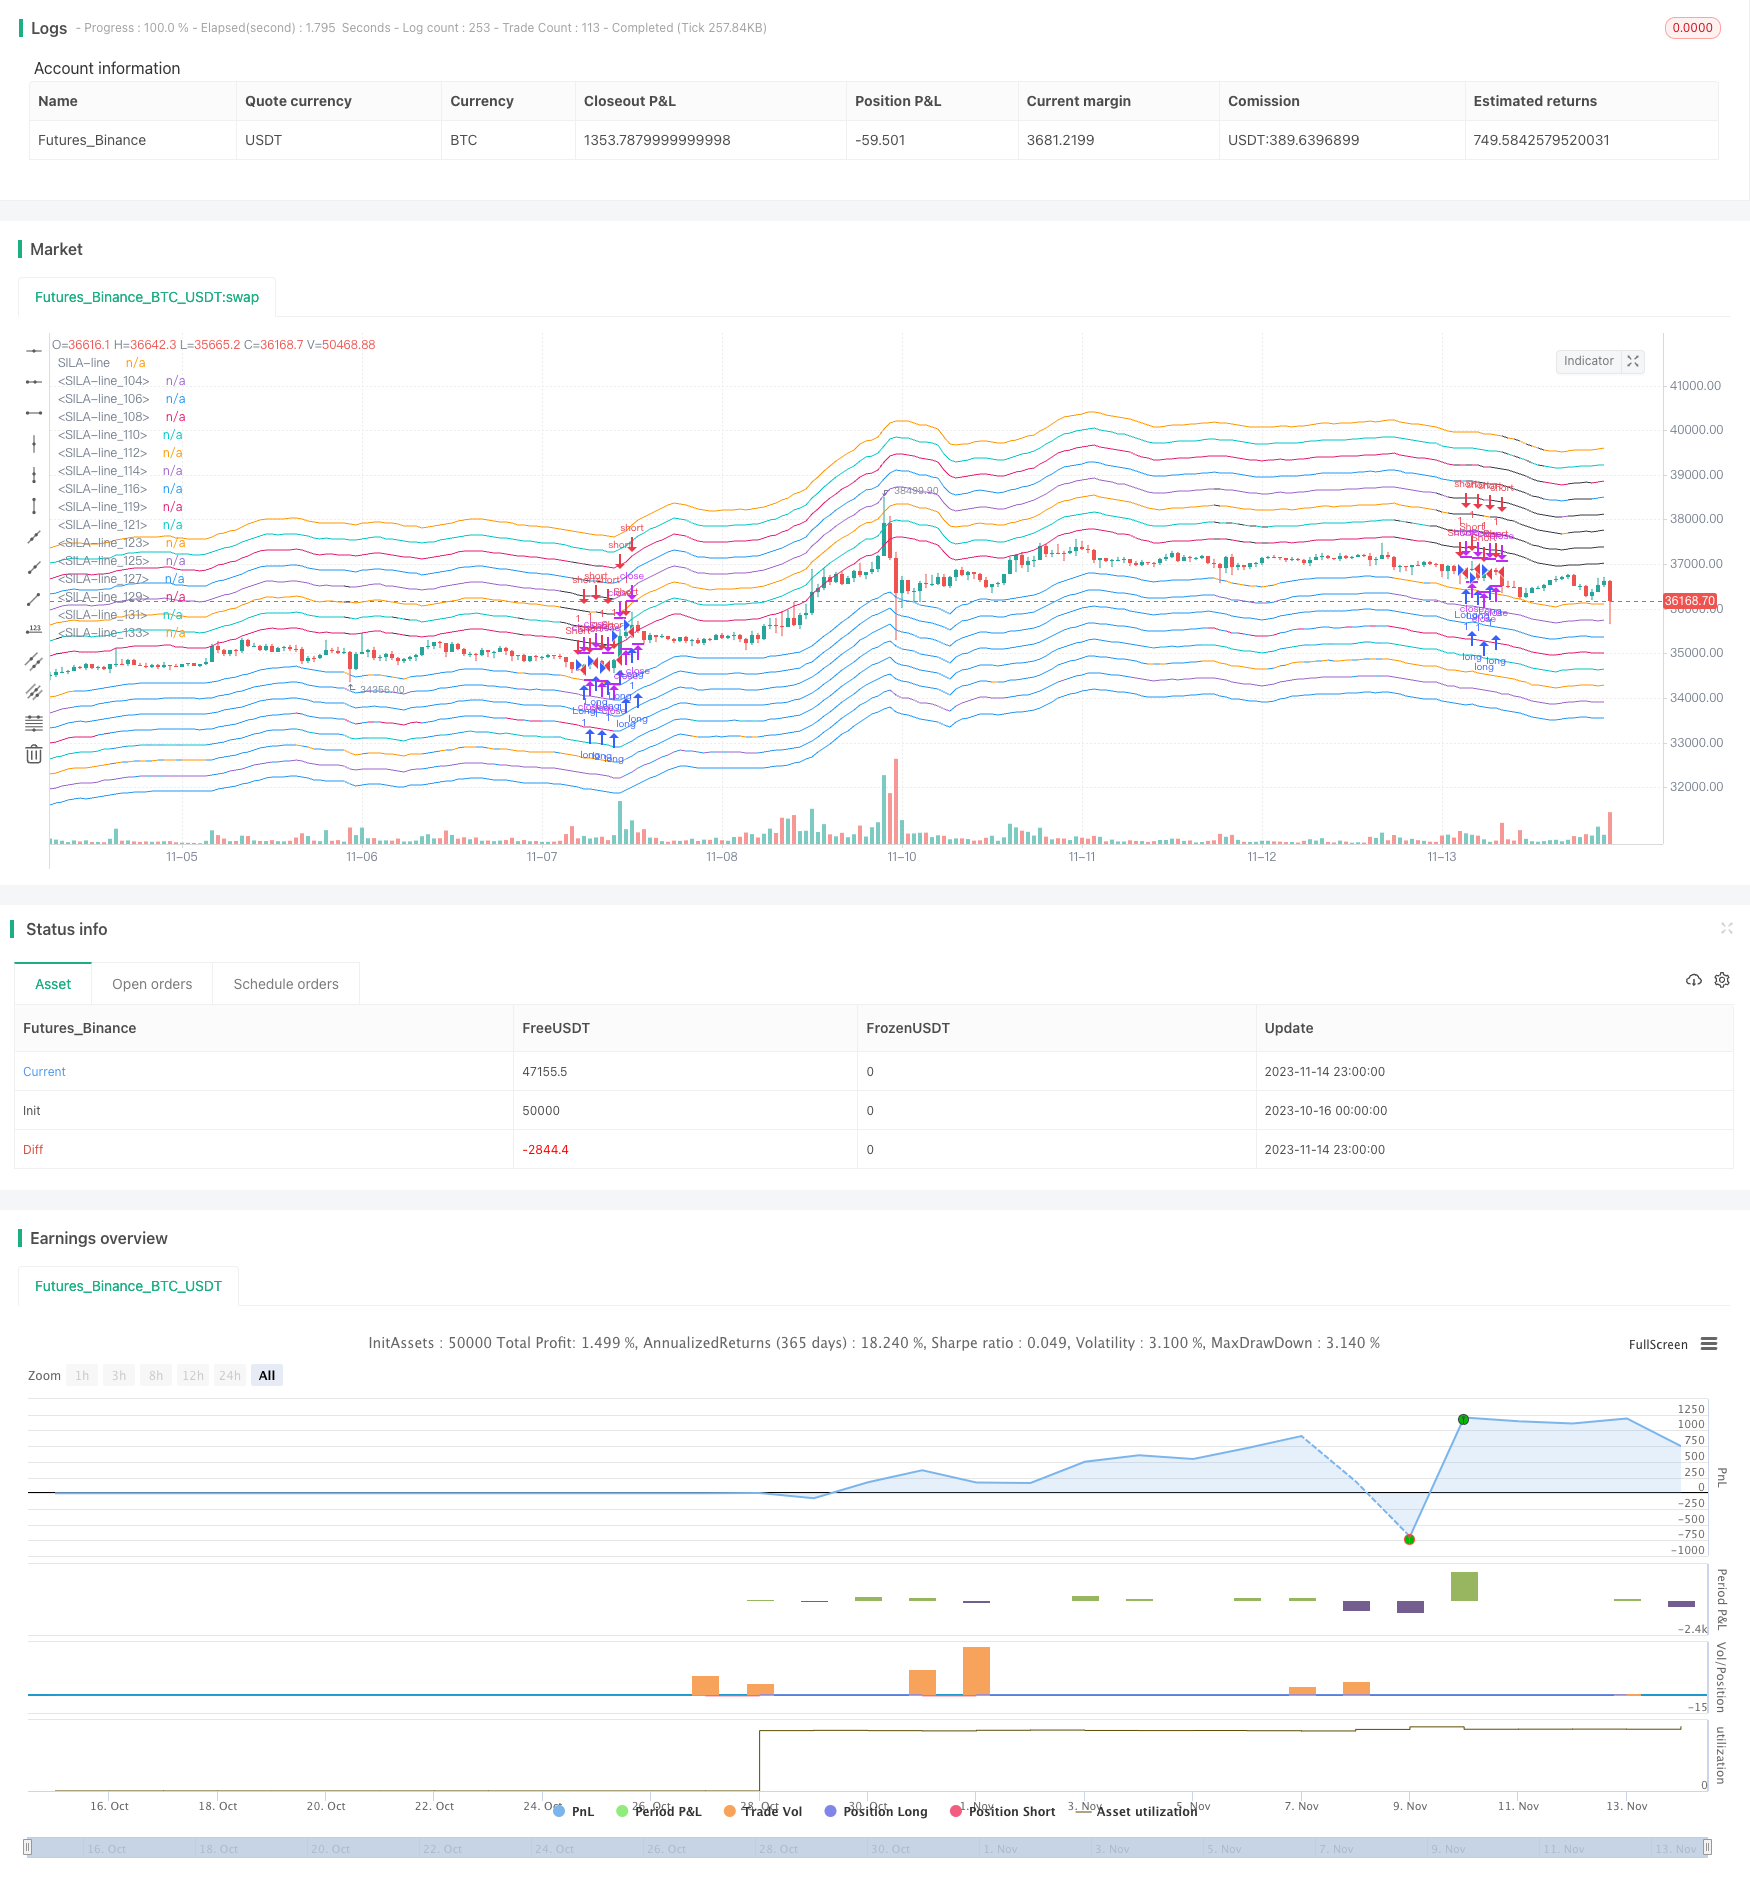
然后,该策略会统计这8个指标看涨的数量,并据此绘制分级别的SILA看涨支撑线和看跌阻力线。支撑线和阻力线的数量越多,表示趋势信号越强。
当多个指标看涨时,如果收盘价处于最低级别的支撑线之上,则产生买入信号;当多个指标看跌时,如果收盘价处于最低级别的阻力线之下,则产生卖出信号。
此外,该策略还会利用K线形态来判断短期回调的机会,在趋势反转时寻找更有利的进场点。
策略优势
- 综合多个指标判断趋势,提高判断准确率
该策略不依赖单一指标,而是综合运用8个常用的趋势判断指标,对趋势进行多方位判定,可以提高判断的准确性和可靠性。
- SILA系统绘制分级支撑阻力,识别趋势信号强弱
该策略基于多个指标的看涨看跌信号,采用SILA系统绘制多个分级别的支撑线和阻力线。线的数量越多表示趋势信号越强。这可以帮助交易者进一步识别信号的强弱。
- 结合K线形态寻找回调机会,进场点更优
该策略不仅依据趋势指标判断方向,还会结合K线形态来寻找短期回调的机会,在趋势反转点进场,可以争取到更优的入场点位。
策略风险
- 多个指标之间可能出现分歧
本策略采用多个指标,这些指标之间在某些情况下可能会出现判断分歧的情况,需要交易者自己权衡,增加了决策难度。
- 指标参数设置可能需要优化
本策略中诸多指标都采用了默认参数,实际应用时可能需要对参数进行优化,以取得最佳效果。
- 系统性风险需要考虑
如遇到重大黑天鹅事件,系统性风险会导致正常的技术指标失效,需要注意评估市场系统性风险。
- 回撤风险
跟随趋势而交易回撤在扩大阶段可能比较大,需要注意控制单笔交易规模以限制回撤。
策略优化方向
- 对指标参数进行测试优化
可以通过更系统的方法对各个指标的参数如周期长度、数值大小等进行优化,寻找最佳参数组合。
- 增加止损方式
可以考虑增加移动止损或者百分比止损来控制回撤。
- 结合量能指标
可以引入像MAVP、OBV等量能指标与趋势指标进行组合,提高战术决策的准确性。
- 优化仓位管理
可以研究不同市场阶段的持仓比例,以便在趋势更明朗时加大仓位。
总结
本策略Overall是一种多指标跟踪趋势的短线交易策略。它综合运用多个指标判断趋势方向,采用SILA系统识别信号强度,并辅以K线形态优化入场。该策略可以提高判断准确率,但需要注意不同指标的分歧风险。下一步可以通过参数优化、止损优化、量能结合等方法进一步改进该策略。
||
Overview
This strategy is a short-term trading strategy that identifies trend based on multiple indicators. It combines 8 indicators including WOW, BMA, BarColor, SuperTrend, DI, TTS, RSI and WTO to determine the trend direction and make trading decisions accordingly.
Strategy Logic
The strategy first calculates and judges the trend direction of the 8 indicators - WOW, BMA, BarColor, SuperTrend, DI, TTS, RSI and WTO.
The WOW indicator judges bullish or bearish trend based on the body location. Body near upper band indicates bullish while body near lower band indicates bearish.
The BMA indicator judges trend by the relationship between SMA of open and close. Close SMA crossing above Open SMA indicates bullish while crossing below indicates bearish.
The BarColor indicator judges trend by the color of candlesticks. Continuous yellow candles suggest bullish while black candles suggest bearish.
The SuperTrend indicator judges trend based on the price location versus the average range. Price above upper band indicates bullish while price below lower band indicates bearish.
The DI indicator judges trend by the relationship between positive and negative directional movement. Positive DI greater than Negative DI suggests bullish while vice versa suggests bearish.
The TTS indicator judges trend based on the price location versus moving average.
The RSI indicator judges trend direction based on the level of relative strength index.
The WTO indicator judges trend direction based on the wave trend oscillator.
The strategy then counts the number of bullish signals from the 8 indicators and plots the SILA support and resistance lines accordingly. More lines indicate stronger trend signal.
When multiple indicators suggest bullish, buying signal is generated when close is above the lowest support line. When multiple indicators suggest bearish, selling signal is generated when close is below the lowest resistance line.
In addition, the strategy also utilizes candlestick patterns to find pullback opportunities and improve entry points.
Advantages of the Strategy
- Combining multiple indicators improves accuracy
The strategy uses 8 common trend indicators to determine the trend from multiple aspects, thus improving the accuracy and reliability of trend judgment.
- SILA system identifies strength of signals
The SILA support/resistance lines reflect the number of bullish/bearish signals. More lines indicate stronger signals. This helps traders to further evaluate the strength of trading signals.
- Candlestick patterns improve entry points
The strategy seeks pullback opportunities based on candlestick patterns to find better entry points when trend reverses.
Risks of the Strategy
- Potential conflicts between indicators
The multiple indicators may sometimes generate conflicting signals, making decision-making more difficult.
- Parameters may require optimization
The default parameters may not be optimal. Further optimization may be needed to achieve the best results.
- Consider systemic risks
Black swan events may invalidate normal technical signals. Market systemic risks should be evaluated.
- Drawdown risk
Following the trend may result in larger drawdowns during market corrections. Trade size should be managed to limit drawdown.
Enhancement of the Strategy
- Optimize indicator parameters
Systematically test and optimize parameters like period and value levels to find the optimal parameter combination.
- Add stop loss methods
Consider adding moving or percentage stop loss to control drawdowns.
- Incorporate volume indicators
Combine trend indicators with volume indicators like MAVP and OBV to improve tactic decisions.
- Manage position sizing
Research optimal position sizes for different market stages, and size up when trend becomes more apparent.
Conclusion
In summary, this is a multi-indicator trend following short-term trading strategy. It determines trend direction using multiple indicators and identifies strength of signals with the SILA system, supplemented by candlestick patterns for entry improvements. The strategy can improve accuracy but the risk of conflicting signals should be noted. Further improvements can be made through parameter optimization, stop loss optimization, volume incorporation etc.
[/trans]
Strategy Arguments
| Argument | Default | Description |
|---|---|---|
| v_input_1 | 5 | Uptrend-sensivity |
| v_input_2 | 5 | Downtrend-sensivity |
| v_input_3 | true | Use trend-indicator WOW? |
| v_input_4 | true | Use trend-indicator BestMA? |
| v_input_5 | true | Use trend-indicator BarColor? |
| v_input_6 | true | Use trend-indicator SuperTrend? |
| v_input_7 | true | Use trend-indicator DI? |
| v_input_8 | true | Use trend-indicator TTS? |
| v_input_9 | true | Use trend-indicator RSI? |
| v_input_10 | true | Use trend-indicator WTO? |
| v_input_11 | 100 | Distance SILA-lines |
| v_input_12 | true | Need SILA-lines? |
| v_input_13 | true | Need uptrend-background? |
| v_input_14 | true | Need downtrend-background? |
| v_input_15 | true | Need background always? |
| v_input_16 | true | Need new-trend-arrows? |
| v_input_17 | true | Need locomotive-arrows? |
| v_input_18 | true | Need money? |
Source (PineScript)
/*backtest
start: 2023-10-16 00:00:00
end: 2023-11-15 00:00:00
period: 1h
basePeriod: 15m
exchanges: [{"eid":"Futures_Binance","currency":"BTC_USDT"}]
*/

// (c) Noro
//2017

//@version=2

strategy(title="Noro's SILA v1.6L Strategy", shorttitle="SILA v1.6L str", overlay=true)

//settings
sensup = input(5, title="Uptrend-sensivity", minval = -8, maxval = 8)
sensdn = input(5, title="Downtrend-sensivity", minval = -8, maxval = 8)
usewow = input(true, title="Use trend-indicator WOW?")
usebma = input(true, title="Use trend-indicator BestMA?")
usebc = input(true, title="Use trend-indicator BarColor?")
usest = input(true, title="Use trend-indicator SuperTrend?")
usedi = input(true, title="Use trend-indicator DI?")
usetts = input(true, title="Use trend-indicator TTS?")
usersi = input(true, title="Use trend-indicator RSI?")
usewto = input(true, title="Use trend-indicator WTO?")
dist = input(100, title="Distance SILA-lines", minval = 0, maxval = 100)
usetl = input(true, title="Need SILA-lines?")
usebgup = input(true, title="Need uptrend-background?")
usebgdn = input(true, title="Need downtrend-background?")
usealw = input(true, title="Need background always?")
usearr = input(true, title="Need new-trend-arrows?")
useloco = input(true, title="Need locomotive-arrows?")
usemon = input(true, title="Need money?") //joke

// WOW 1.0 method
lasthigh = highest(close, 30)
lastlow = lowest(close, 30)
center = (lasthigh +lastlow) / 2
body = (open + close) / 2
trend1 = body > center ? 1 : body < center ? -1 : trend1[1]
trend2 = center > center[1] ? 1 : center < center[1] ? -1 : trend2[1]
WOWtrend = usewow == true ? trend1 == 1 and trend2 == 1 ? 1 : trend1 == -1 and trend2 == -1 ? -1 : WOWtrend[1] : 0

// BestMA 1.0 method
SMAOpen = sma(open, 30)
SMAClose = sma(close, 30)
BMAtrend = usebma == true ? SMAClose > SMAOpen ? 1 : SMAClose < SMAOpen ? -1 : BMAtrend[1] : 0

// BarColor 1.0 method
color = close > open ? 1 : 0
score = color + color[1] + color[2] + color[3] + color[4] + color[5] + color[6] + color[7]
BARtrend = usebc == true ? score > 5 ? 1 : score < 3 ? -1 : BARtrend[1] : 0

// SuperTrend mehtod
Up = hl2 - (7 * atr(3))
Dn = hl2 + (7 * atr(3))
TrendUp = close[1] > TrendUp[1] ? max(Up, TrendUp[1]) : Up
TrendDown = close[1] < TrendDown[1] ? min(Dn, TrendDown[1]) : Dn
SUPtrend = usest == true ? close > TrendDown[1] ? 1: close < TrendUp[1]? -1 : SUPtrend[1] : 0

//DI method
th = 20
TrueRange = max(max(high-low, abs(high-nz(close[1]))), abs(low-nz(close[1])))
DirectionalMovementPlus = high-nz(high[1]) > nz(low[1])-low ? max(high-nz(high[1]), 0): 0
DirectionalMovementMinus = nz(low[1])-low > high-nz(high[1]) ? max(nz(low[1])-low, 0): 0
SmoothedTrueRange = nz(SmoothedTrueRange[1]) - (nz(SmoothedTrueRange[1])/14) + TrueRange
SmoothedDirectionalMovementPlus = nz(SmoothedDirectionalMovementPlus[1]) - (nz(SmoothedDirectionalMovementPlus[1])/14) + DirectionalMovementPlus
SmoothedDirectionalMovementMinus = nz(SmoothedDirectionalMovementMinus[1]) - (nz(SmoothedDirectionalMovementMinus[1])/14) + DirectionalMovementMinus
DIPlus = SmoothedDirectionalMovementPlus / SmoothedTrueRange * 100
DIMinus = SmoothedDirectionalMovementMinus / SmoothedTrueRange * 100
DItrend = usedi == true ? DIPlus > DIMinus ? 1 : -1 : 0

//TTS method (Trend Trader Strategy)
//Start of HPotter's code
//Andrew Abraham' idea
avgTR      = wma(atr(1), 21)
highestC   = highest(21)
lowestC    = lowest(21)
hiLimit = highestC[1]-(avgTR[1] * 3)
loLimit = lowestC[1]+(avgTR[1] * 3)
ret = iff(close > hiLimit and close > loLimit, hiLimit, iff(close < loLimit and close < hiLimit, loLimit, nz(ret[1], 0)))
pos =	iff(close > ret, 1, iff(close < ret, -1, nz(pos[1], 0)))
//End of HPotter's code

TTStrend = usetts == true ? pos == 1 ? 1 : pos == -1 ? -1 : TTStrend[1] : 0

//RSI method
RSIMain = (rsi(close, 13) - 50) * 1.5
rt = iff(RSIMain > -10, 1, iff(RSIMain < 10, -1, nz(pos[1], 0)))
RSItrend = usersi == true ? rt : 0

//WTO ("WaveTrend Oscilator") method by LazyBear
//Start of LazyBear's code
esa = ema(hlc3, 10)
d = ema(abs(hlc3 - esa), 10)
ci = (hlc3 - esa) / (0.015 * d)
tci = ema(ci, 21)
//End of LazyBear's code

WTOtrend = usewto == true ? tci > 0 ? 1 : tci < 0 ? -1 : 0 : 0

//plots
trends = usemon == true ? WOWtrend + BMAtrend + BARtrend + SUPtrend + DItrend + TTStrend + RSItrend + WTOtrend: -1 * (WOWtrend + BMAtrend + BARtrend + SUPtrend + DItrend + TTStrend + RSItrend + WTOtrend)
pricehi = sma(high, 10)
pricelo = sma(low, 10)
per = usetl == 1 ? dist / 10000 : 0

color1 = usetl == true ? trends > 0 ? blue : na : na
plot(pricelo * (1 - per), color=color1, linewidth=1, title="SILA-line")
color2 = usetl == true ? trends > 1 ? blue : na : na
plot(pricelo * (1 - 2 * per), color=color2, linewidth=1, title="SILA-line")
color3 = usetl == true ? trends > 2 ? blue : na : na
plot(pricelo * (1 - 3 * per), color=color3, linewidth=1, title="SILA-line")
color4 = usetl == true ? trends > 3 ? blue : na : na
plot(pricelo * (1 - 4 * per), color=color4, linewidth=1, title="SILA-line")
color5 = usetl == true ? trends > 4 ? blue : na : na
plot(pricelo * (1 - 5 * per), color=color5, linewidth=1, title="SILA-line")
color6 = usetl == true ? trends > 5 ? blue : na : na
plot(pricelo * (1 - 6 * per), color=color6, linewidth=1, title="SILA-line")
color7 = usetl == true ? trends > 6 ? blue : na : na
plot(pricelo * (1 - 7 * per), color=color7, linewidth=1, title="SILA-line")
color8 = usetl == true ? trends > 7 ? blue : na : na
plot(pricelo * (1 - 8 * per), color=color8, linewidth=1, title="SILA-line")

color10 = usetl == true ? trends < 0 ? black : na : na
plot(pricehi * (1 + per), color=color10, linewidth=1, title="SILA-line")
color11 = usetl == true ? trends < -1 ? black : na : na
plot(pricehi * (1 + 2 * per), color=color11, linewidth=1, title="SILA-line")
color12 = usetl == true ? trends < -2 ? black : na : na
plot(pricehi * (1 + 3 * per), color=color12, linewidth=1, title="SILA-line")
color13 = usetl == true ? trends < -3 ? black : na : na
plot(pricehi * (1 + 4 * per), color=color13, linewidth=1, title="SILA-line")
color14 = usetl == true ? trends < -4 ? black : na : na
plot(pricehi * (1 + 5 * per), color=color14, linewidth=1, title="SILA-line")
color15 = usetl == true ? trends < -5 ? black : na : na
plot(pricehi * (1 + 6 * per), color=color15, linewidth=1, title="SILA-line")
color16 = usetl == true ? trends < -6 ? black : na : na
plot(pricehi * (1 + 7 * per), color=color16, linewidth=1, title="SILA-line")
color17 = usetl == true ? trends < -7 ? black : na : na
plot(pricehi * (1 + 8 * per), color=color17, linewidth=1, title="SILA-line")

//background
col = usebgup == true and trends >= sensup ? 1 : usebgdn == true and trends <= (-1 * sensdn) ? -1 : usealw == true ? col[1] : 0
bgcolor = col == 1 ? lime : col == -1 ? red : na
//bgcolor(bgcolor, transp=70)

//arrows
posi = trends >= sensup ? 1 : trends <= (-1 * sensdn) ? -1 : posi[1]
arr = usearr == true ? posi == 1 and posi[1] < 1 ? 1 : posi == -1 and posi[1] > -1 ? -1 : na : na
//plotarrow(arr == 1 ? 1 : na, title="UpArrow", colorup=blue, maxheight=60, minheight=50, transp=0)
//plotarrow(arr == -1 ? -1 : na, title="DnArrow", colordown=blue, maxheight=60, minheight=50, transp=0)

//locomotive
bar = close > open ? 1 : close < open ? -1 : 0
locotop = bar == -1 and bar[1] == 1 and bar[2] == 1 ? 1 : 0
locobot = bar == 1 and bar[1] == -1 and bar[2] == -1 ? 1 : 0
entry = useloco == false ? 1 : posi == posi[1] ? (locotop == 1 and posi == -1) or (locobot == 1 and posi == 1) ? 1 : entry[1] : 0
//plotarrow(locobot == 1 and entry[1] == 0 and posi == 1 ? 1 : na, title="UpLocomotive", colorup=yellow, maxheight=60, minheight=50, transp=0)
//plotarrow(locotop == 1 and entry[1] == 0 and posi == -1 ? -1 : na, title="DnLocomotive", colordown=yellow, maxheight=60, minheight=50, transp=0)

longCondition = arr == 1
if (longCondition)
    strategy.entry("Long", strategy.long)

shortCondition = arr == -1
if (shortCondition)
    strategy.entry("Short", strategy.short)
Detail
https://www.fmz.com/strategy/432309
Last Modified
2023-11-16 11:11:32