
11 KiB
Name
趋势消除MACD策略Trendless-MACD-Strategy
Author
ChaoZhang
Strategy Description
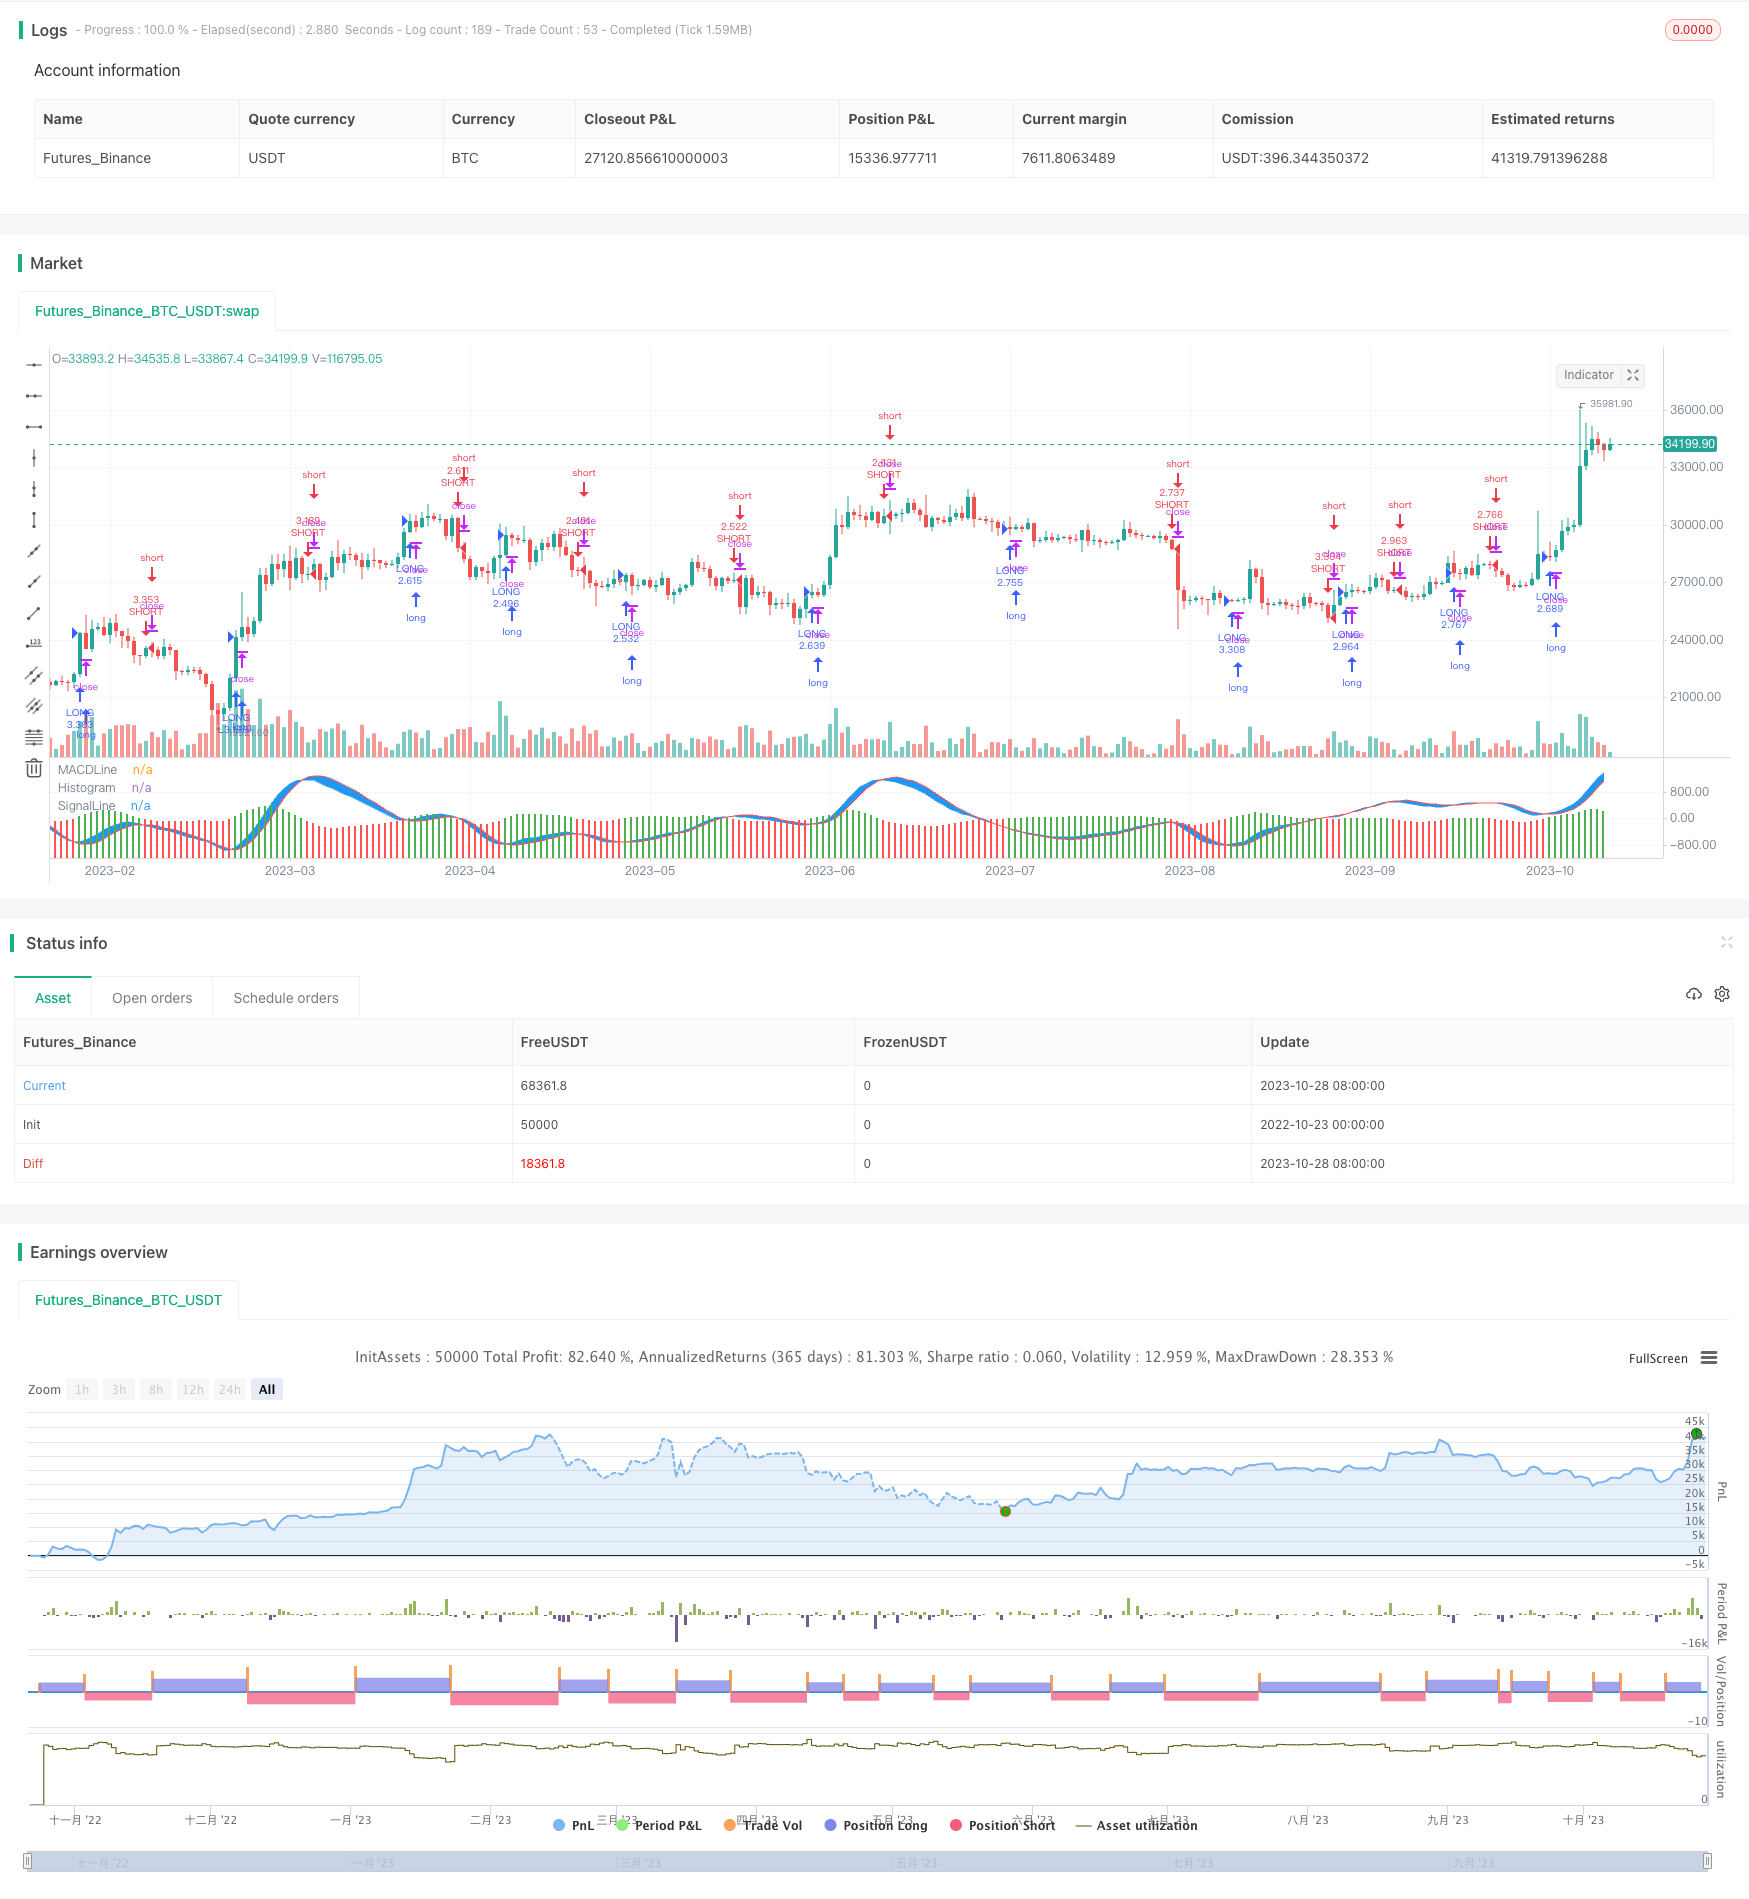
[trans]
概述
该策略采用消除股票价格的趋势,从而更清晰地观察MACD指标的形态。通过计算DEMA快线和DEMA慢线,进而得到MACD直线和信号线,判断它们的交叉来产生交易信号。该策略还结合了月份、日期的条件过滤,以及止损平仓逻辑,形成一个较为完整的策略系统。
策略原理
首先,计算价格的EMA,以消除价格的趋势,得到趋势消除后的价格EMA。然后基于EMA分别计算快线DEMA、慢线DEMA和MACD直线。其中,快线DEMA计算方法是:先计算快线的EMA1,再计算EMA1的EMA2,然后计算DEMA=(2*EMA1-EMA2)。慢线DEMA和信号线的计算同理。得到MACD直线(快线DEMA - 慢线DEMA)和信号线之后,如果MACD直线上穿信号线,产生买入信号;如果MACD直线下穿信号线,产生卖出信号。最后,结合月份、日期条件过滤信号,并设置止损逻辑。
该策略的核心逻辑是:
-
消除价格趋势,更清晰看到MACD指标形态
-
计算DEMA快线、慢线,得到MACD直线和信号线
-
MACD直线和信号线交叉产生交易信号
-
加入日期、月份条件过滤
-
设置止损逻辑
优势分析
该策略的主要优势有:
-
消除价格趋势,能更清楚看到MACD指标的交叉情况,避免被趋势误导。
-
使用DEMA算法计算MACD指标,可以过滤掉一些噪音,使信号更清晰。
-
结合日期和月份进行过滤,可以减少一些不必要的交易。
-
设置止损逻辑,可以及时止损,控制风险。
-
使用交叉产生信号,可以减少错误交易。
-
整体来说,该策略结合趋势消除、DEMA计算和条件过滤,可以产生较为清晰和可靠的交易信号。
风险分析
该策略也存在一些风险需要注意:
-
消除趋势以后,MACD交叉信号可能会增多,需要实盘验证是否可行。
-
DEMA算法虽过滤了部分噪音,但指标计算还是可能出现较多假信号。
-
日期和月份过滤条件可能过于死板,错过了一些交易机会。
-
止损位置设置需要考虑是否合理,过于宽松会增加风险,过于严格会频繁止损。
-
该策略主要依靠MACD指标,如果市场不适合使用该指标,效果可能会受到影响。
-
策略参数优化空间还很大,需要通过回测和实盘进一步测试。
对策:
-
增加其他指标确认,避免假信号。
-
优化日期过滤条件,适当放宽。
-
细致测试并优化止损点位。
-
加入趋势判断机制,避免逆势交易。
-
全面回测和优化参数,提高稳定性。
优化方向
该策略可以从以下几个方面进行优化:
-
测试不同的价格平均线,寻找更合适的替代EMA的线型。
-
尝试不同的参数组合,优化MACD的快线长度、慢线长度和信号线长度。
-
增加量能指标等辅助判断指标,避免假信号。
-
优化止损策略,设置合理的移动止损或挂单止损。
-
优化日期、月份过滤条件,使其更具弹性。
-
添加趋势判断,避免逆势操作。
-
进行全面的参数优化,提高策略稳定性。
-
在更长的时间周期进行回测,检查策略的长期效果。
-
进行实盘验证,根据实盘情况进一步修改策略参数。
总结
总体来说,该策略采用消除趋势的思路,计算DEMA形式的MACD指标,并结合日期过滤产生交易信号,是一个简单但可行的策略思路。它最大的优势是可以清晰看到MACD形态,避免被价格趋势影响判断。但是该策略也存在一定的风险,需要进行参数优化和风控手段的加入,方可实际应用。该策略还有较大的优化空间,如果经过充分验证和优化,可以成为一个稳定可靠的短线策略。
||
Overview
This strategy uses the method of eliminating the trend of stock prices to observe the MACD indicator more clearly. By calculating the DEMA fast line and DEMA slow line, the MACD line and signal line are derived. Trading signals are generated by crossing between the MACD line and signal line. The strategy also incorporates date and month condition filters and stop loss logic to form a more complete system.
Strategy Logic
Firstly, the EMA of price is calculated to eliminate the price trend and obtain the detrended EMA. Then the fast line DEMA, slow line DEMA and MACD line are calculated based on EMA. The fast line DEMA is calculated by: first calculating EMA1 of the fast line, then calculating EMA2 of EMA1, and finally calculating DEMA=(2*EMA1-EMA2). The slow line DEMA and signal line are calculated similarly. After obtaining the MACD line (fast line DEMA - slow line DEMA) and the signal line, a buy signal is generated when the MACD line crosses above the signal line, and a sell signal is generated when the MACD line crosses below the signal line. Finally, combine the date and month filters, and set stop loss logic.
The core logic of this strategy is:
-
Eliminate the price trend to see the MACD indicator more clearly.
-
Calculate DEMA fast line, DEMA slow line to derive MACD line and signal line.
-
MACD line and signal line crossover generate trading signals.
-
Add date and month filters.
-
Set stop loss logic.
Advantage Analysis
The main advantages of this strategy are:
-
Eliminating the price trend can reveal the crossover situation of MACD more clearly without being misled by the trend.
-
Using DEMA algorithm to calculate MACD filters out some noise and makes the signal clearer.
-
Combining date and month filters can reduce unnecessary trades.
-
The stop loss logic can cut losses in time and control risks.
-
Using crossover to generate signals reduces incorrect trades.
-
Overall, combining trend elimination, DEMA calculation and condition filters, this strategy can generate relatively clear and reliable trading signals.
Risk Analysis
Some risks of this strategy need attention:
-
After eliminating the trend, MACD crossover signals may increase, which needs live testing to verify feasibility.
-
Although DEMA algorithm filters some noise, there can still be many false signals in the indicator calculation.
-
The date and month filter conditions may be too rigid, missing some trading opportunities.
-
The stop loss position needs to be reasonably set, too loose will increase risk, too tight will stop loss frequently.
-
The strategy relies mainly on MACD, if the market is not suitable for this indicator, the performance may be affected.
-
There is still large room for parameter optimization, which needs further testing through backtest and live trading.
Solutions:
-
Add other indicator confirmation to avoid false signals.
-
Optimize date filter conditions appropriately.
-
Test and optimize stop loss points carefully.
-
Add trend judgment mechanism to avoid trading against the trend.
-
Comprehensive backtest and parameter optimization to improve stability.
Optimization Directions
The strategy can be optimized in the following aspects:
-
Test different price moving averages to find a better alternative to EMA.
-
Try different parameter combinations to optimize the MACD fast line, slow line and signal line lengths.
-
Add auxiliary indicators like volume to avoid false signals.
-
Optimize stop loss strategies, set reasonable moving or order stop loss.
-
Optimize the date and month filter conditions to make them more flexible.
-
Add trend judgment to avoid trading against the trend.
-
Comprehensive parameter optimization to improve stability.
-
Backtest on longer time period to check long term performance.
-
Live trading to verify and further modify the parameters based on real trading.
Summary
In summary, this strategy uses the idea of eliminating the trend and calculating DEMA MACD combined with date filters to generate trading signals, which is a simple but feasible strategy idea. Its biggest advantage is revealing the MACD pattern clearly without being affected by the price trend. However, there are still some risks of this strategy that need parameter optimization and risk control measures to be implemented for practical application. There is also large room for optimization, and with sufficient verification and optimization, this strategy can become a stable and reliable short-term trading system.
[/trans]
Strategy Arguments
| Argument | Default | Description |
|---|---|---|
| v_input_1 | 9 | maperiod |
| v_input_2 | 12 | MACD Fast Line Length |
| v_input_3 | 26 | MACD Slow Line Length |
| v_input_4 | 9 | Signal Line Length |
| v_input_5 | true | monthfrom |
| v_input_6 | 12 | monthuntil |
| v_input_7 | true | dayfrom |
| v_input_8 | 31 | dayuntil |
| v_input_9 | 2018 | yearfrom |
| v_input_10 | 2021 | yearuntil |
Source (PineScript)
/*backtest
start: 2022-10-23 00:00:00
end: 2023-10-29 00:00:00
period: 1d
basePeriod: 1h
exchanges: [{"eid":"Futures_Binance","currency":"BTC_USDT"}]
*/

//@version=2

strategy(title = "Trendless MACD  Strategy",shorttitle="MACD-T Strategy",default_qty_type = strategy.percent_of_equity, default_qty_value = 100,commission_type=strategy.commission.percent,commission_value=0.01,initial_capital=100000)


maperiod=input(9)
ema=ema(close,maperiod)


fastmacd = input(12,title='MACD Fast  Line Length')
slowmacd = input(26,title='MACD Slow Line Length')
signalmacd = input(9,title='Signal Line Length')

macdslowline1 = ema(ema,slowmacd)
macdslowline2 = ema(macdslowline1,slowmacd)
DEMAslow = ((2 * macdslowline1) - macdslowline2 )

macdfastline1 = ema(ema,fastmacd)
macdfastline2 = ema(macdfastline1,fastmacd)
DEMAfast = ((2 * macdfastline1) - macdfastline2)

MACDLine = (DEMAfast - DEMAslow)

SignalLine1 = ema(MACDLine, signalmacd)
SignalLine2 = ema(SignalLine1, signalmacd)
SignalLine = ((2 * SignalLine1) - SignalLine2 )


MACDSignal = MACDLine-SignalLine


colorbar= MACDSignal>0?green:red

plot(MACDSignal,color=colorbar,style=columns,title='Histogram',histbase=0)
p1 = plot(MACDLine,color=blue,title='MACDLine')
p2=plot(SignalLine,color=red,title="SignalLine")
fill(p1,p2,color=blue)


longCond =  crossover(MACDLine,SignalLine)

shortCond =  crossunder(MACDLine,SignalLine)


monthfrom =input(1)
monthuntil =input(12)
dayfrom=input(1)
dayuntil=input(31)

yearfrom= input(2018)
yearuntil=input(2021)

if (  longCond   )
    strategy.entry("LONG", strategy.long, stop=close, oca_name="TREND",  comment="LONG")

else
    strategy.cancel(id="LONG")


if ( shortCond  )

    strategy.entry("SHORT", strategy.short,stop=close, oca_name="TREND", comment="SHORT")
else
    strategy.cancel(id="SHORT")
Detail
https://www.fmz.com/strategy/430595
Last Modified
2023-10-30 17:08:16