
13 KiB
Name
趋势区间突破策略Trend-Breakout-Strategy-Based-on-Bollinger-Bands
Author
ChaoZhang
Strategy Description
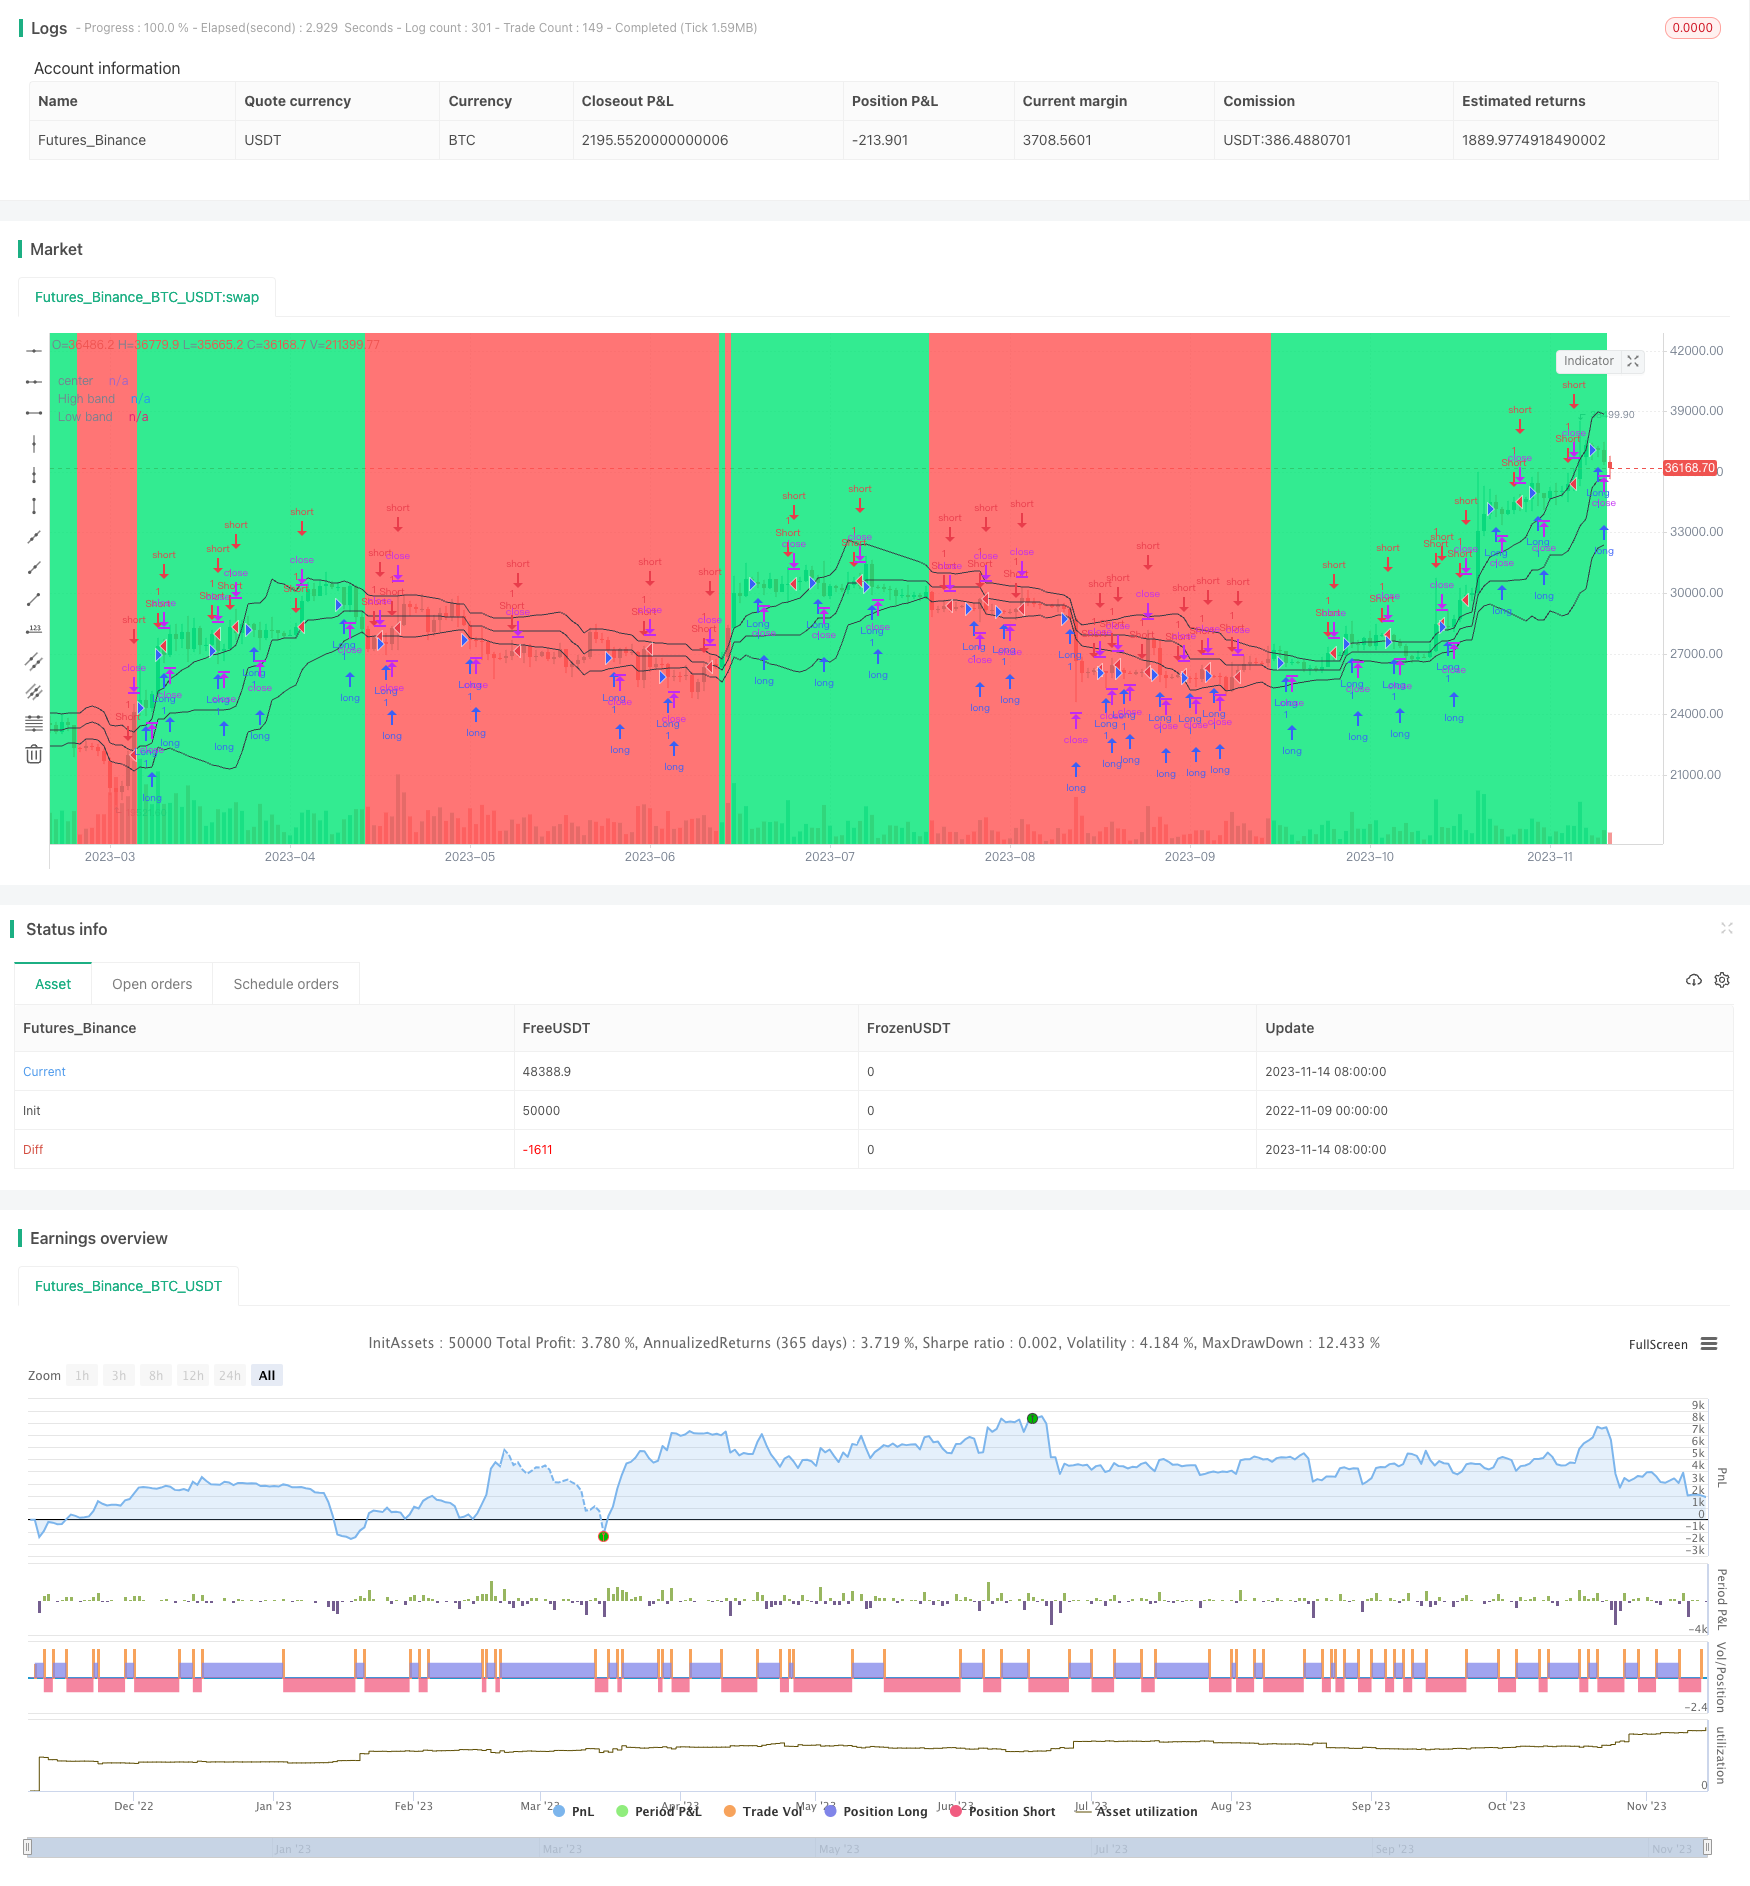
[trans]
概述
本策略是一个基于布林带的趋势追踪策略。它使用布林带计算股价的上下区间,结合K线实体判断趋势方向,在趋势区间突破时进行 longing/shorting 操作。该策略适用于具有明显趋势的股票,能够抓住趋势的中长线盈利机会。
策略原理
本策略使用布林带的上带、中线、下带来判断价格区间。布林带上下两条带线包裹价格,中线为均线,带宽度随价格波动程度变化。当价格从下方上破布林带上线时,表明价格开始向上突破区间,rieve 为做多信号。当价格从上方下破布林带下线时,表明价格开始向下突破区间,则为做空信号。
布林带区间突破判断趋势方向后,策略还会结合K线实体方向进行确认。如果K线实体方向与趋势方向一致,如出现多头趋势中阳线,就进行开仓操作。如果K线实体方向与趋势方向相反,如出现多头趋势中阴线,则跳过该信号。这个设计的目的是进一步避免假突破带来的风险。
具体来说,策略的交易信号生成规则如下:
-
计算布林带上下两条带线及中线,判断价格所处区间
-
当价格从下向上突破布林带上线时,判断为多头信号
-
此时如果K线为阳线,确认趋势,则进行开多仓
-
当价格从上向下突破布林带下线时,判断为空头信号
-
此时如果K线为阴线,确认趋势,则进行开空仓
-
以给定的百分比止盈或止损
通过布林带区间突破入场,并结合K线实体方向进行二次确认,可以有效识别趋势方向,在趋势初期获得较好ENTRY,于趋势中期获得盈利离场。
优势分析
这是一个较为典型的趋势追踪策略,具有以下几点优势:
-
使用布林带具有自适应性,可以动态调整突破区间,适用于不同波动率的股票
-
结合K线实体进行二次确认,可以过滤假突破 bringing
-
采用中长线持仓,降低交易频率,有利于减少交易成本和滑点损失
-
追踪趋势中期,避开短期震荡,可以获得较好的风险收益比
-
程序量化执行,回测结果优秀,实盘表现具有稳定性
-
策略 concept 清晰,容易理解,具有扩展空间
通过布林带判断趋势方向,K线确认入场时机,可以有效抓住中长线数量优势所带来的盈利机会。这是一个具有较强实战性的策略。
风险分析
本策略也存在一些风险需要注意:
-
突破失败风险。布林带突破其实质是概率事件,存在一定可能的假突破。
-
反转风险。中长线趋势也可能出现反转,需要设定合理的止损点以控制风险。
-
参数优化风险。布林带参数和止损点需要根据不同股票合理优化,否则会影响策略稳定性。
-
过度优化风险。针对历史数据过度优化参数,会导致策略 curve fitting。
-
实盘执行风险。程序回测与实盘执行也会存在一定的偏差。
针对以上风险,可以通过以下方法进行改善:
-
优化布林带参数,选取合适的带宽度。
-
结合更多因素确认趋势,如交易量等。
-
动态调整止损点,防止过大反转造成损失。
-
采用 walk forward analysis 等方法避免过拟合。
-
优化下单方式,控制实盘执行效率。
优化方向
本策略还可从以下几个方面进行继续优化:
-
结合更多指标确认趋势,如KDJ,MACD等,提高信号准确率。
-
采用机器学习方法动态优化布林带参数,而不是固定参数。
-
在突破点附近设置买卖区间,生成更精确的交易信号。
-
优化止盈止损策略,采用动态跟踪止损或部分止盈方式。
-
引入资金管理优化,动态调整仓位,控制单笔风险。
-
结合高级执行方式,改善实盘效果,降低交易成本和滑点。
-
增加对市场环境的判断,在特定环境下关闭策略,控制风险。
通过引入更多技术指标和优化手段,可以进一步增强策略的稳定性和盈利能力,获得更出色的回测和实盘效果。
总结
本策略是一个典型的趋势追踪策略,核心思路是以布林带作为动态区间,判断价格趋势方向。结合K线实体进行二次确认,在趋势初期布林带突破点入场,目标为趋势中期的量级优势。
该策略具有使用布林带判断趋势、K线确认信号、降低交易频率、程序化执行等优势。也存在一定的假突破风险、止损优化难度、实盘效果偏差等问题。通过引入更多技术指标、动态优化参数以及高级执行手段等,可以进一步增强策略稳定性和实盘表现。
总体来说,本策略作为一个典型的趋势追踪策略,其核心思路清晰、易于实现,具有较强的可行性。在持续优化和严格风险控制下,可以成为量化交易体系中的一个有效策略模块。
||
Overview
This is a trend following strategy based on Bollinger Bands. It uses Bollinger Bands to calculate price channels and combines candlestick patterns to determine trend direction. Long/short positions will be opened when price breaks out of the Bollinger Bands. This strategy works well for stocks with obvious trends and aims to capture mid-term trend profits.
Strategy Logic
This strategy uses the upper band, middle band and lower band of Bollinger Bands to determine price ranges. The upper and lower bands envelope price movements while the middle band is the moving average. Band width changes based on price volatility. When price breaks above the upper band, it signals an upward breakout and a long entry. When price breaks below the lower band, it signals a downward breakout and a short entry.
After determining trend direction with Bollinger Bands breakout, the strategy also confirms it with candlestick patterns. If the candle body aligns with the trend, such as bullish candle in an uptrend, a position will be opened. If the candle body shows reverse pattern, such as bearish candle in an uptrend, the signal will be ignored. This design aims to avoid false breakout risks.
The detailed trading signals rules are:
-
Calculate upper band, middle band and lower band of Bollinger Bands to determine price range
-
When price breaks above upper band, it signals an upward/long trend
-
If the candlestick is bullish, confirm the trend and go long
-
When price breaks below lower band, it signals a downward/short trend
-
If the candlestick is bearish, confirm trend and go short
-
Set stop loss and take profit based on percentage
By entering on Bollinger Bands breakouts and confirming with candlesticks, this strategy can effectively identify trend direction and get good entries during early trend stages. Profits are taken during mid-term trends.
Advantage Analysis
This is a typical trend following strategy with the following strengths:
-
Bollinger Bands are adaptive and can adjust ranges for stocks with different volatility
-
Candlestick confirmation filters out false breakouts
-
Mid-term holding lowers trading frequency and reduces costs/slippage
-
Capturing mid-term trends avoids short-term noise and gives good risk-reward
-
Backtest results are strong and real trading is stable due to systemization
-
Strategy logic is clear and easy to understand, with room for enhancements
By determining trend with Bollinger Bands and entering on candlestick confirmation, this strategy effectively catches mid-term momentum driven by volume. It has strong practical value.
Risk Analysis
There are also some risks to note for this strategy:
-
Failed breakout risk. Breaking Bollinger Bands has probabilistic nature and false breakouts occur
-
Reversal risk. Mid-term trends can also reverse, reasonable stops should be set
-
Parameter optimization risk. Bollinger Bands parameters and stops need tuning for different stocks
-
Overfitting risk. Excessive parameter optimization causes curve fitting
-
Execution risk. Divergence exists between backtest and real trading
To address these risks, the following improvements can be made:
-
Optimize Bollinger Bands parameters and width for better fit
-
Add more factors like volume to confirm the trend
-
Use dynamic stops to prevent huge loss on reversals
-
Apply walk forward analysis to avoid overfitting
-
Improve order execution for better real trading efficiency
Optimization Directions
This strategy can be further enhanced in the following aspects:
-
Add more indicators like KDJ, MACD to confirm signals and improve accuracy
-
Use machine learning to dynamically optimize parameters rather than fixed values
-
Set price zones around breakout points to generate more precise signals
-
Optimize exits with trailing stops or partial profit taking
-
Introduce position sizing for better risk management
-
Utilize advanced order types to improve execution results
-
Add market regime filters to shut off strategy in certain environments
By introducing more techniques and optimizations, the stability and profitability of this strategy can be further improved for even better backtest and real trading outcomes.
Conclusion
This is a typical trend following strategy that uses Bollinger Bands as dynamic ranges to determine trend direction. Candlestick confirmation provides precise entry signals. Entries are made at early trend stages with the goal of riding mid-term momentum.
The advantages of this strategy include using Bollinger Bands for trend, candlestick for entry confirmation, low trading frequency, and easy systemization. It also has risks like false breakouts, stop loss optimization difficulties, and execution divergence. More indicators, dynamic parameters, and advanced execution can enhance stability and real trading performance.
Overall, as a typical trend following strategy, it has a clear logic and is easy to implement with strong viability. With continuous optimizations and stringent risk control, it can become an effective module in quantitative trading systems.
[/trans]
Strategy Arguments
| Argument | Default | Description |
|---|---|---|
| v_input_1 | true | Long |
| v_input_2 | true | Short |
| v_input_3 | false | take, % |
| v_input_4 | false | Counter-trend entry |
| v_input_5 | 20 | Period |
| v_input_6 | true | Show Bands |
| v_input_7 | true | Show Background |
Source (PineScript)
/*backtest
start: 2022-11-09 00:00:00
end: 2023-11-15 00:00:00
period: 1d
basePeriod: 1h
exchanges: [{"eid":"Futures_Binance","currency":"BTC_USDT"}]
*/


//@version=2
strategy("Noro's Bands Scalper Strategy v1.2", shorttitle = "Scalper str 1.2", overlay=true, default_qty_type = strategy.percent_of_equity, default_qty_value=100.0, pyramiding=0)

//Settings
needlong = input(true, defval = true, title = "Long")
needshort = input(true, defval = true, title = "Short")
takepercent = input(0, defval = 0, minval = 0, maxval = 1000, title = "take, %")
needct = input(false, defval = false, title = "Counter-trend entry")
len = input(20, defval = 20, minval = 2, maxval = 200, title = "Period")
needbb = input(true, defval = true, title = "Show Bands")
needbg = input(true, defval = true, title = "Show Background")
src = close

//PriceChannel 1
lasthigh = highest(src, len)
lastlow = lowest(src, len)
center = (lasthigh + lastlow) / 2

//Distance
dist = abs(src - center)
distsma = sma(dist, len)
hd = center + distsma
ld = center - distsma
hd1 = center + distsma / 2
ld1 = center - distsma / 2

//Trend
trend = close < ld and high < center ? -1 : close > hd and low > center ? 1 : trend[1]

//Lines
colo = needbb == false ? na : black
plot(hd, color = colo, linewidth = 1, transp = 0, title = "High band")
plot(center, color = colo, linewidth = 1, transp = 0, title = "center")
plot(ld, color = colo, linewidth = 1, transp = 0, title = "Low band")

//Background
col = needbg == false ? na : trend == 1 ? lime : red
bgcolor(col, transp = 80)

//Body
body = abs(close - open)
smabody = sma(body, 100)

//Signals
bar = close > open ? 1 : close < open ? -1 : 0
up7 = trend == 1 and ((bar == -1 and bar[1] == -1) or (body > smabody and close < open)) ? 1 : 0
dn7 = trend == 1 and bar == 1 and bar[1] == 1 and close > strategy.position_avg_price * (100 + takepercent) / 100 ? 1 : 0
up8 = trend == -1 and bar == -1 and bar[1] == -1 and close < strategy.position_avg_price * (100 - takepercent) / 100 ? 1 : 0
dn8 = trend == -1 and ((bar == 1 and bar[1] == 1) or (body > smabody and close > open)) ? 1 : 0

if up7 == 1 or up8 == 1
    strategy.entry("Long", strategy.long, needlong == false ? 0 : trend == -1 and needct == false ? 0 : na)

if dn7 == 1 or dn8 == 1
    strategy.entry("Short", strategy.short, needshort == false ? 0 : trend == 1 and needct == false ? 0 : na)
Detail
https://www.fmz.com/strategy/432340
Last Modified
2023-11-16 16:24:12