
12 KiB
Name
超趋势V策略Super-Trend-V-Strategy
Author
ChaoZhang
Strategy Description
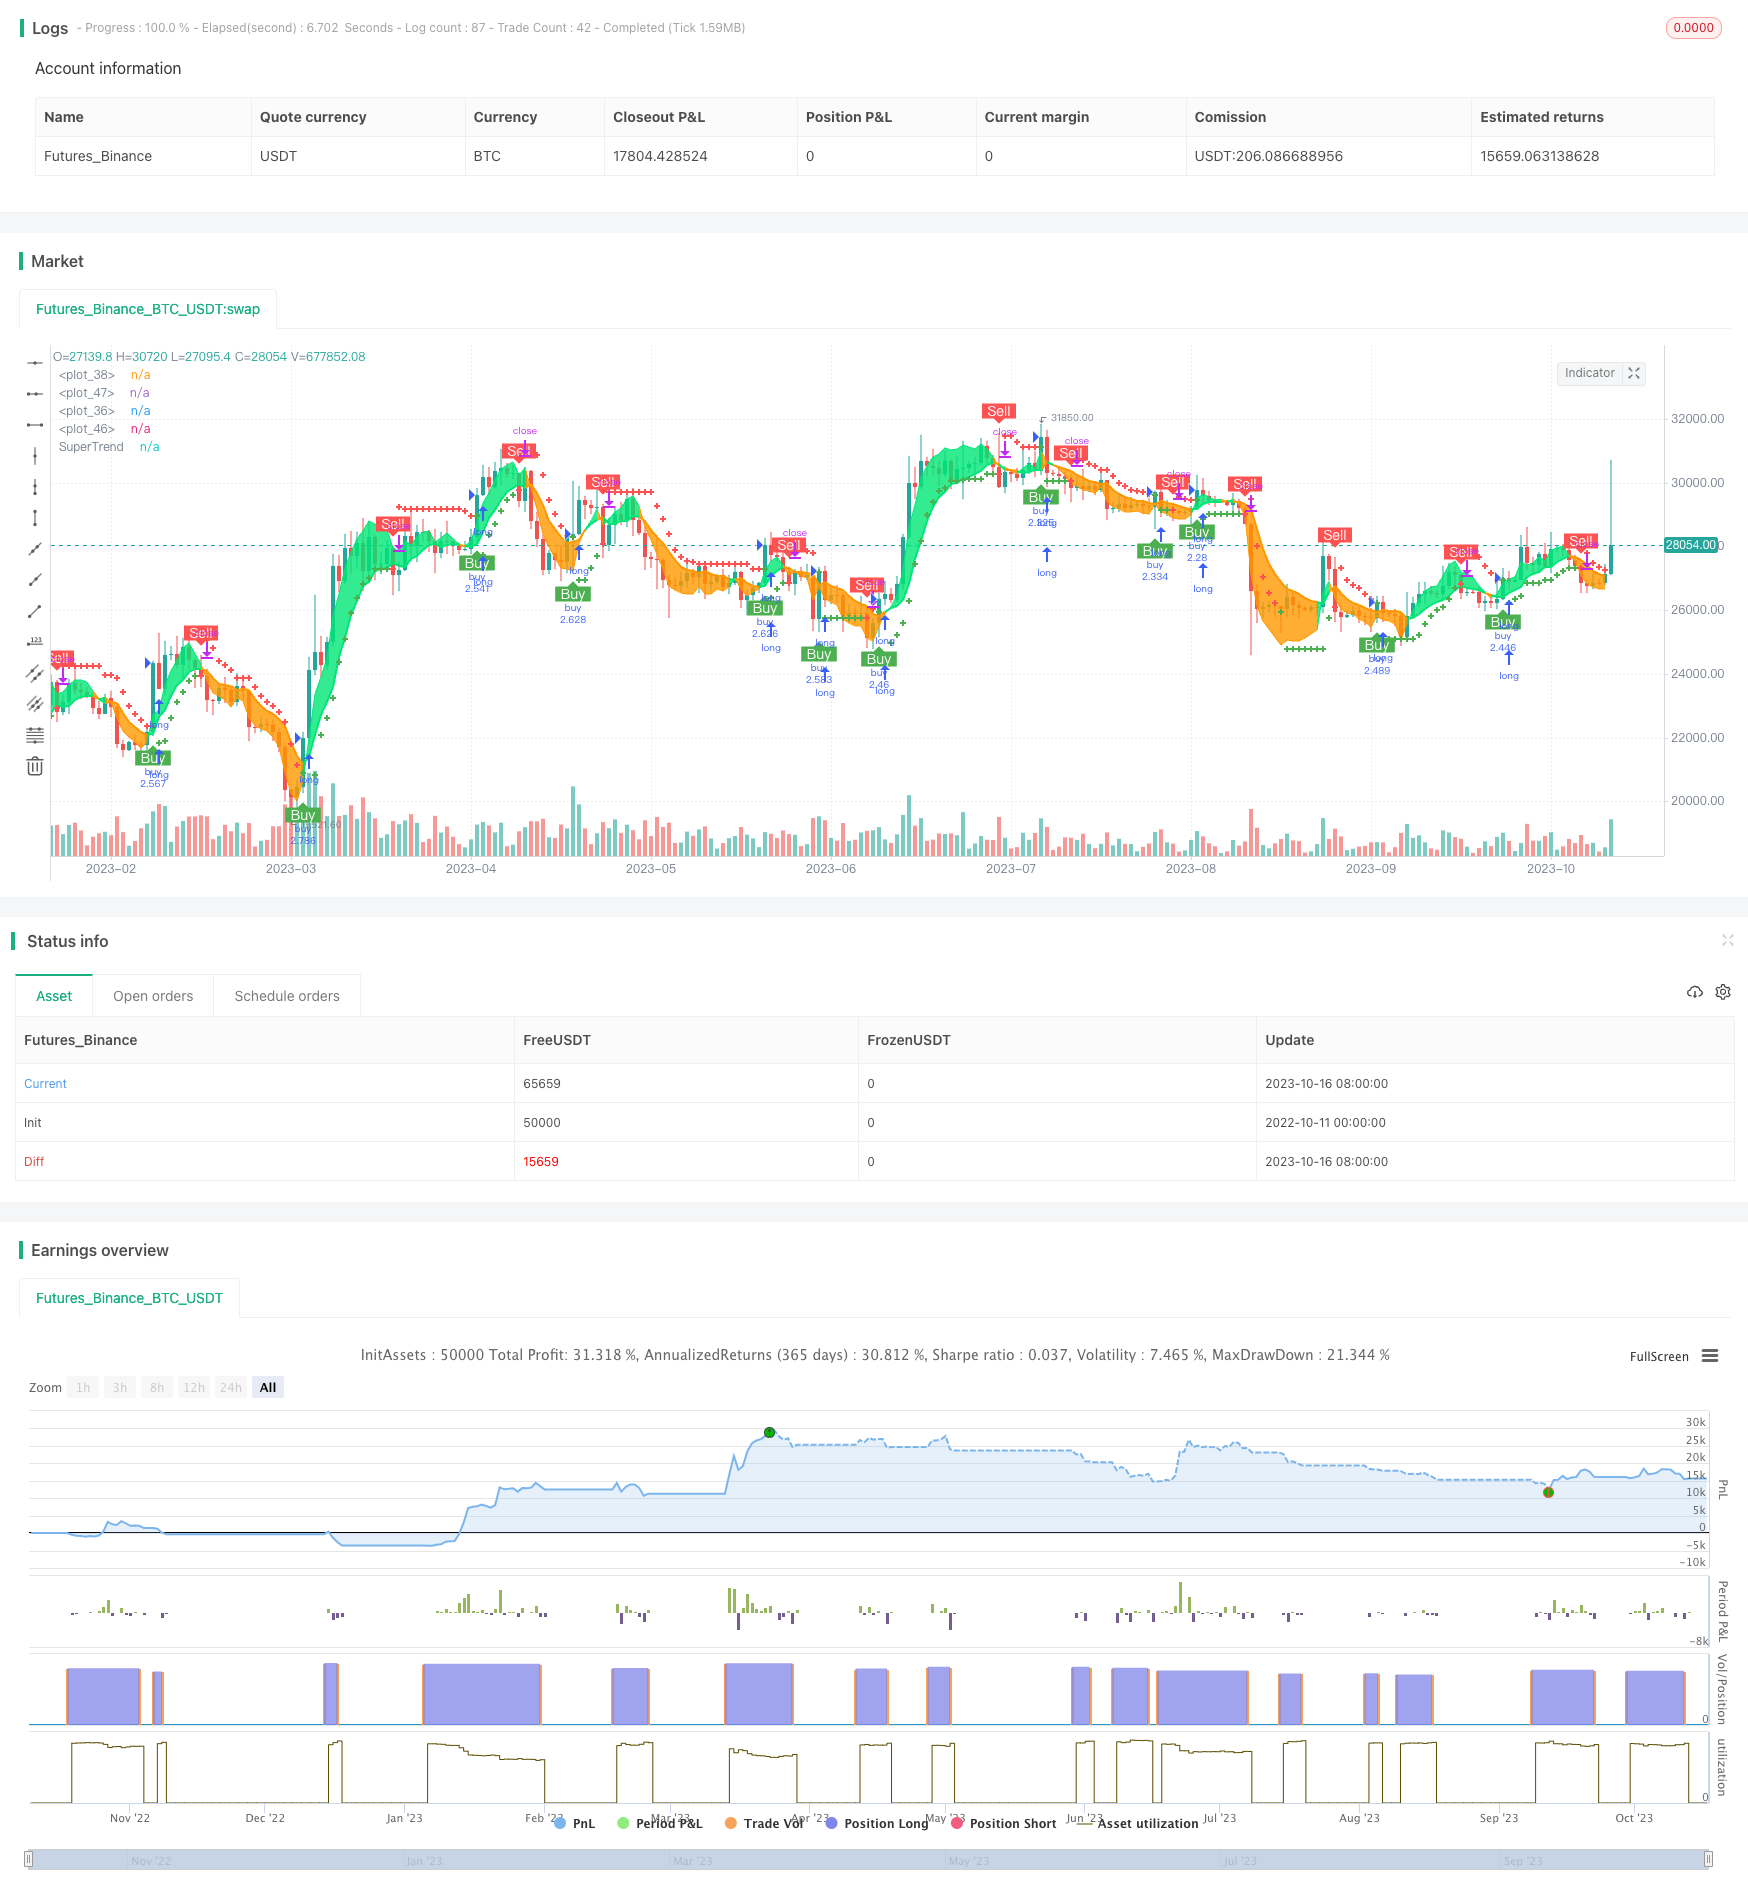
[trans]
概述
超趋势V策略是一种基于移动平均线和标准差的短线交易策略。它利用Super Trend指标判断价格的趋势方向,结合移动平均线形成的支撑和阻力进行入场。同时,它利用标准差通道预测价格潜在的支撑和阻力区域,设定止损止盈的价格区间,实现趋势跟随和高效退出的短线交易策略。
策略原理
该策略首先计算Super Trend指标,Super Trend指标利用ATR和价格的关系判断趋势的方向。当价格高于上升趋势时为看涨,当价格低于下跌趋势时为看跌。
然后计算出价格的移动平均线EMA和开盘价的移动平均线EMA,当价格上穿移动平均线且高于开盘价均线时为买入信号,当价格下穿移动平均线且低于开盘价均线时为卖出信号。
接着利用标准差计算出价格通道的上下轨,并作平滑处理,价格突破标准差上轨时为止损信号,价格突破标准差下轨时为止盈信号。
最后,结合不同时间周期的移动平均线来判断趋势方向,与Super Trend指标结合,形成稳定的趋势判断。
策略优势
- 利用Super Trend指标判断价格趋势方向,避免趋势反转造成损失
- 移动平均线结合开盘价辅助判断入场时机,避免假突破
- 标准差通道预测价格潜在支撑和阻力区域,设置止损止盈价格
- 多时间周期结合判断趋势方向,提高稳定性
策略风险
- Super Trend指标存在滞后,可能漏掉趋势转换点
- 移动平均线产生交叉信号存在滞后,入场时机不准
- 标准差通道范围过于固定,不能实时反映市场波动
- 多个时间周期判断可能产生互相冲突
风险解决方法:
- 适当缩短Super Trend参数,提高敏感性
- 优化移动平均线周期,或加入其他指标判断入场
- 动态调整标准差通道参数,使范围能配合市场
- 确定清楚多周期判断逻辑,处理可能的冲突
策略优化方向
- 优化Super Trend参数,寻找最佳参数组合
- 尝试其他指标结合移动平均线判断入场时机
- 尝试动态调整标准差通道参数
- 测试不同的多周期组合,找到最匹配的周期
- 优化止损止盈策略,以提高策略获利空间
总结
超趋势V策略整合趋势、均线、标准差通道等指标优点,实现了稳定判断趋势方向,选择合适入场时机,并设置价格区域止损止盈的短线交易策略。通过参数优化、指标优化、止损止盈优化等方面进行改进,能够提高策略稳定性和盈利能力。其扎实的逻辑和严谨的思路值得学习和研究。
||
Overview
The Super Trend V strategy is a short-term trading strategy based on moving averages and standard deviations. It uses the Super Trend indicator to determine the price trend direction and combines the support and resistance formed by moving averages to enter the market. Meanwhile, it uses the standard deviation channel to predict the potential support and resistance zones of the price and sets the stop loss and take profit price range to implement a trend-following and efficient-exiting short-term trading strategy.
Strategy Logic
Firstly, this strategy calculates the Super Trend indicator. The Super Trend indicator uses the relationship between ATR and price to determine the trend direction. When the price is above the rising trend, it is bullish. When the price is below the falling trend, it is bearish.
Then it calculates the EMA of price and the EMA of open price. When the price crosses above the EMA and is higher than the open price EMA, it is a buy signal. When the price crosses below the EMA and is lower than the open price EMA, it is a sell signal.
Next, it uses standard deviation to calculate the upper and lower bands of the price channel and makes smoothing processing. When the price breaks through the upper band of standard deviation, it is a stop loss signal. When the price breaks through the lower band of standard deviation, it is a take profit signal.
Finally, it combines moving averages of different timeframes to determine the trend direction, together with the Super Trend indicator, to form a stable trend judgment.
Advantages of the Strategy
- Use Super Trend indicator to determine the price trend direction, avoiding losses caused by trend reversal
- Moving averages combined with open price help determine entry timing, avoiding false breakdowns
- Standard deviation channel predicts potential support and resistance zones of the price for stop loss and take profit
- Multiple timeframes combination improves the stability of trend judgment
Risks of the Strategy
- Super Trend indicator has lagging effect, may miss trend change points
- Crossovers of moving averages have lagging effect, entry timing may not be accurate
- Range of standard deviation channel is too fixed to reflect market fluctuation in real time
- Judgment based on multiple timeframes may conflict with each other
Risk Management:
- Shorten Super Trend parameters properly to improve sensitivity
- Optimize moving average periods, or add other indicators to determine entry
- Adjust standard deviation channel dynamically to match the market
- Define clear logic for multi-timeframe judgments to handle conflicts
Optimization Directions
- Optimize Super Trend parameters to find the best combination
- Try other indicators combined with moving averages to determine entry
- Try dynamic adjustment of standard deviation channel
- Test different multi-timeframe combinations to find the best match
- Optimize stop loss and take profit strategies to improve profit space
Conclusion
The Super Trend V strategy integrates the advantages of trend, moving average, standard deviation channel and other indicators to achieve stable trend judgment, proper entry timing, and stop loss and take profit based on price zones. By optimizing parameters, indicators, stop loss and take profit, etc., it can improve the stability and profitability of the strategy. Its solid logic and rigorous thinking are worth learning and researching.
[/trans]
Strategy Arguments
| Argument | Default | Description |
|---|---|---|
| v_input_1 | 0 | Strategy Direction: long |
| v_input_2 | 720 | tf |
| v_input_3 | true | SuperTrend Multiplier |
| v_input_4 | 10 | SuperTrend Period |
| v_input_5 | 2 | TP VWAP Deviation |
| v_input_6 | 150 | TP length |
| v_input_7 | 2016 | Backtest Start Year |
| v_input_8 | true | Backtest Start Month |
| v_input_9 | true | Backtest Start Day |
| v_input_10 | 2030 | Backtest Stop Year |
| v_input_11 | 12 | Backtest Stop Month |
| v_input_12 | 30 | Backtest Stop Day |
Source (PineScript)
/*backtest
start: 2022-10-11 00:00:00
end: 2023-10-17 00:00:00
period: 1d
basePeriod: 1h
exchanges: [{"eid":"Futures_Binance","currency":"BTC_USDT"}]
*/

// © theCrypster 2020

//@version=4
strategy(title = "Super trend V Strategy version", overlay = true, pyramiding=1,initial_capital = 1000, default_qty_type= strategy.percent_of_equity, default_qty_value = 100, calc_on_order_fills=false, slippage=0,commission_type=strategy.commission.percent,commission_value=0.075)
strat_dir_input = input(title="Strategy Direction", defval="long", options=["long", "short", "all"])
strat_dir_value = strat_dir_input == "long" ? strategy.direction.long : strat_dir_input == "short" ? strategy.direction.short : strategy.direction.all
strategy.risk.allow_entry_in(strat_dir_value)
hilow = ((high - low)*100)
openclose = ((close - open)*100)
vol = (volume / hilow)
spreadvol = (openclose * vol)
VPT = spreadvol + cum(spreadvol)
window_len = 28

v_len = 14
price_spread = stdev(high-low, window_len)

v =  spreadvol + cum(spreadvol)
smooth = sma(v, v_len)
v_spread = stdev(v - smooth, window_len)
shadow = (v - smooth) / v_spread * price_spread

out = shadow > 0 ? high + shadow : low + shadow
//
src = out
src1=open
src2=low
src3=high
tf =input(720)
len = timeframe.isintraday and timeframe.multiplier >= 1 ?
   tf / timeframe.multiplier * 7 :
   timeframe.isintraday and timeframe.multiplier < 60 ?
   60 / timeframe.multiplier * 24 * 7 : 7

c = ema(src, len)
plot(c,color=color.red)
o = ema(src1,len)
plot(o,color=color.blue)
//h = ema(src3,len)
//l=ema(src2,len)
//
col=c > o? color.lime : color.orange
vis = true
vl = c
ll = o
m1 = plot(vl, color=col, linewidth=1, transp=60)
m2 = plot(vis ? ll : na,  color=col, linewidth=2, transp=80)

fill(m1, m2,  color=col, transp=70)
//

vpt=ema(out,len)

// INPUTS //
st_mult   = input(1,   title = 'SuperTrend Multiplier', minval = 0, maxval = 100, step = 0.01)
st_period = input(10, title = 'SuperTrend Period',     minval = 1)

// CALCULATIONS //
up_lev = vpt - (st_mult * atr(st_period))
dn_lev = vpt + (st_mult * atr(st_period))

up_trend   = 0.0
up_trend   := close[1] > up_trend[1]   ? max(up_lev, up_trend[1])   : up_lev

down_trend = 0.0
down_trend := close[1] < down_trend[1] ? min(dn_lev, down_trend[1]) : dn_lev

// Calculate trend var
trend = 0
trend := close > down_trend[1] ? 1: close < up_trend[1] ? -1 : nz(trend[1], 1)

// Calculate SuperTrend Line
st_line = trend ==1 ? up_trend : down_trend

// Plotting
plot(st_line[1], color = trend == 1 ? color.green : color.red , style = plot.style_cross, linewidth = 2, title = "SuperTrend")
buy=crossover( close, st_line) and close>o
sell=crossunder(close, st_line) and close<o
//plotshape(crossover( close, st_line), location = location.belowbar, color = color.green,size=size.tiny)
//plotshape(crossunder(close, st_line), location = location.abovebar, color = color.red,size=size.tiny)
plotshape(buy, title="buy", text="Buy", color=color.green, style=shape.labelup, location=location.belowbar, size=size.small, textcolor=color.white, transp=0)  //plot for buy icon
plotshape(sell, title="sell", text="Sell", color=color.red, style=shape.labeldown, location=location.abovebar, size=size.small, textcolor=color.white, transp=0)  //plot for sell icon


//
multiplier = input(title="TP VWAP Deviation", type=input.float, defval=2, minval=1)
src5 = vwap
len5 = input(title="TP length", defval=150, minval=1)
offset = 0

calcSlope(src5, len5) =>
    sumX = 0.0
    sumY = 0.0
    sumXSqr = 0.0
    sumXY = 0.0
    for i = 1 to len5
        val = src5[len5-i]
        per = i + 1.0
        sumX := sumX + per
        sumY := sumY + val
        sumXSqr := sumXSqr + per * per
        sumXY := sumXY + val * per


    slope = (len5 * sumXY - sumX * sumY) / (len5 * sumXSqr - sumX * sumX)
    average = sumY / len5
    intercept = average - slope * sumX / len5 + slope
    [slope, average, intercept]

var float tmp = na
[s, a, i] = calcSlope(src5, len5)

vwap1=(i + s * (len5 - offset))
sdev = stdev(vwap, len5)
dev = multiplier * sdev
top=vwap1+dev
bott=vwap1-dev

//
z1 = vwap1 + dev
x1 = vwap1 - dev

low1 = crossover(close, x1)
high1 = crossunder(close, z1)

plotshape(low1, title="low", text="TP", color=color.red, style=shape.labelup, location=location.belowbar, size=size.small, textcolor=color.white, transp=0)  //plot for buy icon
plotshape(high1, title="high", text="TP", color=color.green, style=shape.labeldown, location=location.abovebar, size=size.small, textcolor=color.white, transp=0)  //plot for sell icon


//
// Testing Start dates
testStartYear = input(2016, "Backtest Start Year")
testStartMonth = input(1, "Backtest Start Month")
testStartDay = input(1, "Backtest Start Day")
testPeriodStart = timestamp(testStartYear,testStartMonth,testStartDay,0,0)
//Stop date if you want to use a specific range of dates
testStopYear = input(2030, "Backtest Stop Year")
testStopMonth = input(12, "Backtest Stop Month")
testStopDay = input(30, "Backtest Stop Day")
testPeriodStop = timestamp(testStopYear,testStopMonth,testStopDay,0,0)


testPeriod() =>
    time >= testPeriodStart and time <= testPeriodStop ? true : false

l = buy
s1 = sell

if l and testPeriod()
    strategy.entry("buy", strategy.long)
if s1 and testPeriod()
    strategy.entry("sell", strategy.short)
Detail
https://www.fmz.com/strategy/429579
Last Modified
2023-10-18 12:35:53