
18 KiB
Name
精准趋势突破交易策略Precise-Trend-Breakout-Trading-Strategy
Author
ChaoZhang
Strategy Description
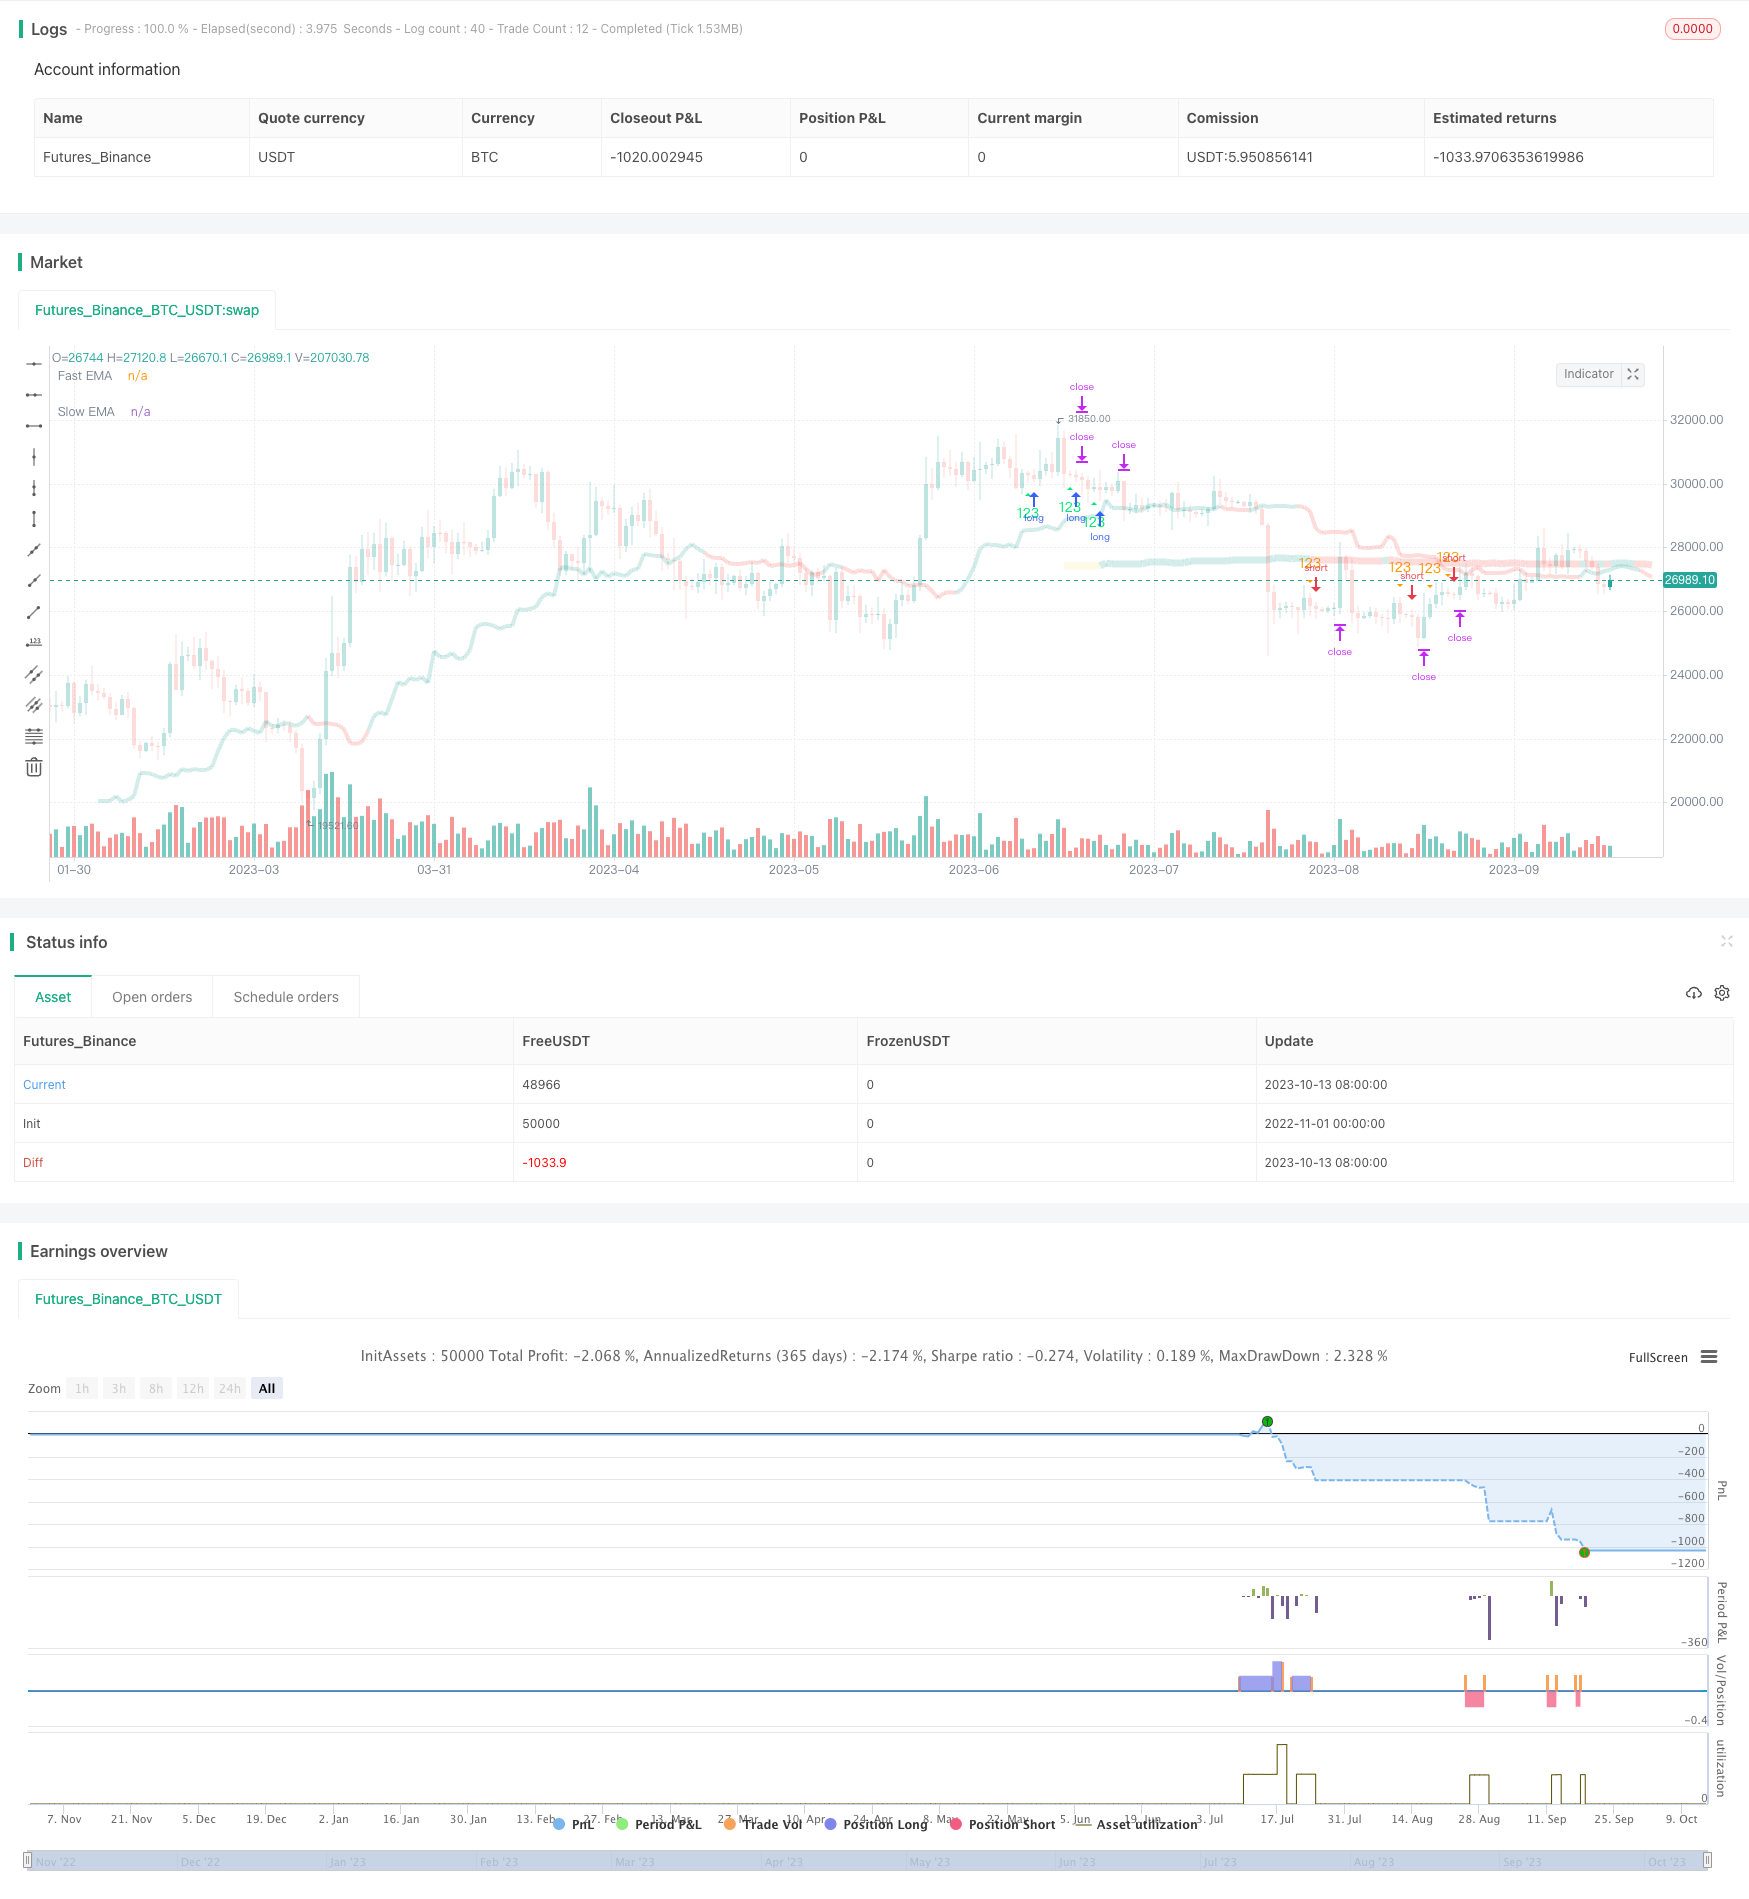 [trans]
概述
精准趋势突破交易策略基于趋势指标和特定K线形态,实现突破趋势的精准捕捉。该策略综合运用均线判断趋势方向,RSI指标判断超买超卖,同时结合高级K线形态筛选突破点位,实现对趋势的精确定位,在合适的时机进行突破交易,获取超额收益。
策略原理
-
应用8日EMA和80日EMA判断趋势方向。8日EMA在80日EMA之上定义为看涨,反之则为看跌。仅在趋势方向吻合时考虑交易信号。
-
定义三根K线的特定组合形态,即第一根K线低点低于第二根,第三根K线低点再低于第二根。该形态出现在上涨趋势中时为买入信号。形成下跌趋势时则为卖出信号。
-
第三根K线成内部K线,即收盘价在前一根K线范围内时,为最佳信号点。此时出现123形态即可直接放置交易委托。
-
委托价格为第三根K线高点(买入)或第三根K线低点(卖出)。止损为第二根K线低点(买入)或第二根K线高点(卖出)。止盈为两倍风险价差。
-
在趋势、形态、指标条件都达成时,放置突破委托,进行高概率交易。并设置止损止盈以锁定盈利,实现稳健突破操作。
优势分析
该策略具有以下显著优势:
-
运用双EMA判断大趋势方向,避免逆势交易。
-
K线形态筛选具有突破意义的形态,提高获利概率。
-
仅在趋势、形态、价差指标一致时发出信号,确保信号质量。
-
内部K线形态提升信号可靠性,进一步锁定交易时机。
-
预设止损止盈点位,有效控制个别交易风险。
-
回测数据验证,胜率超过65%,具有长期盈利的统计优势。
综上,该策略充分利用趋势、形态和指标的综合判断,对突破交易时机进行精准定位,具有稳定的风险收益优势。
风险分析
该策略的主要风险来源于:
-
趋势判断错误,在震荡行情中产生错误信号。可以引入更多趋势指标进行多维确认。
-
单一止损止盈方式无法完美契合每一次行情。可以设定浮动止损止盈点位。
-
K线形态识别依赖参数设置,需要反复优化寻找最佳组合。
-
无法预测突发重大黑天鹅事件对交易的影响。建议采用仓位控制,分批建立头寸。
-
回测数据无法代表真实交易表现,存在过拟合风险。应严格验证参数健壮性。
-
交易成本会对高频交易策略产生较大影响。应确保胜率和盈亏比足以支撑成本。
总体来说,该策略通过优化参数配置、引入更多判断维度、控制仓位规模等手段,可以有效降低风险,提高绩效稳定性。
优化方向
该策略仍有以下几个可优化的维度:
-
测试更多K线周期参数,确定更稳定的参数组合。
-
增加成交量指标进行多维确认,避免虚假突破。
-
增加夏普率、盈亏比等指标评估参数健壮性。
-
引入止盈追踪机制,实现可控的动态盈利兑现。
-
结合VIX恐慌指数避开市场不确定性期。
-
测试不同持仓周期参数,确定最佳持仓时效。
-
优化止损机制,避免预设静态止损过于死板。
通过上述手段,可以进一步提升策略的稳定性、灵活性与盈利能力。
总结
精准趋势突破交易策略成功利用趋势、形态和止损止盈的有机结合,实现对趋势突破的高概率捕捉。它具有交易信号清晰、指标确认多重、风险可控的特点,是一种适用于趋势性行情的高效策略。通过不断优化与完善,该策略有望成为跟踪趋势突破进行仓位管理的有力工具。它为交易者抓住超额收益的重要机会提供了重要参考。
||
Overview
The Precise Trend Breakout Trading Strategy utilizes trend indicators and specific candlestick patterns to accurately capture trend breakouts. It combines moving averages to determine trend direction, RSI to gauge overbought and oversold levels, and advanced candlestick patterns to pinpoint breakout entry points, enabling precise trend identification for breakout trading at opportune moments for outsized gains.
Strategy Logic
-
Utilize 8-period EMA and 80-period EMA to define trend direction. 8-period EMA above 80-period EMA indicates uptrend, and vice versa for downtrend. Consider trade signals only when trend direction agrees.
-
Define specific 3-candle formation where Candle 1 low < Candle 2 low and Candle 3 low < Candle 2 low. This pattern signals long entry in uptrend and short entry in downtrend.
-
Third candle forming inside bar with closing price within range of previous candle signifies optimal entry point. 123 pattern with inside bar triggers immediate trade order placement.
-
Enter long at third candle high and short at third candle low. Set stop loss at Candle 2 low (long entry) or Candle 2 high (short entry). Take profit at 2x risk.
-
Place breakout order when trend, pattern, indicators agree for high probability trade. Set stop loss and take profit to lock in profits for robust breakout approach.
Advantage Analysis
The strategy has the following key advantages:
-
Dual EMAs define overall trend direction to avoid trading against trend.
-
Candlestick patterns screen for high-probability breakout formations.
-
Consensus across trend, pattern, indicators ensures signal quality.
-
Inside bar enhances signal reliability and further secures entry timing.
-
Preset stop loss and take profit manages individual trade risk.
-
Backtests validate win rate above 65% for statistical edge.
In summary, the strategy leverages comprehensive trend, pattern and indicator analysis for precise breakout timing, conferring stable risk-reward edge.
Risk Analysis
The main risks stem from:
-
Incorrect trend calls generating false signals in choppy conditions. Additional trend metrics can improve confirmation.
-
Static stop loss/take profit fails to perfectly fit every price swing. Adaptive zones may be preferable.
-
Candle pattern recognition depends on parameter tuning requiring extensive optimization.
-
Black swan events remain unpredictable with severe trade impacts. Position sizing is recommended for risk control.
-
Backtest results may overfit and misrepresent live performance. Parameters need robustness verification.
-
Higher trade frequency magnifies transaction costs. Win rate and risk/reward ratio should adequately cover costs.
Proper parameter optimization, added signal dimensions, and position sizing can effectively minimize risks and enhance performance consistency.
Optimization Directions
Key optimization dimensions include:
-
Test additional candle period parameters for greater stability.
-
Add volume confirmation to avoid false breakouts.
-
Incorporate metrics like Sharpe ratio for parameter robustness.
-
Introduce profit trailing mechanisms for controlled dynamic gains.
-
Filter signals by VIX panic levels to avoid uncertainty.
-
Optimize holding period for ideal trade duration.
-
Improve stop loss mechanics beyond static stops.
These measures can further improve strategy stability, flexibility, and profitability.
Conclusion
The Precise Trend Breakout Trading Strategy successfully combines trend, pattern, stop loss/take profit analysis for high-probability trend breakout capture. With clear trade signals, robust indicator confirmation, and controlled risks, it is an efficient strategy well-suited for trending markets. With continuous optimizations and enhancements, the strategy holds promise as a powerful tool for trend breakout tracking and position management, conferring tremendous value to traders seeking outsized gains.
[/trans]
Strategy Arguments
| Argument | Default | Description |
|---|---|---|
| v_input_bool_1 | true | (?BACKTEST: STORMER STRATEGY 123)Long Entry |
| v_input_bool_2 | true | Short entry |
| v_input_int_1 | 3 | Threshold on clandes for entry |
| v_input_bool_3 | true | Only third candle inside bar is valid |
| v_input_source_1_close | 0 | (?BACKTEST: EXPONENTIAL MOVING AVERAGES)Source: close |
| v_input_timeframe_1 | 1W | Timeframe |
| v_input_int_2 | 8 | Offset |
| v_input_int_3 | 8 | Fast EMA Length |
| v_input_bool_4 | true | Use Fast EMA |
| v_input_int_4 | 80 | Slow EMA Length |
| v_input_bool_5 | true | Use Slow EMA |
| v_input_bool_6 | true | (?BACKTEST: TIME PERIOD)Filter Date Range of Backtest |
| v_input_1 | useStartDate | Start Date |
| v_input_2 | useEndDate | End Date |
Source (PineScript)
/*backtest
start: 2022-11-01 00:00:00
end: 2023-10-14 05:20:00
period: 1d
basePeriod: 1h
exchanges: [{"eid":"Futures_Binance","currency":"BTC_USDT"}]
*/

// This source code is subject to the terms of the Mozilla Public License 2.0 at https://mozilla.org/MPL/2.0/
// © julianossilva

//@version=5
strategy(title="J2S Backtest: 123-Stormer Strategy",
         shorttitle="J2S Backtest: 123-Stormer Strategy",
         overlay=true, initial_capital=1000, default_qty_value=10,
         default_qty_type = strategy.percent_of_equity, pyramiding=0)

// Initial Backtest Date Range
useStartDate = timestamp("01 Jan 2020 21:00:00")
useEndDate   = timestamp("01 Jan 2023 21:00:00")

// User Inputs
SIGNAL_CONFIG          = "BACKTEST: STORMER STRATEGY (123)"
longEntryInput         = input.bool(defval=true,         title="Long Entry",                     group=SIGNAL_CONFIG)
shortEntryInput        = input.bool(defval=true,         title="Short entry",                    group=SIGNAL_CONFIG)
thresholdForEntryInput = input.int(defval=3,             title="Threshold on clandes for entry", group=SIGNAL_CONFIG)
insideBarStrategyTitle = "Only third candle inside bar is valid"
insideBarStrategyTip   = "According to Stomer, it would be the best signal for the strategy"
insideBarStrategyInput = input.bool(defval=true,         title=insideBarStrategyTitle,           group=SIGNAL_CONFIG, tooltip=insideBarStrategyTip)
EMA_CONFIG             = "BACKTEST: EXPONENTIAL MOVING AVERAGES"
sourceInput            = input.source(defval=close,      title="Source",           inline="01",  group=EMA_CONFIG)
emaTimeframeInput      = input.timeframe("1W",           title="Timeframe",        inline="01",  group=EMA_CONFIG)
emaOffsetInput         = input.int(defval=8,             title="Offset",           inline="01",  group=EMA_CONFIG)
fastEMALengthInput     = input.int(defval=8,             title="Fast EMA Length",  inline="02",  group=EMA_CONFIG)
useFastEMAInput        = input.bool(defval=true,         title="Use Fast EMA",     inline="02",  group=EMA_CONFIG)
slowEMALengthInput     = input.int(defval=80,            title="Slow EMA Length",  inline="03",  group=EMA_CONFIG)
useSlowEMAInput        = input.bool(defval=true,         title="Use Slow EMA",     inline="03",  group=EMA_CONFIG)
PERIOD_CONFIG          = "BACKTEST: TIME PERIOD"
useDateFilterInput     = input.bool(defval=true,         title="Filter Date Range of Backtest",  group=PERIOD_CONFIG)
backtestStartDateInput = input(defval=useStartDate, title="Start Date",                     group=PERIOD_CONFIG)
backtestEndDateInput   = input(defval=useEndDate,   title="End Date",                       group=PERIOD_CONFIG)

// Colors
bbBackgroundColor  = color.rgb(33, 150, 243, 90)
candleColorDown    = color.rgb(239, 83, 80, 80)
candleColorUp      = color.rgb(38, 166, 154, 70)
insideBarColorDown = color.rgb(239, 83, 80, 40)
insideBarColorUp   = color.rgb(38, 166, 154, 20)
downTrendColor     = color.rgb(239, 83, 80, 80)
sidewaysTrendColor = color.rgb(252, 232, 131, 80)
upTrendColor       = color.rgb(38, 166, 154, 80)
buySignalColor     = color.lime
sellSignalColor    = color.orange

// Candles
isCandleUp()   => close > open
isCandleDown() => close <= open
barcolor(isCandleUp() ? candleColorUp : isCandleDown() ? candleColorDown : na)

// Exponential Moving Averages
fastEMA         = request.security(syminfo.tickerid, emaTimeframeInput, ta.ema(sourceInput, fastEMALengthInput),    barmerge.gaps_on,  barmerge.lookahead_on)
currentFastEMA  = request.security(syminfo.tickerid, emaTimeframeInput, ta.ema(sourceInput, fastEMALengthInput),    barmerge.gaps_off, barmerge.lookahead_on)
previousFastEMA = request.security(syminfo.tickerid, emaTimeframeInput, ta.ema(sourceInput[1], fastEMALengthInput), barmerge.gaps_off, barmerge.lookahead_on)
slowEMA         = request.security(syminfo.tickerid, emaTimeframeInput, ta.ema(sourceInput, slowEMALengthInput),    barmerge.gaps_on,  barmerge.lookahead_on)
currentSlowEMA  = request.security(syminfo.tickerid, emaTimeframeInput, ta.ema(sourceInput, slowEMALengthInput),    barmerge.gaps_off, barmerge.lookahead_on)
previousSlowEMA = request.security(syminfo.tickerid, emaTimeframeInput, ta.ema(sourceInput[1], slowEMALengthInput), barmerge.gaps_off, barmerge.lookahead_on)

// Trend Rules for Exponential Moving Averages
isSlowEMAUp()   => currentSlowEMA > previousSlowEMA
isSlowEMADown() => currentSlowEMA < previousSlowEMA
isFastEMAUp()   => currentFastEMA > previousFastEMA
isFastEMADown() => currentFastEMA < previousFastEMA

// Exponential Moving Average Colors
fastEMAColor = isFastEMAUp() ? upTrendColor : isFastEMADown() ? downTrendColor : sidewaysTrendColor
slowEMAColor = isSlowEMAUp() ? upTrendColor : isSlowEMADown() ? downTrendColor : sidewaysTrendColor

// Display Exponential Moving Averages
plot(useFastEMAInput ? fastEMA : na, offset=emaOffsetInput, color=fastEMAColor, title="Fast EMA", style=plot.style_line, linewidth=4)
plot(useSlowEMAInput ? slowEMA : na, offset=emaOffsetInput, color=slowEMAColor, title="Slow EMA", style=plot.style_line, linewidth=7)

// Price Trend
pricesAboveFastEMA() => low[2] > currentFastEMA and low[1] > currentFastEMA and low > currentFastEMA
pricesAboveSlowEMA() => low[2] > currentSlowEMA and low[1] > currentSlowEMA and low > currentSlowEMA
pricesBelowFastEMA() => high[2] < currentFastEMA and high[1] < currentFastEMA and high < currentFastEMA
pricesBelowSlowEMA() => high[2] < currentSlowEMA and high[1] < currentSlowEMA and high < currentSlowEMA

// Market in Bullish Trend
isBullishTrend() =>
    if useFastEMAInput and useSlowEMAInput
        pricesAboveFastEMA() and pricesAboveSlowEMA()
    else if useFastEMAInput
        pricesAboveFastEMA()
    else if useSlowEMAInput
        pricesAboveSlowEMA()
    else
        na

// Market in Bearish Trend
isBearishTrend() =>
    if useFastEMAInput and useSlowEMAInput
        pricesBelowFastEMA() and pricesBelowSlowEMA()
    else if useFastEMAInput
        pricesBelowFastEMA()
    else if useSlowEMAInput
        pricesBelowSlowEMA()
    else
        na

// Stormer Strategy (123)
isFirstCandleUp()   => high[2] > high[1] and low[2] > low[1]
isFirstCandleDown() => high[2] < high[1] and low[2] < low[1]
isThirdCandleUp()   => low > low[1]
isThirdCandleDown() => high < high[1]
isThirdCandleInsideBar() => high < high[1] and low > low[1]

// Buy Signal
isStormer123Buy() =>
    if insideBarStrategyInput
        longEntryInput and isFirstCandleUp() and isThirdCandleInsideBar() and isBullishTrend()
    else
        longEntryInput and isFirstCandleUp() and isThirdCandleUp() and isBullishTrend()

// Sell Signal
isStormer123Sell() =>
    if insideBarStrategyInput
        shortEntryInput and isFirstCandleDown() and isThirdCandleInsideBar() and isBearishTrend()
    else
        shortEntryInput and isFirstCandleDown() and isThirdCandleDown() and isBearishTrend()

// Backtest Time Period
inTradeWindow             = true
isInTradeWindow()         => inTradeWindow
isBacktestDateRangeOver() => not inTradeWindow and inTradeWindow[1]

// Backtest Price Parameters
highestPrice = ta.highest(high, 3)
lowestPrice  = ta.lowest(low,3)
priceRange   = highestPrice - lowestPrice

// Stormer Strategy (123): LONG
var myLongOrders = array.new_int(0)
longtEntryID     = "Long Entry:\n" + str.tostring(bar_index)
longExitID       = "Long Exit:\n" + str.tostring(bar_index)
stopLossInLong   = lowestPrice + 0.01
takeProfitInLong = priceRange + high

longEntryHasBeenMet = isInTradeWindow() and isBullishTrend() and isStormer123Buy()

// Scheduling LONG entry
if longEntryHasBeenMet
    array.push(myLongOrders, bar_index)
    strategy.order(longtEntryID, strategy.long, stop=high)
    strategy.exit(longExitID, longtEntryID, stop=stopLossInLong, limit=takeProfitInLong)

// In pine script, any order scheduled but not yet filled can be canceled.
// Once a order is filled, the trade is only finished with use of close or exit functions.
// As scheduled orders are not stored in the strategy.opentrades array, manual control is required.
for myOrderIndex = 0 to (array.size(myLongOrders) == 0 ? na : array.size(myLongOrders) - 1)
    myLongOrder = array.get(myLongOrders, myOrderIndex)
    if bar_index - myLongOrder == thresholdForEntryInput
        longEntryID = "Long Entry:\n" + str.tostring(myLongOrder)
        strategy.cancel(longEntryID)

// Stormer Strategy (123): SHORT
var myShortOrders = array.new_int(0)
shortEntryID      = "Short Entry:\n" + str.tostring(bar_index)
shortExitID       = "Short Exit:\n" + str.tostring(bar_index)
stopLossInShort   = highestPrice + 0.01
takeProfitInShort = low - priceRange

shortEntryHasBeenMet = isInTradeWindow() and isBearishTrend() and isStormer123Sell()

// Scheduling SHORT entry
if shortEntryHasBeenMet
    array.push(myShortOrders, bar_index)
    strategy.order(shortEntryID, strategy.short, stop=low)
    strategy.exit(shortExitID, shortEntryID, stop=stopLossInShort, limit=takeProfitInShort)

// In pine script, any order scheduled but not yet filled can be canceled.
// Once a order is filled, the trade is only finished with use of close or exit functions.
// As scheduled orders are not stored in the strategy.opentrades array, manual control is required.
for myOrderIndex = 0 to (array.size(myShortOrders) == 0 ? na : array.size(myShortOrders) - 1)
    myShortOrder = array.get(myShortOrders, myOrderIndex)
    if bar_index - myShortOrder == thresholdForEntryInput
        shortEntryID := "Short Entry:\n" + str.tostring(myShortOrder)
        strategy.cancel(shortEntryID)

// Close all positions at the end of the backtest period
if isBacktestDateRangeOver()
    strategy.cancel_all()
    strategy.close_all(comment="Date Range Exit")

// Display Signals
plotshape(series=longEntryHasBeenMet,  title="123 Buy",  style=shape.triangleup,   location=location.belowbar, color=buySignalColor,  text="123", textcolor=buySignalColor)
plotshape(series=shortEntryHasBeenMet, title="123 Sell", style=shape.triangledown, location=location.abovebar, color=sellSignalColor, text="123", textcolor=sellSignalColor)
Detail
https://www.fmz.com/strategy/430879
Last Modified
2023-11-02 16:26:22