
8.0 KiB
Name
突破回补价格策略Break-even-Price-Strategy
Author
ChaoZhang
Strategy Description
 [trans]
概述
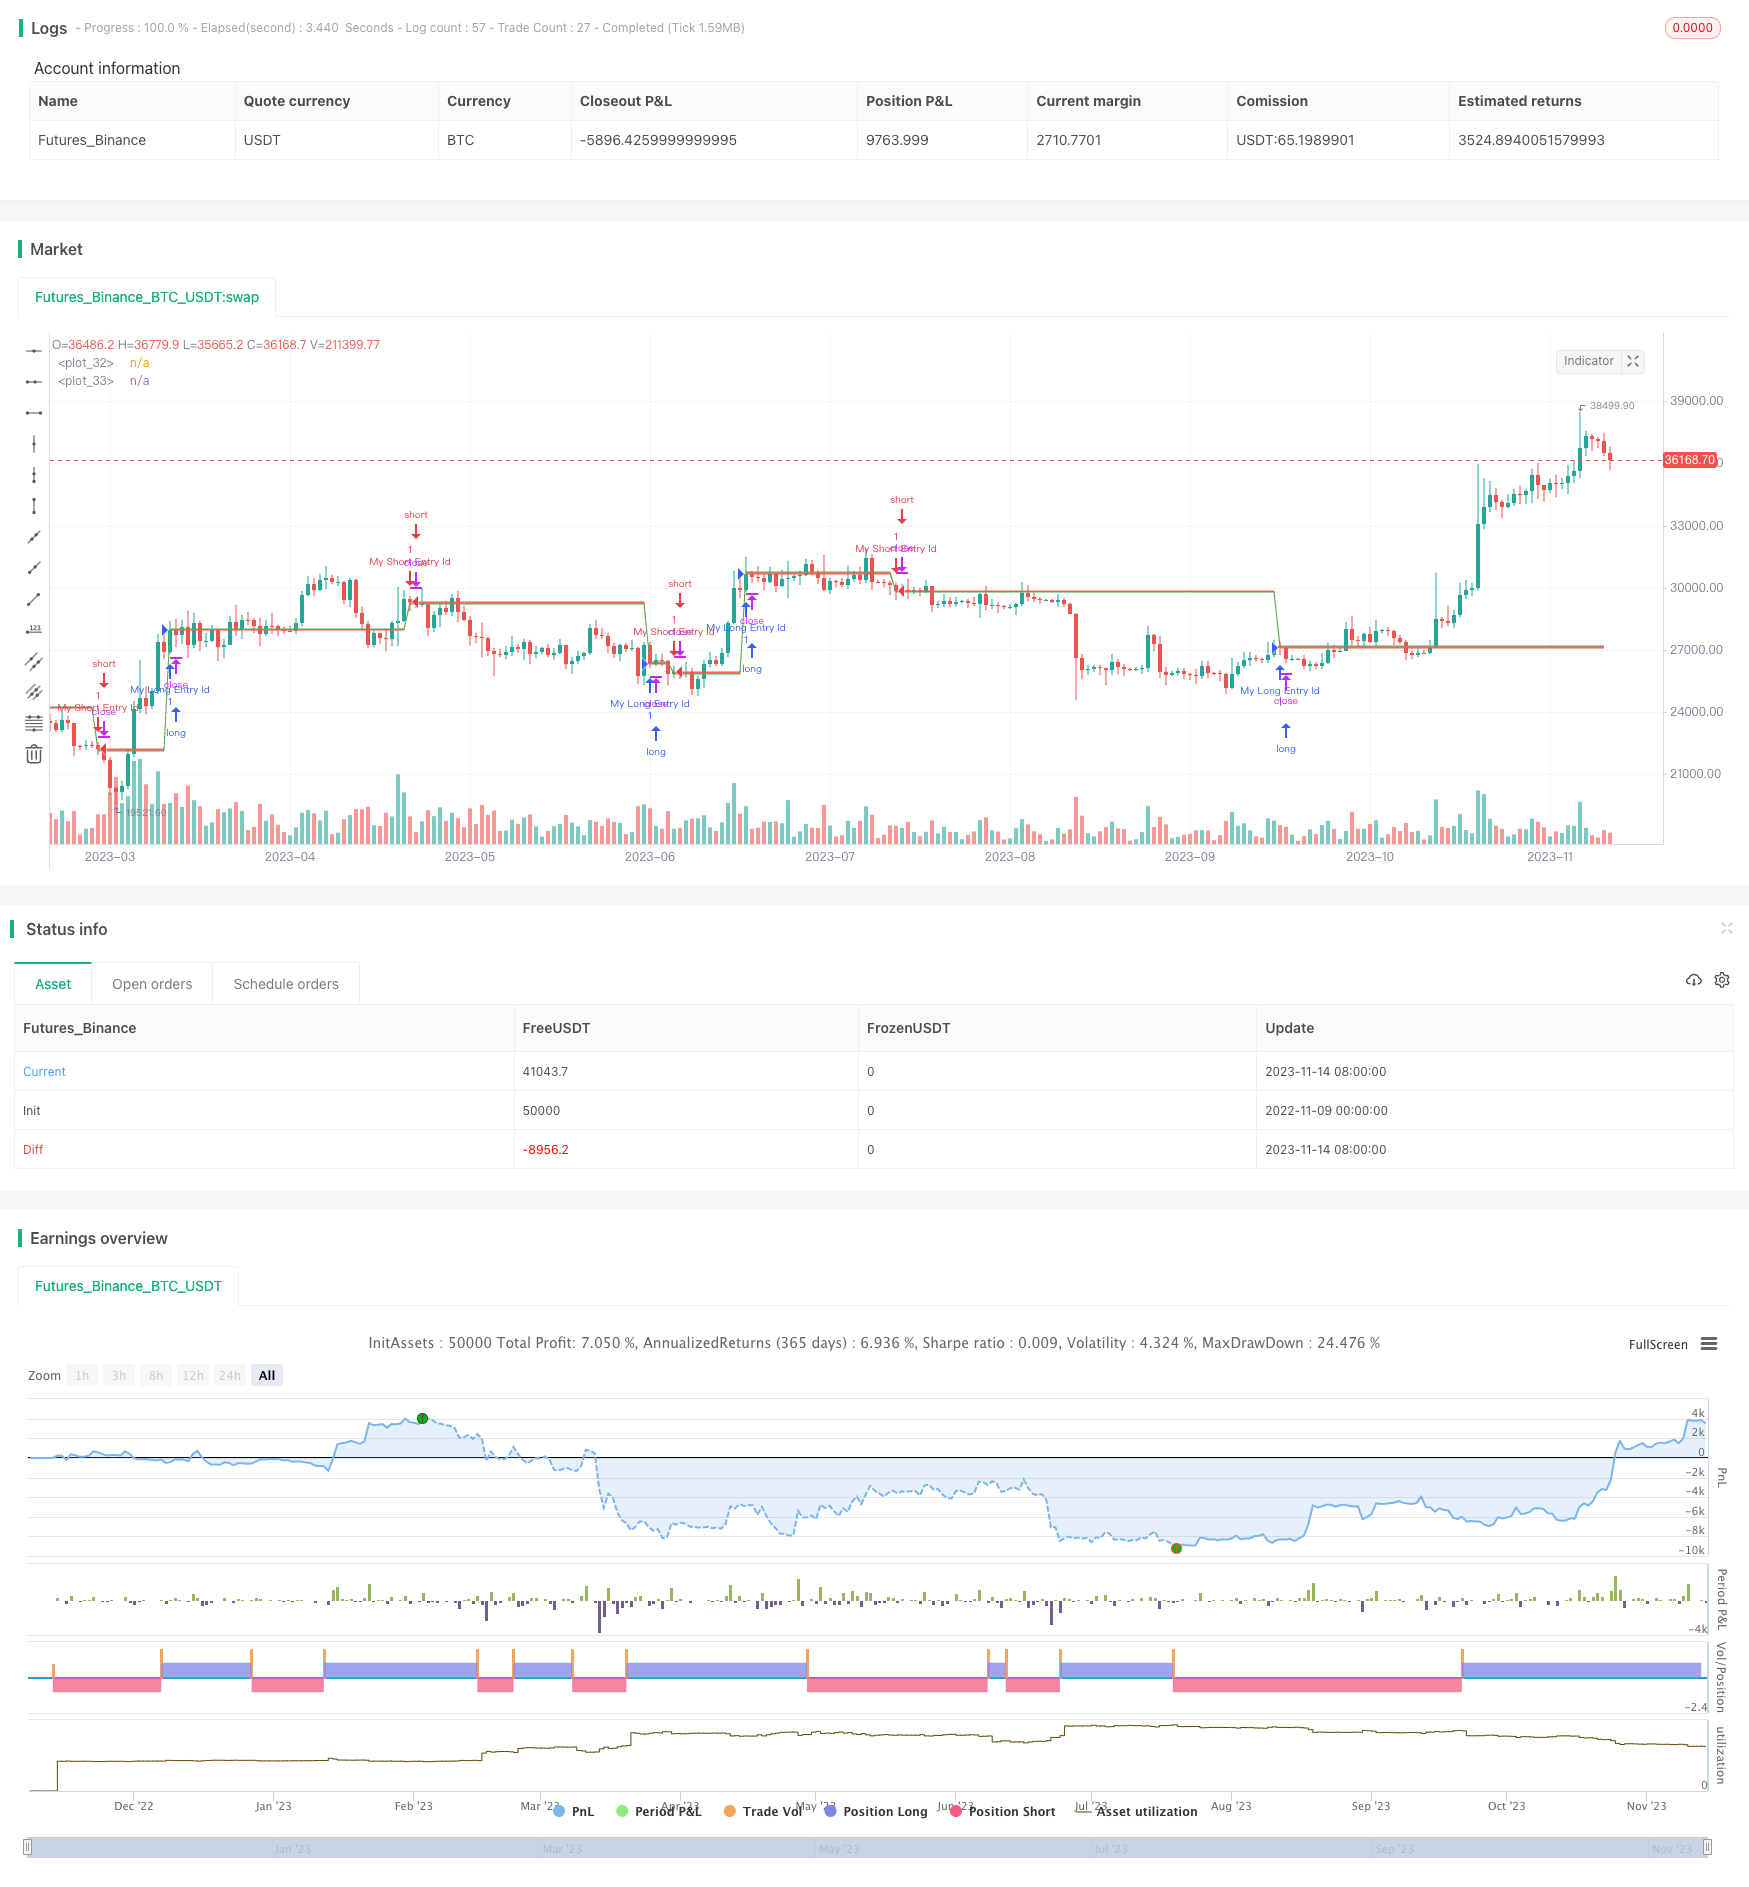
该策略的主要思想是在开仓后绘制入场价和保本价,以直观显示价格突破入场价即可获得收益的位置。这可以帮助交易者更好地管理仓位,实现盈利回收。
策略原理
代码通过SMA金叉做多,SMA死叉做空开仓。然后计算入场价和考虑手续费后的保本价。保本价计算方式是:做多时,保本价是入场价乘以(1+手续费);做空时,保本价是入场价乘以(1-手续费)。最后绘制入场价线和保本价线,在两线之间填充颜色。
这样一来,只要价格突破入场价线,就说明已经盈利了。交易者可以根据保本价线来设置止盈位或止损位,从而锁定盈利。
代码主要分为:
- 开仓条件判断
- 入场价和保本价计算
- 绘制入场价线和保本价线
- 填充两线之间颜色
通过简单的条件判断开仓,计算保本价,绘制辅助线的方式就实现了这个突破回补价格策略。
策略优势分析
该策略具有以下优势:
-
直观显示盈亏情况,可以快速判断价格是否达到盈利要求。
-
可以根据保本价线来设置止盈止损位,避免亏损扩大。
-
代码简洁易懂,容易实现和调整。
-
可以融入自己的交易策略中,利用保本价线来管理仓位。
-
可以方便修改手续费参数,适用于不同交易所和品种。
-
可以通过调整SMA周期来优化开仓条件。
策略风险分析
该策略也存在一定的风险:
-
SMA指标本身滞后性较强,可能出现错过价格变化的情况。
-
保本价线并不能完全避免亏损的产生和扩大。
-
策略本身没有退出机制,需要交易者自己监控盈亏情况。
-
手续费设置不准可能导致保本价计算错误。
-
策略没有考虑滑点的影响。
-
策略缺乏止损机制,可能导致大亏损。
对应风险的解决方案是:
-
可以考虑换用更活跃的指标,如MACD。
-
应该结合趋势指标确定大方向,避免逆势开仓。
-
需要加入止盈止损逻辑,让策略可以自动退出。
-
应该根据实际交易所设置准确的手续费。
-
可以设置固定滑点来优化入场出场。
-
增加移动止损来控制最大损失。
策略优化方向
该策略可以从以下几个方面进行优化:
-
替换SMA指标为MACD或KDJ等更先进指标。
-
增加趋势判断指标,避免逆势开仓。
-
优化SMA周期参数,提高开仓精确度。
-
加入止盈止损逻辑,让策略可以自动退出。
-
设置回测和实盘的滑点控制。
-
优化手续费参数,使其贴近实际交易。
-
增加移动止损来限制最大亏损。
-
可以在不同时间周期复制策略,进行多周期组合。
-
结合交易量变化优化入场。
-
可以通过机器学习算法来优化参数。
总结
该策略直观地展示了价格突破入场价即可盈利的位置,是一种简单实用的辅助策略。它具有代码简洁,易于实现等优点,但也存在一些风险需要注意。我们可以从多个角度对策略进行优化和改进,使其适用更广泛,具有更强的稳定性和盈利能力。总体来说,该策略为我们提供了一个非常好的参考案例,值得我们进一步研究和应用。
||
Overview
The main idea of this strategy is to plot the entry price and breakeven price after opening a position, to visually display the price level where a breakout above the entry price would result in profit. This can help traders better manage positions and realize profits.
Strategy Logic
The code enters long when SMA crossover happens and enters short on SMA crossunder. It then calculates the entry price and breakeven price after fees. The breakeven price is calculated as: for long, breakeven price = entry price * (1 + fees); for short, breakeven price = entry price * (1 - fees). Finally, it plots the entry price line and breakeven price line, filling the area between them.
This way, once the price breaks through the entry price line, it means the trade is now profitable. Traders can use the breakeven line to set take profit or stop loss levels to lock in profits.
The key components of the code are:
- Entry condition checks
- Calculation of entry and breakeven prices
- Plotting the entry and breakeven price lines
- Filling color between the two lines
With simple condition checks for entry, breakeven price calculation, and plotting of auxiliary lines, the break-even price strategy is implemented.
Advantage Analysis
The advantages of this strategy include:
-
Intuitive display of profit/loss, can quickly judge if price has reached profit target.
-
Can use breakeven line to set take profit/stop loss levels to avoid increasing losses.
-
Simple and easy to understand code, easy to implement and adjust.
-
Can be incorporated into own trading strategies, using breakeven line to manage positions.
-
Easy to modify fee parameters for different exchanges and products.
-
Can optimize entry by adjusting SMA periods.
Risk Analysis
The risks of this strategy include:
-
SMA has lagging nature, may miss price changes.
-
Breakeven line cannot completely avoid losses.
-
No exit mechanism, traders need to monitor P/L themselves.
-
Incorrect fee settings may cause wrong breakeven calculation.
-
Slippage is not considered.
-
No stop loss, may lead to large losses.
The solutions are:
-
Consider more sensitive indicators like MACD.
-
Add trend indicator to avoid counter trend trades.
-
Add take profit and stop loss logic for automatic exits.
-
Set accurate fees based on actual exchange.
-
Add fixed slippage for optimal entries and exits.
-
Add trailing stop loss to limit max loss.
Improvement Areas
Some ways to optimize the strategy:
-
Replace SMA with more advanced indicators like MACD or KDJ.
-
Add trend filter to avoid counter trend trades.
-
Optimize SMA periods for better entry precision.
-
Add take profit and stop loss logic for automatic exits.
-
Set slippage for backtest and live trading.
-
Optimize fee settings to match reality.
-
Add trailing stop loss to limit max loss.
-
Run strategy on multiple timeframes for diversification.
-
Incorporate volume changes to improve entry.
-
Use machine learning to optimize parameters.
Conclusion
This strategy intuitively displays the breakeven price level where a breakout can result in profits. It is a simple and practical auxiliary strategy with advantages like simple code and easy implementation. But risks need to be addressed too. We can optimize it from many aspects to make it more robust and profitable. Overall it provides a great reference example worth studying and applying.
[/trans]
Strategy Arguments
| Argument | Default | Description |
|---|---|---|
| v_input_1 | 0.25 | Price Change in % |
Source (PineScript)
/*backtest
start: 2022-11-15 00:00:00
end: 2023-11-15 00:00:00
period: 1d
basePeriod: 1h
exchanges: [{"eid":"Futures_Binance","currency":"BTC_USDT"}]
*/

// © NikitaDoronin
//@version=4

strategy("Plot Break-even Price", overlay=true)

/// Break-even calculation
ep = 0.0
ep := na(ep[1]) ? na : ep[1]

p = 0.0
p := na(p[1]) ? na : p[1]

/// Fees Input
fee_inp = input(0.25, title='Price Change in %', step=0.1)/100

/// Your Strategy calculation
longCondition = crossover(sma(close, 14), sma(close, 28))
shortCondition = crossunder(sma(close, 14), sma(close, 28))

/// Stategy Entry
if (longCondition)
    ep := close
    p := close * (1 + fee_inp)
    strategy.entry("My Long Entry Id", strategy.long)

if (shortCondition)
    ep := close
    p := close * (1 - fee_inp)
    strategy.entry("My Short Entry Id", strategy.short)

/// Plot Break-even Price
p1 = plot(ep, color = color.red, transp = 85)
p2 = plot(p, color = color.green)
fill(p1, p2, color = color.red, transp = 85)
Detail
https://www.fmz.com/strategy/432310
Last Modified
2023-11-16 11:16:25