
9.0 KiB
Name
移动平均线交叉指标与反转指标组合策略Moving-Average-Crossover-and-Reversal-Indicator-Combination-Strategy
Author
ChaoZhang
Strategy Description
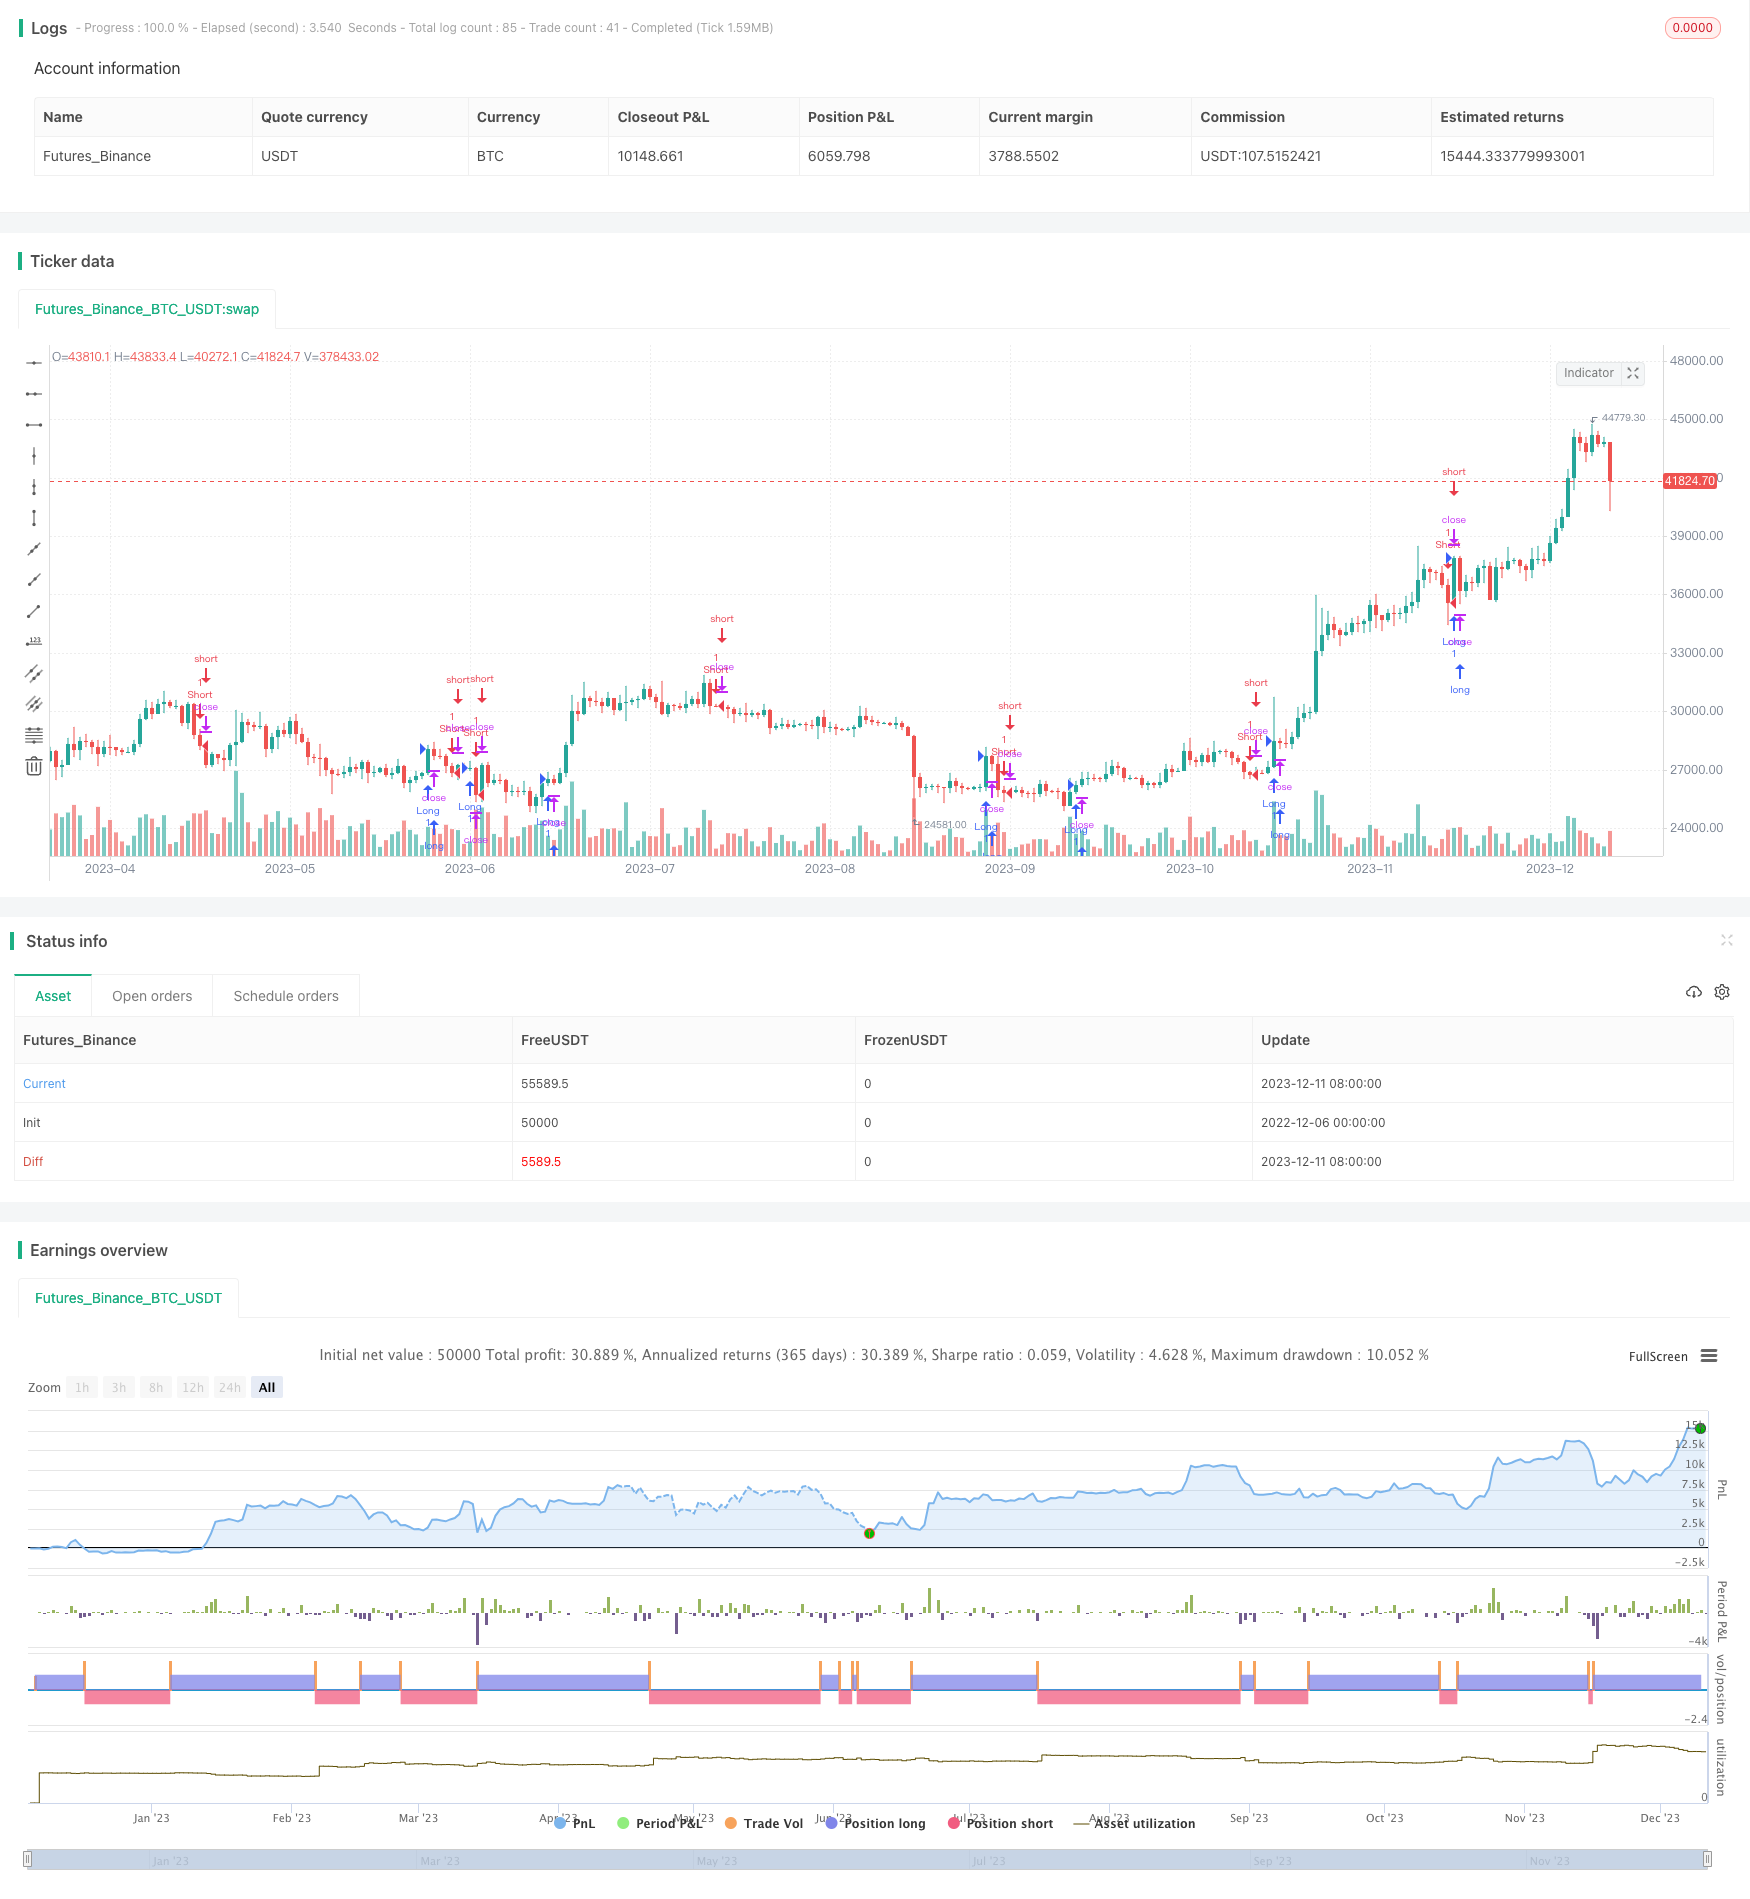 [trans]
概述
本策略融合了移动平均线、相对强度指数和商品频道指数三个指标,形成一个较为完整的趋势跟踪和指标组合策略。其基本思路是在趋势指标确认趋势形成后,利用反转信号指标实现更准确的入场。
策略原理
-
使用hl2计算中价。
-
计算14周期的CCI指标,判断大级别趋势。当CCI大于0时为趋势向上,小于0时为趋势向下。
-
计算14周期RSI指标的快线和50周期RSI指标的慢线。当快线上穿慢线时产生买入信号,快线下穿慢线时产生卖出信号。
-
只有CCI指标同时符合RSI指标的信号方向时,才产生实际的交易信号。即只在CCI大于0和RSI快线上穿慢线时买入,只在CCI小于0和RSI快线下穿慢线时卖出。
-
通过计算价格是否高于或低于14周期hl2的移动平均来辅助判断细节走势,从而避免假突破。只有价格高于hl2的14周期均线和RSI指标上穿时才产生买入信号,只有价格低于hl2的14周期均线和RSI指标下穿时才产生卖出信号。
优势分析
-
该策略融合了趋势判断和反转信号,能够在趋势开始后及时入场,并通过反转信号指标判断退出点,从而获得较好的绩效。
-
商品频道指数对大级别趋势判断准确,避免了错误的交易方向选择。
-
相对强度指数的快慢线交叉作为启示信号较为稳定可靠,避免了移动平均线的滞后问题,可以及时捕捉到价格的回转。
-
比较价格和中值线的大小,可以进一步过滤假突破导致的错误信号。
-
整体来说,该策略稳定性较好,在强势趋势中表现突出。
风险分析
-
该策略对交易品种比较敏感,需要针对特定品种优化参数。如果盲目应用于所有品种,可能导致不稳定的表现。
-
策略参数设置如14周期均线和50周期均线等,需要根据不同市场调整。如果参数设定不当也会导致表现不佳。
-
单纯依赖CCI判断大级别趋势方向还不够完善,会存在一定的滞后。这点仍需进一步优化。
-
反转信号指标组合较多,可能存在一定程度的过度优化。这点也需要通过严格的回测检验。
优化方向
-
可以考虑加入更多判断大级别趋势的指标,如DMI、ADX等,使趋势判断更加精确。
-
增加止损逻辑。如在反转信号出现后,如果价格再次回调一定幅度,可以考虑止损退出,降低损失。
-
优化参数,使其更适应特定交易品种。如增大慢线周期参数,或调整中价计算方式等。
-
构建参数优化组合,针对不同品种选择最优参数,这样可以大幅提高策略适用性。
-
加入量能指标,避免在量能不足时产生误导信号。
总结
该策略整体框架完整,融合趋势判断和反转指标,在理论上可以获得较优秀的绩效。但实际应用中仍需要针对交易品种进行参数和模型优化,降低过拟合风险。如果经过严格的统计检验,有望成为一款值得推荐的稳定策略。
||
Overview
This strategy integrates moving average, relative strength index and commodity channel index, forming a relatively complete trend tracking and indicator combination strategy. Its basic idea is to implement more accurate entry after the trend indicator confirms the trend formation.
Strategy Principle
-
Use hl2 to calculate the mid price.
-
Calculate the 14-period CCI indicator to judge the major trend. When CCI is greater than 0, the trend is upward. When less than 0, the trend is downward.
-
Calculate the fast line of the 14-period RSI indicator and the slow line of the 50-period RSI indicator. When the fast line crosses above the slow line, a buy signal is generated. When the fast line crosses below the slow line, a sell signal is generated.
-
Actual trading signals are generated only when the CCI indicator also matches the signal direction of the RSI indicator. That is, buy only when CCI is greater than 0 and RSI fast line crosses above slow line, and sell only when CCI is less than 0 and RSI fast line crosses below slow line.
-
Compare the price with the 14-period moving average of hl2 to assist in judging the minor trend, so as to avoid false breakouts. A buy signal is generated only when the price is above the 14-period moving average of hl2 and the RSI indicator crosses up. A sell signal is generated only when the price is below the 14-period moving average of hl2 and the RSI indicator crosses down.
Advantage Analysis
-
This strategy integrates trend judgment and reversal signals to get in in time after the start of the trend, and uses reversal signal indicators to determine exit points, thereby obtaining better returns.
-
The commodity channel index accurately determines major trend directions, avoiding incorrect choices of trading directions.
-
The fast and slow line crossovers of the relative strength index serve as reliable enabling signals, avoiding the lag problem of moving averages, and can timely capture price reversals.
-
Comparing prices with median lines can further filter out false breakouts that cause erroneous signals.
-
Overall, this strategy has good stability and performs well in strong trends.
Risk Analysis
-
This strategy is sensitive to trading varieties, requiring parameter optimization for specific varieties. Blind application to all varieties may lead to unstable performance.
-
Parameter settings such as 14-period moving averages and 50-period moving averages need to be adjusted according to different markets. Improper parameter settings can also lead to poor performance.
-
Relying solely on CCI to determine major trend direction is still not perfect enough, with some lag. This part still needs further optimization.
-
The combination of reversal signal indicators is relatively large, which may lead to a certain degree of over-optimization. This also needs to be strictly tested back.
Optimization Directions
-
Consider adding more indicators to judge major trends, such as DMI, ADX, etc., to make trend judgments more precise.
-
Increase stop loss logic. For example, after a reversal signal appears, if the price callbacks again by a certain amplitude, stop loss exit can be considered to reduce losses.
-
Optimize parameters to make them more suitable for specific trading varieties. For example, increase the cycle parameter of the slow line, or adjust the mid price calculation method, etc.
-
Build a parameter optimization combination to select the optimal parameters for different varieties, which can greatly improve the applicability of strategies.
-
Add momentum indicators to avoid misleading signals when momentum is insufficient.
Conclusion
The overall framework of this strategy is complete, integrating trend judgment and reversal indicators, which can theoretically obtain excellent performance. But in actual application, it still needs parameter and model optimization for trading varieties to reduce the risk of overfitting. If it passes strict statistical testing, it has the potential to become a stable strategy worth recommending.
[/trans]
Source (PineScript)
/*backtest
start: 2022-12-06 00:00:00
end: 2023-12-12 00:00:00
period: 1d
basePeriod: 1h
exchanges: [{"eid":"Futures_Binance","currency":"BTC_USDT"}]
*/

// This source code is subject to the terms of the Mozilla Public License 2.0 at https://mozilla.org/MPL/2.0/
// © SuchitRaju

//@version=4
strategy("MA RSI CCI")

price_up = if(close > open and close > sma(hl2,14))
    1
else
    0

price_down = if(open > close and close < sma(hl2,14))
    1
else
    0
//

cci_indicator = cci(hl2, 14)
// plot(cci_indicator, color=color.blue)

rsi_slow = sma(rsi(close, 14), 50)
// plot(rsi_slow, color=color.red)

rsi_fast = rsi(close, 14)
// plot(rsi_fast, color=color.green)

isCrossover = if(rsi_fast > rsi_slow and cci_indicator > 0)
    1
else
    0
// plotshape(isCrossover, style = shape.arrowup, color = color.green, size = size.huge)

isCrossunder = if(rsi_fast < rsi_slow and cci_indicator < 0)
    1
else
    0
// plotshape(isCrossunder, style = shape.arrowup, color = color.red, size = size.huge)

// start = timestamp("GMT-5", 2016,9,1,0,0)
// end = timestamp("GMT-5", 2017,9,1,0,0)

// strategy.entry("Long", strategy.long, 1, when = isCrossover and price_up)
// strategy.entry("Short", strategy.short, 1, when = isCrossunder and price_down)
// strategy.close("Long", when = isCrossunder and price_down)
// strategy.close("Short", when = isCrossover and price_up)

strategy.entry("Long", strategy.long, 1, when = isCrossover)
strategy.entry("Short", strategy.short, 1, when = isCrossunder)
strategy.close("Long", when = isCrossunder)
strategy.close("Short", when = isCrossover)
Detail
https://www.fmz.com/strategy/435245
Last Modified
2023-12-13 15:20:20