
8.5 KiB
Name
移动平均百分比波段策略Percentage-Band-Moving-Average-Strategy
Author
ChaoZhang
Strategy Description
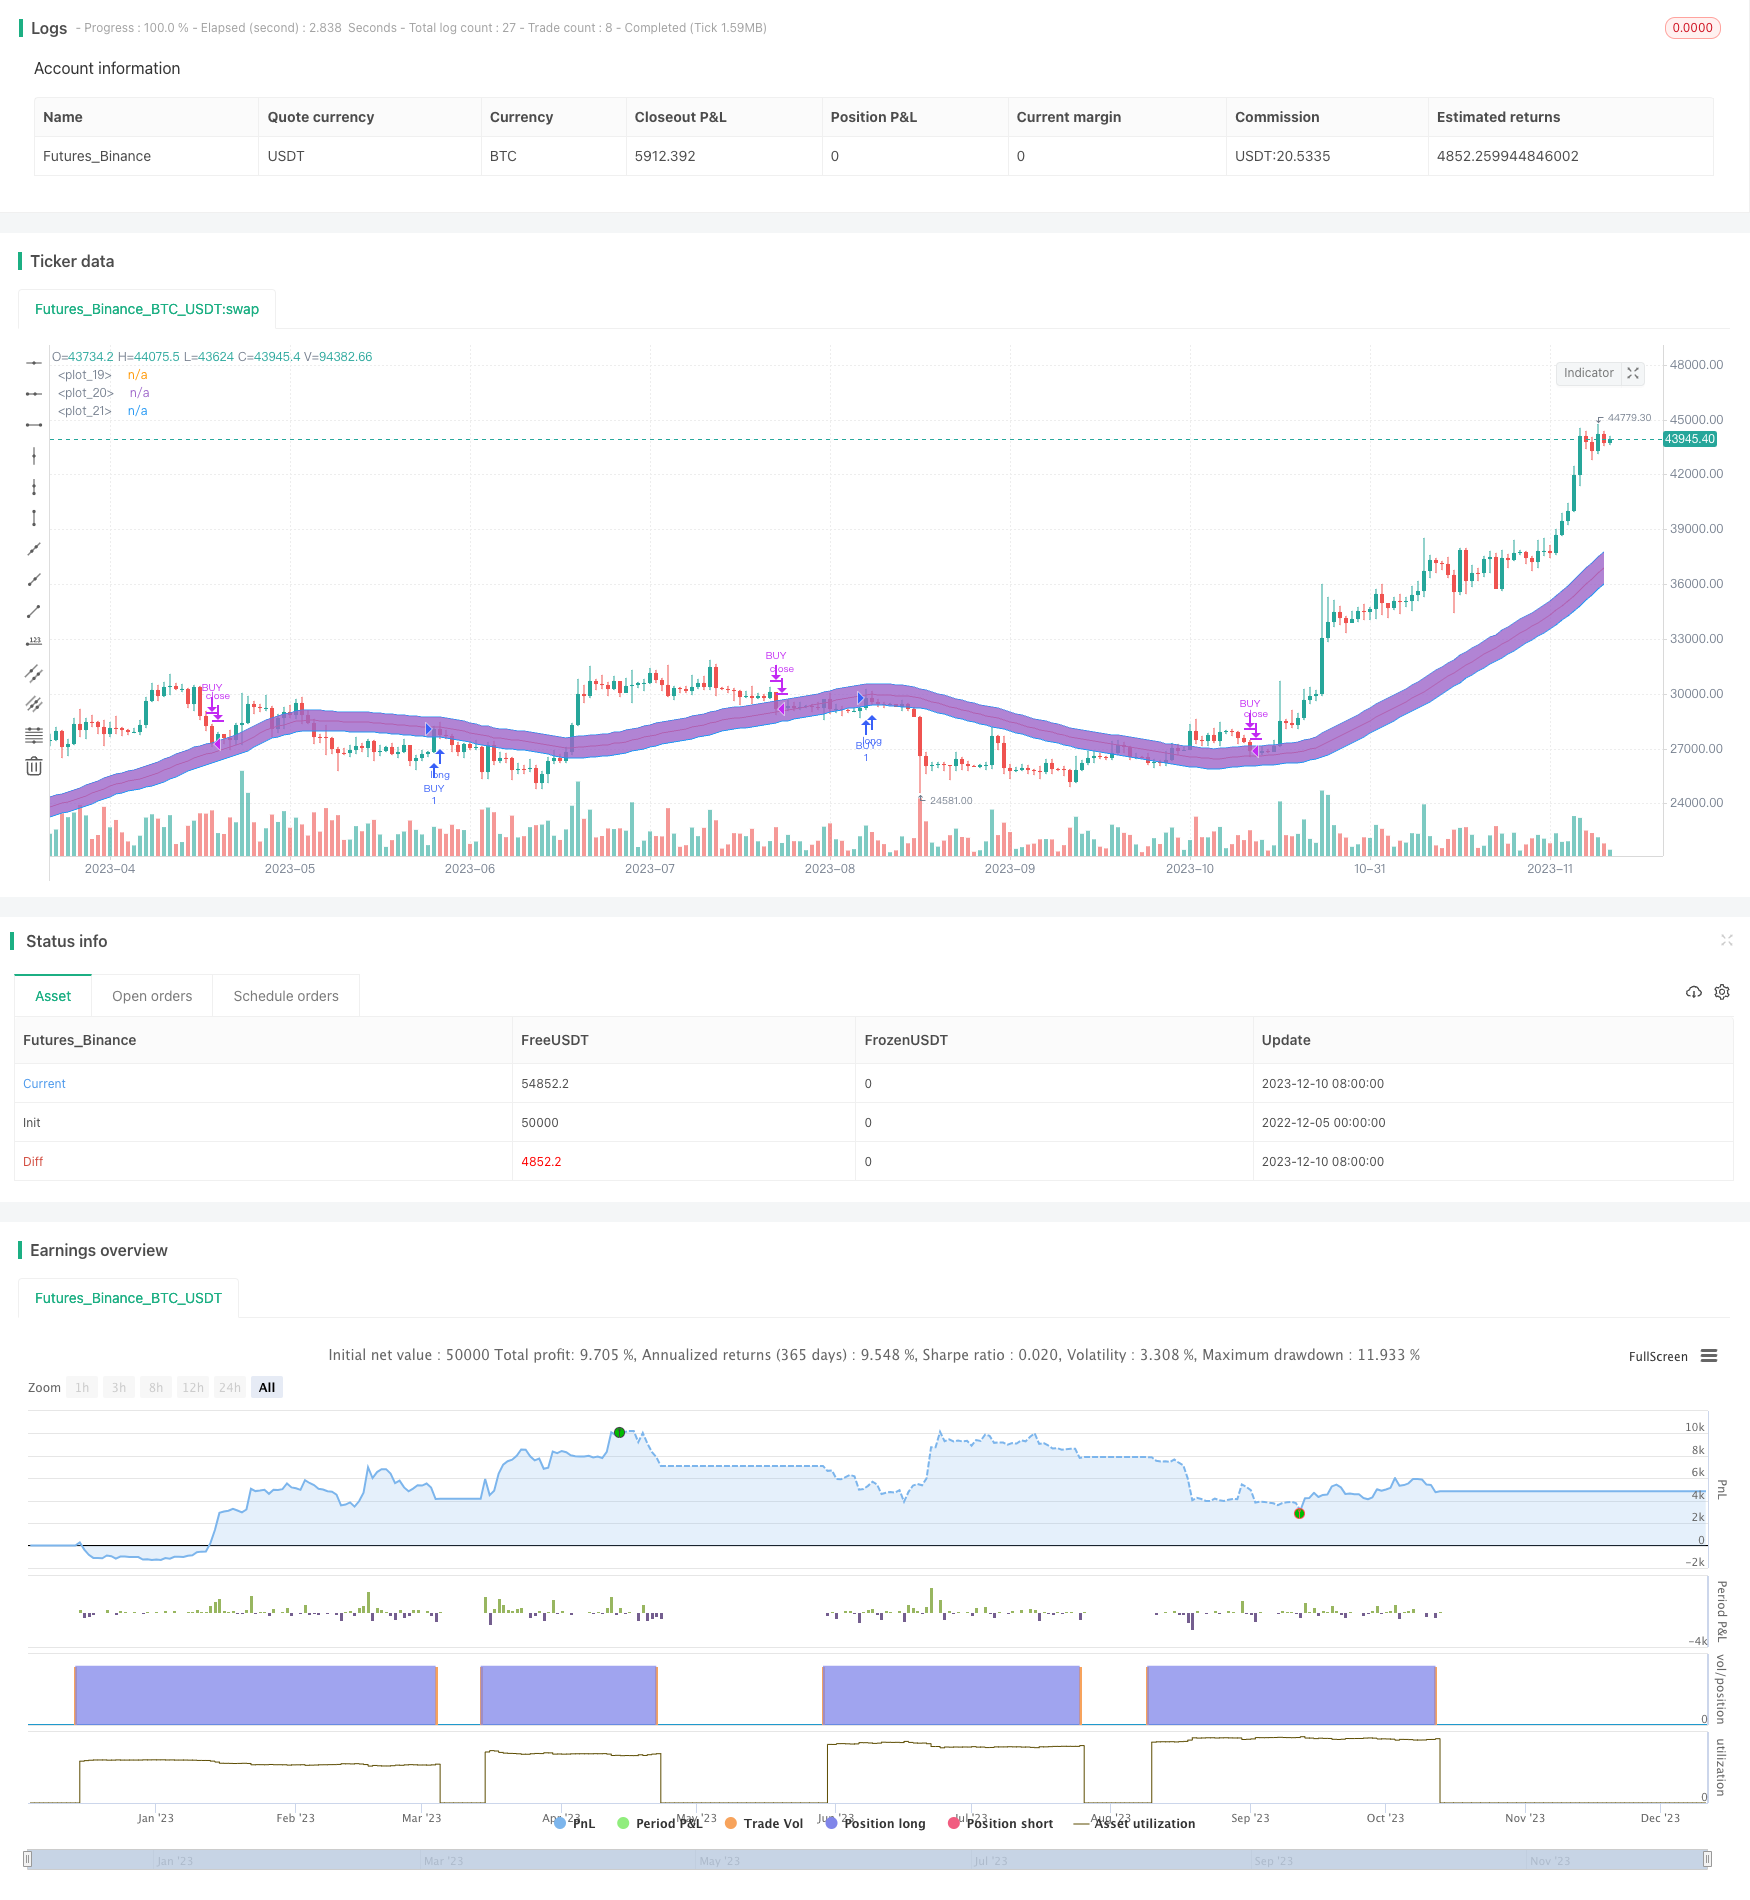 [trans]
概述
移动平均百分比波段策略是一种趋势跟踪策略。它使用移动平均线作为基准,然后根据价格的百分比来计算上轨和下轨。当价格突破上轨时,做空;当价格突破下轨时,做多。这个策略最大的优势是能够自动调整波动范围,在不同的市场环境中都能够有效捕捉趋势。
策略原理
该策略的核心指标是移动平均线,中轨线就是简单的 N 日移动平均线。上轨线和下轨线则是根据价格的百分比变动来计算的。具体的计算公式是:
上轨线 = 中轨线 + 价格 * 上轨线百分比 下轨线 = 中轨线 - 价格 * 下轨线百分比
这里的上轨线百分比和下轨线百分比是可调的参数,默认值为 2,代表价格的 2%。
当价格上涨时,上轨线和下轨线会同时向上扩展;当价格下跌时,上轨线和下轨线也会同时向下收缩。这就实现了根据市场波动程度来自动调整通道宽度的效果。
在交易策略方面,当价格突破上轨线时,做空;当价格突破下轨线时,做多。此外,该策略还设定了只在特定月份交易的条件,避免在非主要趋势月份产生错误信号。
优势分析
该策略最大的优势在于波动范围是根据价格百分比变动来计算的,可以自动调整,适应不同的行情环境,既能在震荡行情中减少虚假信号,也能在趋势行情中及时捕捉转折。此外,设置了月份和日期筛选条件,可以过滤掉边际月份的噪音,避免在非主要趋势月份产生错误信号。
风险分析
该策略的主要风险在于移动平均线存在滞后性,无法对突发事件做出即时反应。此外,百分比范围的设定也会影响策略表现,如果设定太低,则会加剧移动平均线的滞后性问题;如果设定太高,则会增加虚假信号的概率。
另一个潜在风险是过于依赖日期和月份条件,如果主要走势发生在设定月份之外,该策略就会错过机会。所以这些预设条件也需要根据不同品种和市场环境来调整。
优化方向
该策略的优化空间还很大。首先,可以测试不同的参数组合,如移动平均线的时间长度、百分比参数等,找到最优的参数。其次,可以考虑加入别的指标来确认移动平均线信号,如成交量等,以提高信号的可靠性。最后,日期和月份筛选条件也可以根据不同品种和市场环境进行调整,使之更加灵活。
例如,可以基于历史数据判断哪些月份是主要的趋势月份,然后自动计算出阈值。当价格出现异常突破时,也可以暂时忽略月份条件,全面参与。引入机器学习等手段来动态优化这些参数也是可行的。
总结
移动平均百分比波段策略整体来说是一种非常实用的趋势跟踪策略。它最大的优势就是能够自动调整波动范围,适应市场的变化。同时,也存在一定的改进空间,如参数优化、信号过滤等。如果能够合理运用,它能够在多种市场环境下稳定获利。
||
Overview
The Percentage Band Moving Average strategy is a trend following strategy. It uses moving average as the baseline and calculates upper band and lower band based on percentage of price. It goes short when price breaks through upper band and goes long when price breaks through lower band. The biggest advantage of this strategy is that it can automatically adjust the fluctuation range and effectively capture trends in different market environments.
Strategy Principle
The core indicator of this strategy is moving average. The middle band is simple N-day moving average. The upper band and lower band are calculated based on percentage change of price. The specific formulas are:
Upper Band = Middle Band + Price * Upper Band Percentage Lower Band = Middle Band - Price * Lower Band Percentage
Here the upper band percentage and lower band percentage are adjustable parameters, default to 2, representing 2% of the price.
When price goes up, both upper band and lower band will expand upwards at the same time. When price drops, both bands will contract downwards simultaneously. This achieves the effect of automatically adjusting channel width based on degree of market fluctuation.
For trading strategy, go short when price breaks through upper band and go long when price breaks through lower band. In addition, this strategy has set conditions to only trade in certain months, avoiding generating wrong signals in non-main trend months.
Advantage Analysis
The biggest advantage of this strategy is that the fluctuation range is calculated based on percentage change of price, which can be automatically adjusted to adapt to different market conditions. It can reduce false signals in range-bound markets and timely capture reversals in trending markets. In addition, setting month and date selection conditions can filter noise from marginal months and avoid generating wrong signals in non-main trend months.
Risk Analysis
The main risk of this strategy is that moving average has lagging effect and cannot react to emergencies instantly. In addition, the setting of percentage range will also affect strategy performance. If set too low, it will exacerbate the lagging problem of moving averages. If set too high, it will increase the probability of false signals.
Another potential risk is relying too much on date and month conditions. If main trend occurs outside the set months, this strategy will miss opportunities. So these preset conditions also need to be adjusted according to different products and market environments.
Optimization Directions
There is still large room for optimizing this strategy. Firstly, different parameter combinations can be tested, such as length of moving average, percentage parameters, etc, to find the optimal parameters. Secondly, other indicators can be introduced to confirm moving average signals, such as volume, to improve signal reliability. Finally, the date and month selection conditions can also be adjusted based on different products and market environments to make them more flexible.
For example, major trend months can be judged based on historical data, then thresholds can be automatically calculated. When there is abnormal breakthrough, month conditions can be temporarily ignored and participate fully. Introducing machine learning and other means to dynamically optimize these parameters is also feasible.
Summary
In general, the Percentage Band Moving Average Strategy is a very practical trend following strategy. Its biggest advantage is the ability to automatically adjust fluctuation range and adapt to market changes. At the same time, there is still room for improvement, such as parameter optimization, signal filtering, etc. If used properly, it can steadily profit in various market environments.
[/trans]
Strategy Arguments
| Argument | Default | Description |
|---|---|---|
| v_input_1 | 50 | bandlength |
| v_input_2 | 2 | Multiplier for Percent upper Band |
| v_input_3 | 2 | Multiplier for Percent Lower Band |
| v_input_4 | 6 | monthfrom |
| v_input_5 | 12 | monthuntil |
| v_input_6 | true | dayfrom |
| v_input_7 | 31 | dayuntil |
Source (PineScript)
/*backtest
start: 2022-12-05 00:00:00
end: 2023-12-11 00:00:00
period: 1d
basePeriod: 1h
exchanges: [{"eid":"Futures_Binance","currency":"BTC_USDT"}]
*/

//@version=3

strategy(title = "Percentage Band", overlay = true)


//////////////// BAND  ////////////////////////////
price=close
bandlength = input(50)
bbupmult =input(2,step=0.1,title="Multiplier for Percent upper Band")
bblowmult = input(2,step=0.1,title="Multiplier for Percent Lower  Band")

basis =  sma(close,bandlength)

devup =  (bbupmult*price)/100
devlow = (bblowmult*price)/100

upper = basis + devup
lower = basis - devlow
plot(basis, color=red)
p1 = plot(upper, color=blue)
p2 = plot(lower, color=blue)
fill(p1, p2)


/////////////////////////BAND  //////////////////////////


// Conditions


longCond = na
sellCond = na
longCond :=  crossover(price,lower)
sellCond :=  crossunder(price,upper)


monthfrom =input(6)
monthuntil =input(12)
dayfrom=input(1)
dayuntil=input(31)


if (  longCond  )
    strategy.entry("BUY", strategy.long, stop=close, oca_name="TREND",comment="BUY")

else
    strategy.cancel(id="BUY")


if ( sellCond   )

    strategy.close("BUY")
Detail
https://www.fmz.com/strategy/435161
Last Modified
2023-12-12 17:47:02