
9.4 KiB
Name
移动平均回拉交易策略Moving-Average-Pullback-Trading-Strategy
Author
ChaoZhang
Strategy Description
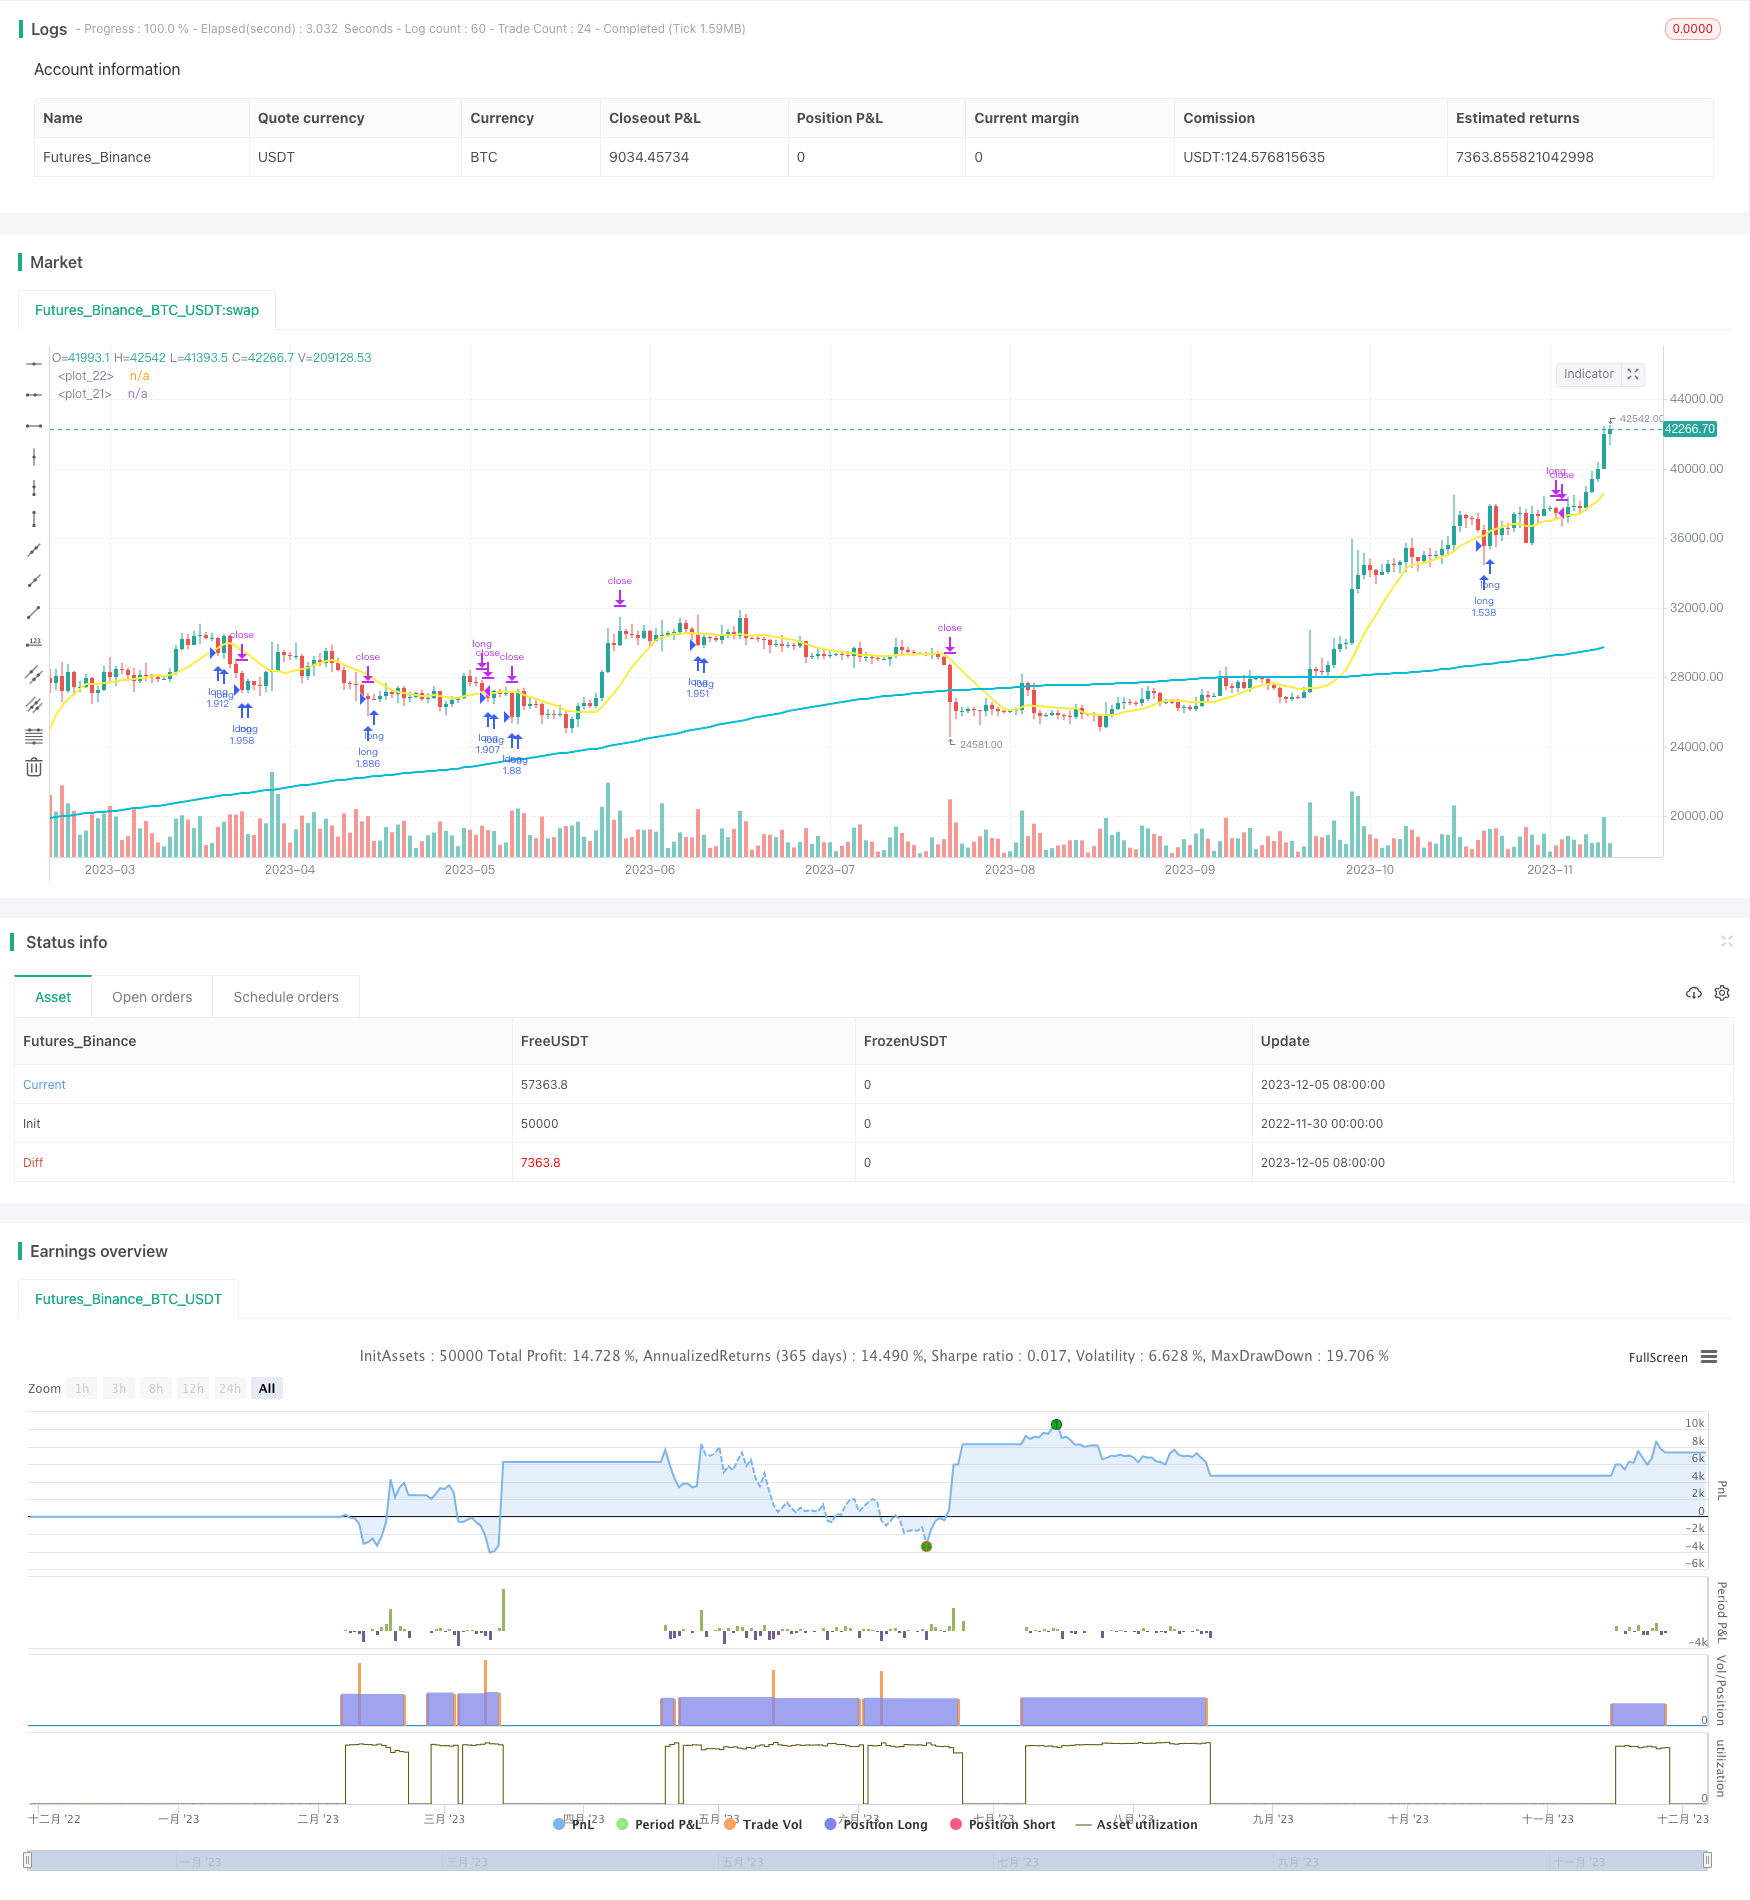
[trans]
概述
移动平均回拉交易策略(Moving Average Pullback Trading Strategy)是一种朝着趋势方向进行交易的策略。它利用长期和短期移动平均线的关系来判断整体趋势方向,并在短期回撤时进行逢低买入,平仓目标为止损和止盈。
策略原理
该策略主要判断规则有:
- 当收盘价处于长期移动平均线之上时,确认目前处于多头行情,满足开仓条件
- 当收盘价从短期移动平均线之上拖曳至短期移动平均线之下时,出现短期回撤行情
- 此时若RSI指标小于30,则认为处于超卖状态,形成买入信号
- 建立多头头寸,止损设定为入场价的5%以下,止盈设定为入场价的10%以上
通过这样的结合判断,我们可以在趋势方向符合预期的前提下,利用短期调整的机会建立仓位。
策略优势
这种策略最大的优势在于,它只在大趋势向上的预期下进行多头交易,可以有效避免震荡市场的风险。同时,它利用短期平均线回调的时机追买,这可以以比较好的价位进入市场。
另外,该策略设置了止损和止盈机制。这使得即便判断错误,形成反向行情,也可以通过止损来控制损失;而在盈利后,通过止盈来锁定部分利润。
策略风险
尽管该策略考虑到了大趋势判断和止损止盈设置,但仍存在一定的风险:
-
长期趋势判断错误风险。当判断进入多头行情后开仓做多,但实际上市场已经从多头转为震荡或者为空头,这样就会造成较大损失。
-
止损被追穿的风险。特别是在重大负面事件出现时,市场可能出现跳空下跌,超过事先设置的止损线,造成无法控制损失的情况。
对应地,我们可以考虑这样几个方法来降低风险:
-
做好大市分析,避免在震荡区间错误判断趋势。或者设置更长周期的移动平均线来确认大趋势。
-
采用条件单,当市场跳空下跌时触发平仓,而不是简单的止损单,这样可以一定程度上防止止损单被追穿的情况。
策略优化
考虑到该策略的特点是长线判断与短线入场,我们可以从以下几个方面进一步优化:
-
优化移动平均线的周期参数,寻找最佳的参数组合
-
增加其他指标判断。比如加入成交量的分析,或者在RSI指标的基础上结合其他超买超卖指标
-
实时调整止损止盈的幅度。我们可以根据市场波动程度做自适应调整,在大幅波动时适当放宽止损幅度
-
测试不同的标的品种适应性。这类策略可能更适合指数类产品,如果用于个股需要加入其他筛选规则
总结
移动平均回拉交易策略整体来说是一个较为成熟稳定的策略思路。它主要考量大趋势和短期回调机会,在不追高的前提下获得较好的入场时机。同时,通过止损止盈设置来锁定利润和控制风险。这种策略特别适用于具有较强综合分析能力和丰富交易经验的投资者。
||
Overview
The moving average pullback trading strategy is a trend-following strategy. It utilizes the relationship between long-term and short-term moving averages to determine the overall trend direction and makes long entries during short-term pullbacks when prices are relatively low.
Strategy Logic
The key decision rules of this strategy are:
- When the closing price is above the long-term moving average, it confirms an upward trend that meets the opening position criteria
- When the closing price pulls back from above the short-term moving average to below the short-term moving average, there is a short-term pullback
- At this time, if the RSI indicator is less than 30, it is considered oversold and a buy signal is generated
- Establish a long position with the stop loss set below 5% of the entry price and take profit set above 10% of the entry price
With such combined criteria, we can establish positions during short-term pullbacks while the trend direction matches expectations.
Advantages of the Strategy
The biggest advantage of this strategy is that it only carries out long trades in an expected upward trend, which can effectively avoid the risk of a volatile market. At the same time, it chases the buy on the pullback of the short-term moving average, which allows entering the market at a relatively better price.
In addition, the strategy has set up mechanisms for stop loss and take profit. This allows us to control losses through stop loss even if the judgment is wrong and the market moves in the opposite direction; for profits, take profit allows locking in some gains.
Risks of the Strategy
Although this strategy considers the major trend judgment and sets up stop loss and take profit, there are still certain risks:
-
Risk of incorrect judgment of the major trend. When judging that the market has entered a bull market after opening long positions, the actual market has turned from bullish to sideways or bearish, which will cause huge losses.
-
The risk of stop loss being penetrated. Especially when major negative events occur, the market may gap down beyond the predetermined stop loss line, resulting in uncontrollable losses.
Accordingly, we can consider the following methods to mitigate risks:
-
Make good analyses of the general market to avoid misjudging the trend in the shock zone. Or set longer cycle moving averages to confirm the major trend.
-
Adopt conditional orders which get triggered on gap-down moves instead of simple stop loss orders. This can prevent stop loss orders from being penetrated to some extent.
Strategy Optimization
Considering the characteristics of this strategy with long-term judgment and short-term entry, we can further optimize it in the following aspects:
-
Optimize the cycle parameters of moving averages to find the best parameter combination
-
Increase other technical indicator filters. Such as adding volume analysis, or combining other overbought-oversold indicators on the basis of RSI
-
Dynamically adjust the stop loss and take profit range. We can make adaptive adjustments based on market volatility, appropriately widening the stop loss range during high volatility periods
-
Test adaptiveness across different products. This type of strategy may be more suitable for index products. Additional filters are needed when applied to individual stocks.
Conclusion
In general, the moving average pullback trading strategy is a relatively mature and steady strategy idea. It mainly considers the major trend and chances for short-term pullbacks, obtaining good entry opportunities without chasing new highs. At the same time, it locks in profits and controls risks through stop loss and take profit settings. This strategy is especially suitable for investors with strong comprehensive analytical capabilities and rich trading experience.
[/trans]
Strategy Arguments
| Argument | Default | Description |
|---|---|---|
| v_input_int_1 | 200 | (?パラメータ)長期移動平均BASE200/period of long term sma |
| v_input_int_2 | 10 | 長期移動平均BASE10/period of short term sma |
| v_input_int_3 | 5 | 損切の割合%/stoploss percentages |
| v_input_int_4 | 20 | 利食いの割合%/take profit percentages |
| v_input_1 | timestamp(01 Jan 2000 13:30 +0000) | (?期間)バックテストを始める日/start trade day |
| v_input_2 | timestamp(1 Jan 2099 19:30 +0000) | バックテスを終わる日/finish date day |
Source (PineScript)
/*backtest
start: 2022-11-30 00:00:00
end: 2023-12-06 00:00:00
period: 1d
basePeriod: 1h
exchanges: [{"eid":"Futures_Binance","currency":"BTC_USDT"}]
*/

// This source code is subject to the terms of the Mozilla Public License 2.0 at https://mozilla.org/MPL/2.0/
// © tsujimoto0403

//@version=5
strategy("simple pull back", overlay=true,default_qty_type=strategy.percent_of_equity,
     default_qty_value=100)

//input value
malongperiod=input.int(200,"長期移動平均BASE200/period of long term sma",group = "パラメータ")
mashortperiod=input.int(10,"長期移動平均BASE10/period of short term sma",group = "パラメータ")
stoprate=input.int(5,title = "損切の割合%/stoploss percentages",group = "パラメータ")
profit=input.int(20,title = "利食いの割合%/take profit percentages",group = "パラメータ")
startday=input(title="バックテストを始める日/start trade day", defval=timestamp("01 Jan 2000 13:30 +0000"), group="期間")
endday=input(title="バックテスを終わる日/finish date day", defval=timestamp("1 Jan 2099 19:30 +0000"), group="期間")


//polt indicators that we use
malong=ta.sma(close,malongperiod)
mashort=ta.sma(close,mashortperiod)

plot(malong,color=color.aqua,linewidth = 2)
plot(mashort,color=color.yellow,linewidth = 2)

//date range
datefilter = true

//open conditions
if close>malong and close<mashort and strategy.position_size == 0 and datefilter and ta.rsi(close,3)<30
    strategy.entry(id="long", direction=strategy.long)

//sell conditions
strategy.exit(id="cut",from_entry="long",stop=(1-0.01*stoprate)*strategy.position_avg_price,limit=(1+0.01*profit)*strategy.position_avg_price)


if close>mashort and close<low[1] and strategy.position_size>0
    strategy.close(id ="long")
Detail
https://www.fmz.com/strategy/434610
Last Modified
2023-12-07 18:09:27