
8.4 KiB
Name
移动平均交叉中点策略Moving-Average-Crossover-Midpoint-Strategy
Author
ChaoZhang
Strategy Description
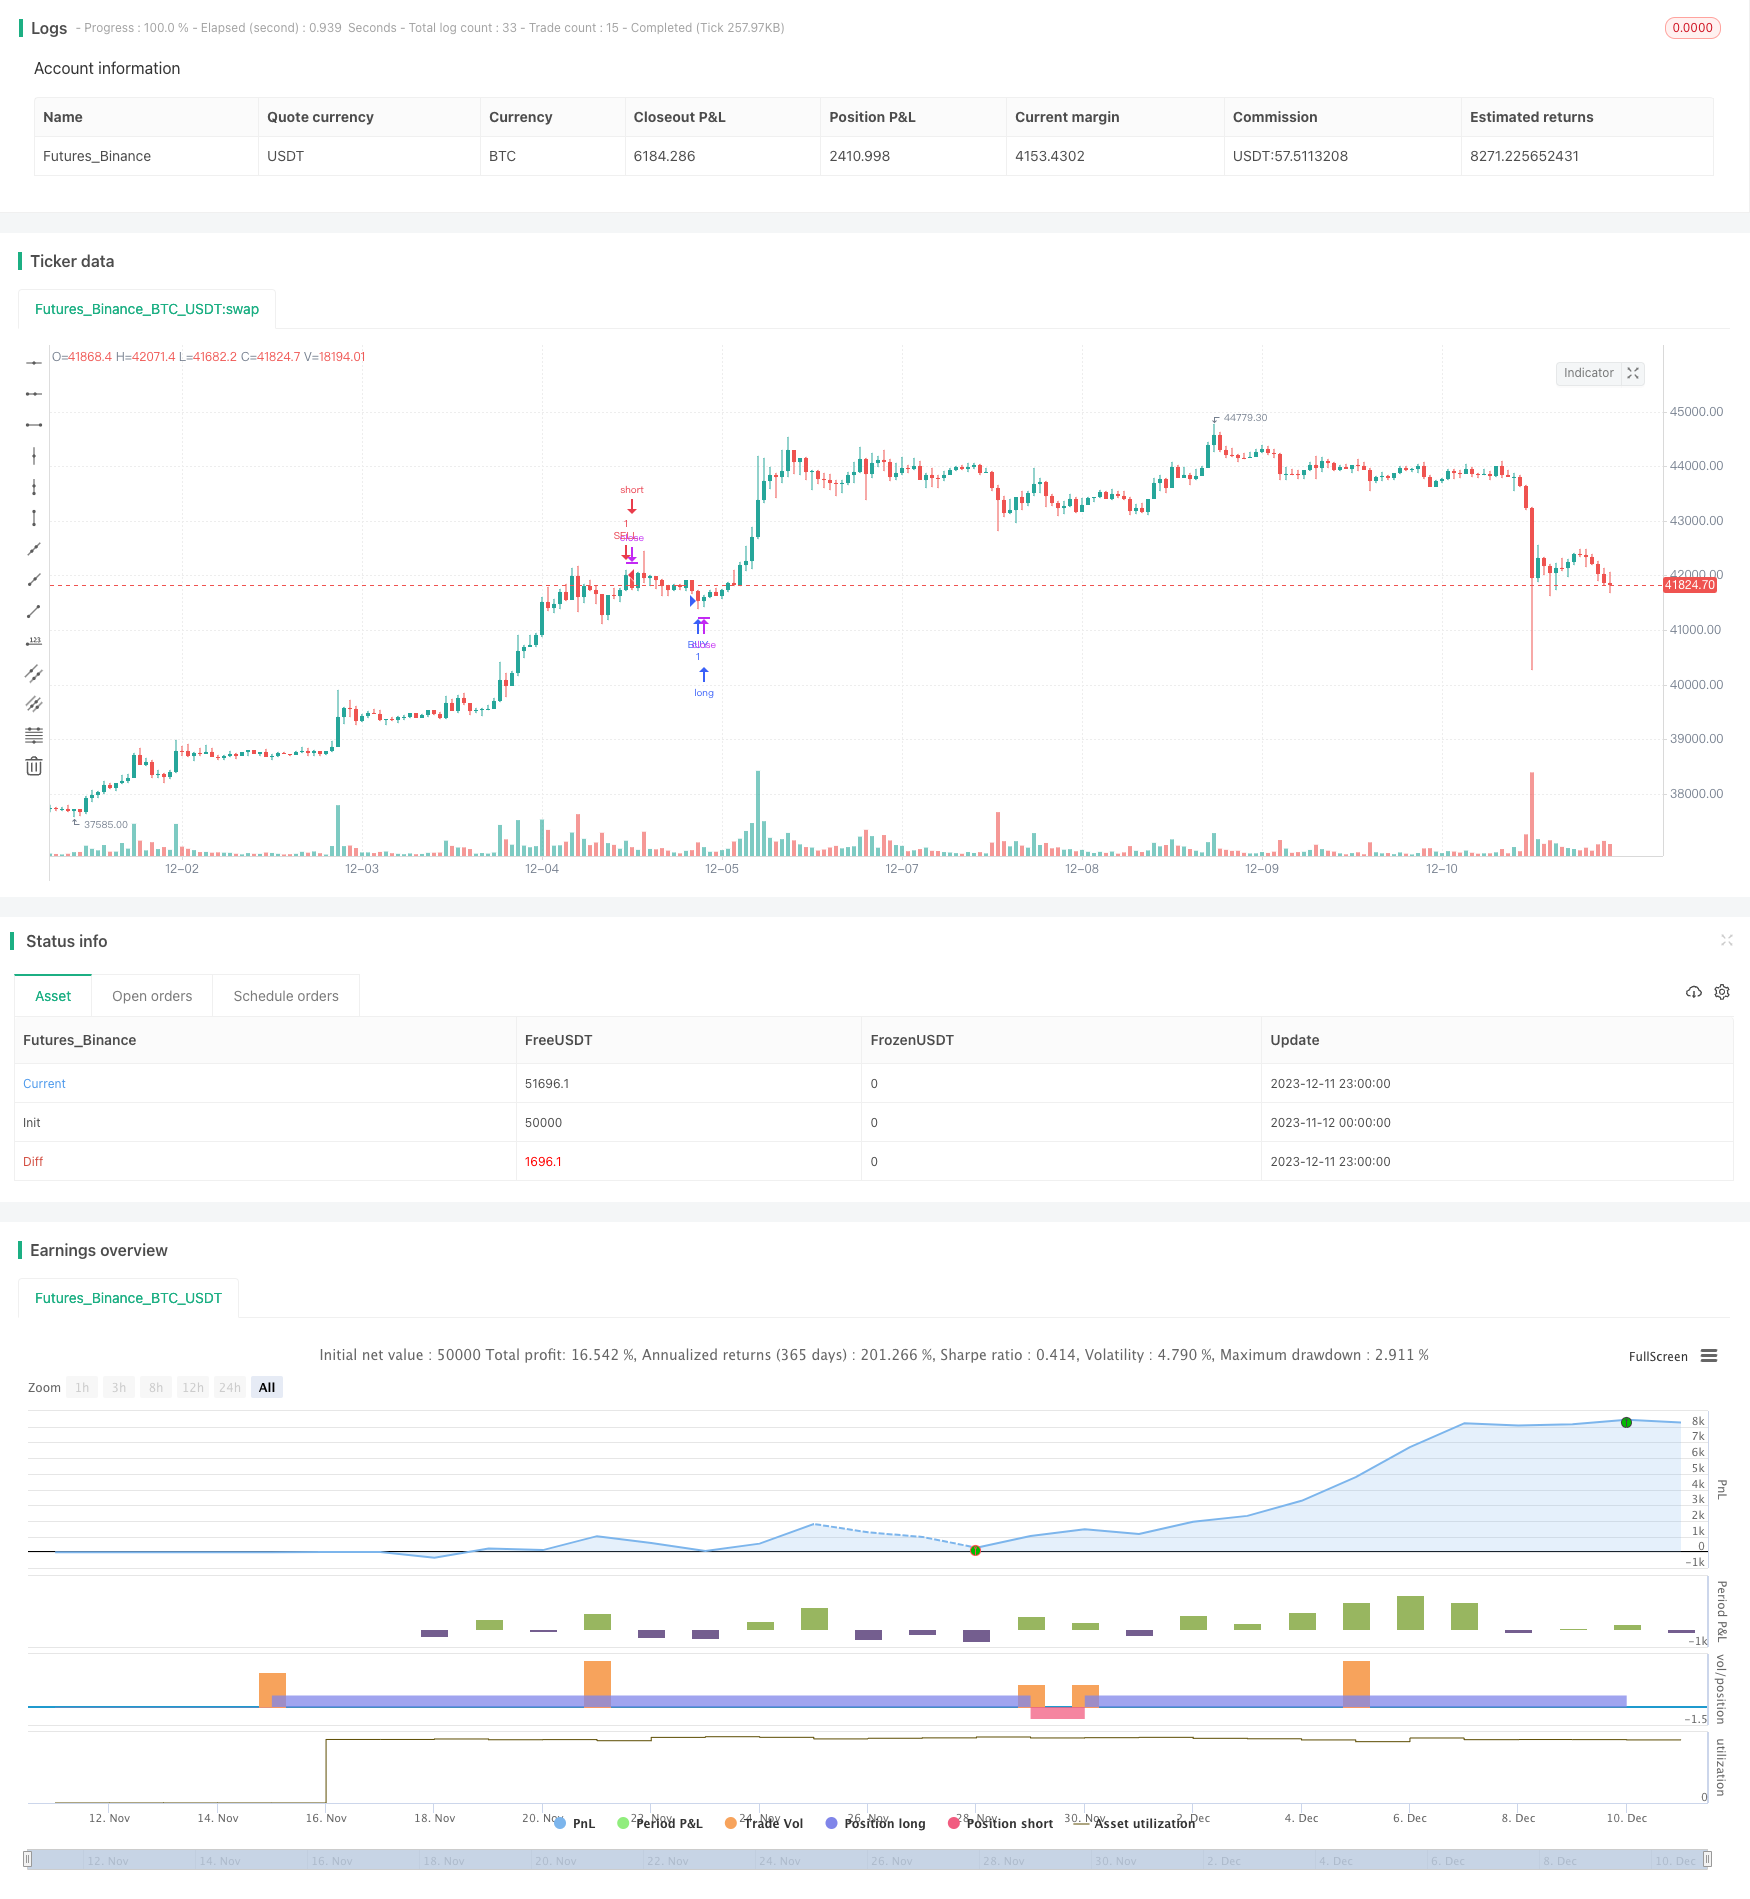
[trans]
概述
移动平均交叉中点策略是一种趋势跟踪策略。它结合了中点指标和移动平均线,通过判断价格是否突破中点指标和移动平均线的交叉点来产生交易信号。
策略原理
该策略的核心指标是中点指标。中点指标是取一定周期内的最高价和最低价的平均值。由于最高价和最低价能反映市场波动的两极,其平均值就成为重要的支持或阻力位。
另外,策略中还引入了移动平均线。移动平均线能平滑价格数据,判断趋势方向。
当价格上穿中点指标和移动平均线的交叉点时,产生买入信号;当价格下穿交叉点时,产生卖出信号。
根据该策略逻辑,只要捕捉价格突破中点和移动平均线交叉 area 的突破,就可以顺势而为,抓住中间回调进行反转操作。
优势分析
该策略结合中点指标和移动平均线,能快速判断关键支持阻力位和趋势方向,具有如下优势:
-
中点指标能准确定位支持阻力位,移动平均线判断趋势方向,两者结合,可靠性较高。
-
通过交叉情况判断走势转折点,减少了假突破的概率。
-
采用双线交叉判断,避免单一指标造成误导。
-
策略思路简单清晰,容易理解和实现,适合量化交易。
风险分析
该策略也存在一些风险:
-
市场剧烈波动时,中点指标和移动平均线可能发生失效。
-
双线交叉时,可能出现一定程度拉回测试或回调压力,带来止损风险。
-
该策略以中短期操作为主,不适合过于长线操作。
对应风险管理措施包括:
-
优化移动平均线参数,提高平滑性。
-
适当放大止损幅度,应对回调压力。
-
缩短持仓周期,及时止盈止损。
优化方向
该策略还可以从以下几个方向进行优化:
-
优化中点指标和移动平均线的周期参数,寻找最佳参数组合。
-
增加其他指标过滤,例如MACD、RSI等,提高信号质量。
-
增加交易量验证,避免低量假突破。
-
结合波动率指标,根据市场波动调整止损止盈位。
-
测试不同市场和品种的适用性。
总结
移动平均交叉中点策略整合中点指标和移动平均线的优势,通过交叉情况判断关键支持阻力位的突破,以捕捉市场转折点。策略优化空间较大,可望获得稳定收益。
||
Overview
The Moving Average Crossover Midpoint Strategy is a trend following strategy. It combines the midpoint indicator and moving average lines to generate trading signals when price breaks through the crossover point of the midpoint indicator and moving averages.
Strategy Logic
The core indicator of this strategy is the midpoint indicator. The midpoint indicator takes the average value of the highest and lowest prices over a certain period to locate key support and resistance levels.
In addition, the moving average is introduced to smooth price data and determine the trend direction.
Buy signals are generated when price breaks above the crossover point of the midpoint and moving average, and sell signals are generated when price breaks below the crossover point.
According to this strategy logic, catching the breakout of the midpoint and moving average crossover area can follow the trend well and take reversal trades during pullbacks.
Advantage Analysis
This strategy combines the advantages of midpoint indicator and moving averages, with the following edges:
-
The midpoint indicator accurately locates key support/resistance levels, and moving averages determine the trend direction. The combination enhances reliability.
-
Judging reversals via crossover situations reduces the probability of false breakouts.
-
Adopting dual-line crossover prevents misleading by a single indicator.
-
The strategy idea is simple and clear, easy to understand and implement, suitable for algorithm trading.
Risk Analysis
There are also some risks in this strategy:
-
The midpoint and moving averages may fail when the market fluctuates violently.
-
There could be some pullback pressure when the crossover happens, causing stop loss risks.
-
This strategy focuses on medium-term operations and does not apply to overly long-term operations.
The corresponding risk management measurements include:
-
Optimizing moving average parameters to increase smoothness.
-
Properly widening stop loss range to cope with pullback pressure.
-
Shortening holding period for timely profit taking and stop loss.
Optimization Directions
This strategy can also be optimized in the following aspects:
-
Optimize periods of midpoint indicator and moving averages to find the best parameter combination.
-
Add other indicators like MACD, RSI for filtration to improve signal quality.
-
Add trading volume confirmation to avoid false breakouts with low volume.
-
Incorporate volatility indicators to adjust stops and profit taking levels based on market fluctuation.
-
Test applicability in different markets and products.
Conclusion
The Moving Average Crossover Midpoint Strategy integrates the advantages of midpoint indicator and moving averages, catching trend reversal by judging breakouts of key support/resistance levels. This strategy has large room for optimization and is expected to achieve steady profits.
[/trans]
Strategy Arguments
| Argument | Default | Description |
|---|---|---|
| v_input_1 | 131 | Başlangıç Period |
| v_input_2 | 14 | Kaydırma Seviyesi |
| v_input_float_1 | 0.0006 | Yüzde Seviyesi |
| v_input_int_1 | 44 | Length |
| v_input_3_close | 0 | Source: close |
| v_input_string_1 | 0 | (?Smoothing)Method: EMA |
| v_input_int_2 | 53 | Length |
Source (PineScript)
/*backtest
start: 2023-11-12 00:00:00
end: 2023-12-12 00:00:00
period: 1h
basePeriod: 15m
exchanges: [{"eid":"Futures_Binance","currency":"BTC_USDT"}]
*/

// This source code is subject to the terms of the Mozilla Public License 2.0 at https://mozilla.org/MPL/2.0/
// © MGULHANN
//@version=5
strategy('Forex Midpoint Stratejisi For Nasdaq ', overlay=true)
BPeriod = input(131, 'Başlangıç Period')
kaydirma = input(14, 'Kaydırma Seviyesi')
yuzdeseviyesi = input.float(0.0006, 'Yüzde Seviyesi', step=0.0001)
len = input.int(44, minval=1, title="Length")
src = input(close, title="Source")
out = ta.sma(src, len)

ma(source, length, type) =>
    switch type
        "SMA" => ta.sma(source, length)
        "EMA" => ta.ema(source, length)
        "SMMA (RMA)" => ta.rma(source, length)
        "WMA" => ta.wma(source, length)
        "VWMA" => ta.vwma(source, length)

typeMA = input.string(title = "Method", defval = "EMA", options=["SMA", "EMA", "SMMA (RMA)", "WMA", "VWMA"], group="Smoothing")
smoothingLength = input.int(title = "Length", defval = 53, minval = 1, maxval = 100, group="Smoothing")
smoothingLine = ma(out, smoothingLength, typeMA)
//plot(smoothingLine, title="Smoothing Line", color=color.red, linewidth = 2)

//zararDurdurmaYuzde = input.float(0.2, title='Zarar Durdurma %', step=0.01) / 100
//karAlmaYuzde = input.float(0.5, title='Kar Alma %', step=0.01) / 100


//MIDPOINT HESAPLA
midpoint1 = ta.highest(high, BPeriod) + ta.lowest(low, BPeriod)
midpoint2 = midpoint1 / 2
midyuzdeseviyesi = midpoint2 * yuzdeseviyesi
midtopdeger = midyuzdeseviyesi + midpoint2

//GİRİŞ KOŞULLARI
buycross = ta.crossover(smoothingLine, midtopdeger[kaydirma]) //? aort > ta.sma(close,50) : na
sellcross = ta.crossover(midtopdeger[kaydirma], smoothingLine) // ? aort < ta.sma(close,50) : na

//LONG GİRİŞ
if (buycross)
    strategy.entry("BUY", strategy.long)
    //longKarAl = strategy.position_avg_price * (1 + karAlmaYuzde)
    //longZararDurdur = strategy.position_avg_price * (1 - zararDurdurmaYuzde)
    //strategy.exit("Long Exit","Long", stop=longZararDurdur)


//SHORT GİRİŞ
if (sellcross)
    strategy.entry("SELL", strategy.short)
    //shortKarAl = strategy.position_avg_price * (1 - karAlmaYuzde)
    //shortZararDurdur = strategy.position_avg_price * (1 + zararDurdurmaYuzde)
    //strategy.exit("Short Exit","Short", stop=shortZararDurdur)

//plot(midtopdeger, offset=kaydirma, linewidth=2, color=color.blue)
Detail
https://www.fmz.com/strategy/435284
Last Modified
2023-12-13 17:38:23