
7.1 KiB
Name
移动均线多边形策略Polygon-Moving-Average-Strategy
Author
ChaoZhang
Strategy Description
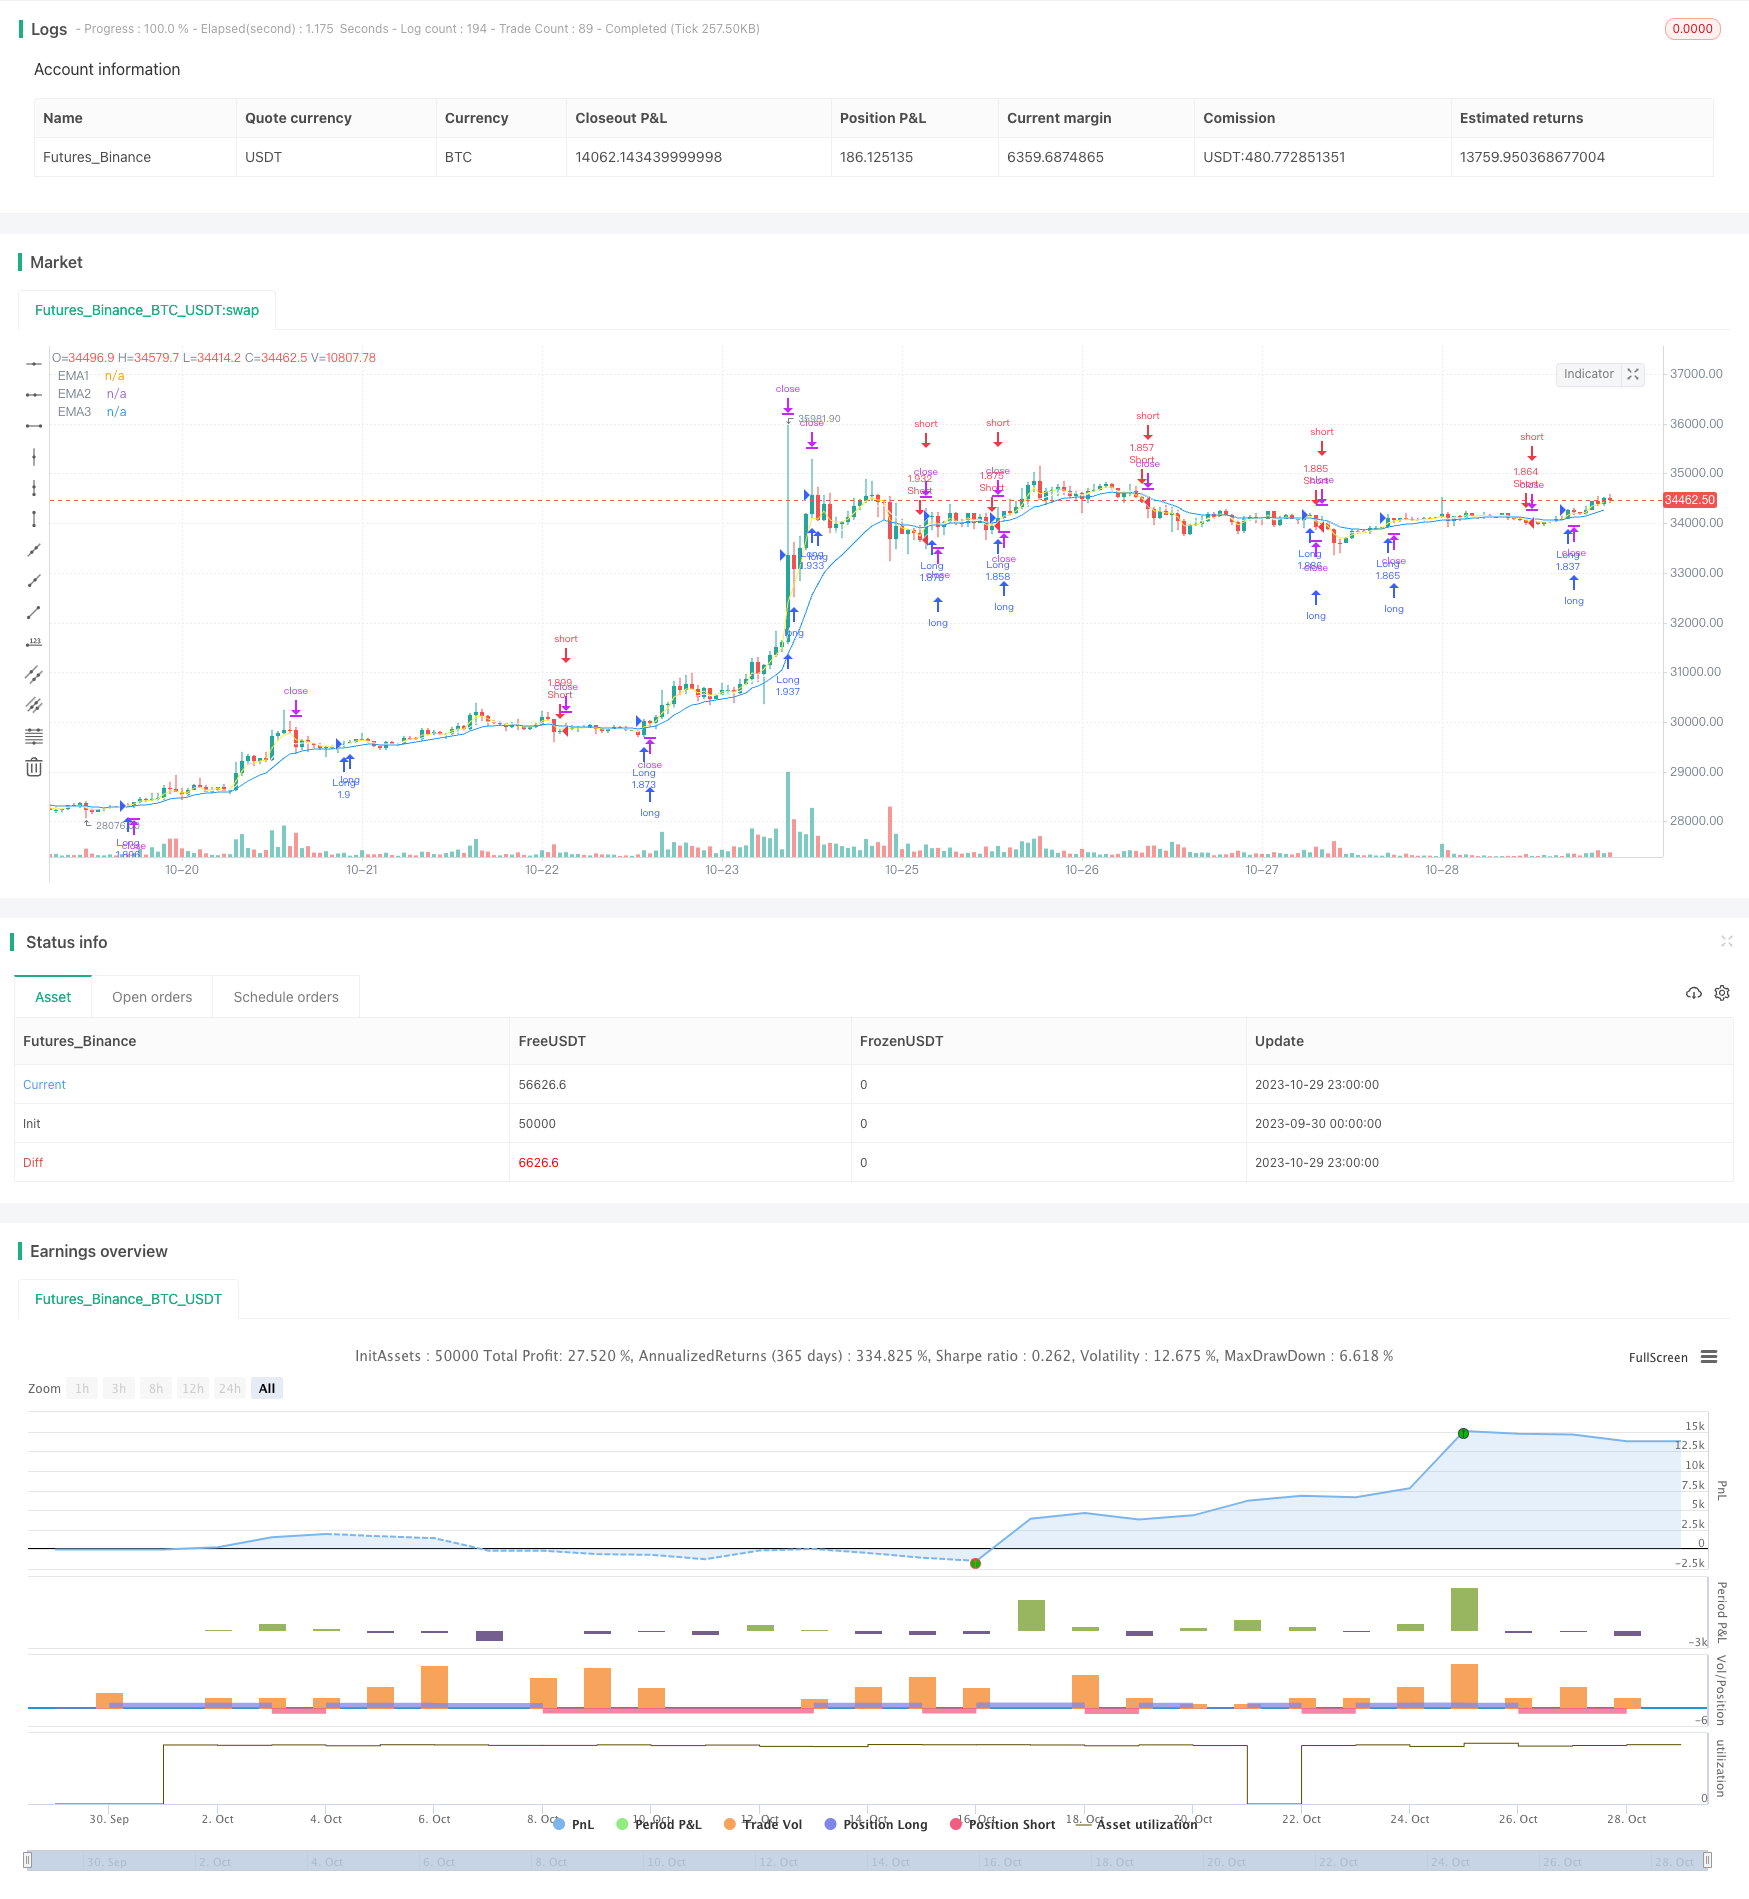
[trans]
概述
移动均线多边形策略是一种通过多条不同周期的移动均线构建多边形,并以突破多边形为交易信号的趋势跟踪策略。该策略综合考虑多个时间周期因素,可以有效过滤市场噪音,抓住主要趋势。
策略原理
该策略通过输入不同周期的EMA均线,如3周期、7周期和13周期的EMA,将它们画在价格图形上构成一个多边形通道。当价格上穿多个EMA均线时生成做多信号;当价格下穿多个EMA均线时生成做空信号。这样可以排除许多假突破。
代码中通过close>ema1 and ema1>ema2 and ema2>ema3确定上穿信号,close<ema1 and ema1<ema2 and ema2<ema3确定下穿信号。设置买卖条件时加入时间条件time_cond,限定回测范围。执行买入卖出操作时,采用移动止损保护利润。
策略优势
该策略最大的优势在于能有效抓住主要趋势方向,利用多条移动均线构建筛选机制,避免被市场短期噪音影响,减少假信号。移动止损使其能及时止损保护利润。
风险及解决
该策略主要风险在于无法划定趋势的转折点位,在趋势反转时可能形成打对盘而亏损。此外,均线组合设置不当也可能导致交易频率过高或信号延迟。可以通过优化均线参数组合、加入其它指标判断 reversal、放宽止损范围等方法来降低风险。
优化方向
该策略可以从以下几个方面进行优化:
-
优化移动均线的周期参数,找到最佳参数组合
-
在趋势转折点加入反转信号指标,如RSI,MACD等,以便及时止损离场
-
优化移动止损的止损幅度和偏移值,降低止损被触发的概率
-
针对不同品种参数进行优化,提高策略适应性
总结
移动均线多边形策略整体来说是一个可靠、有效的趋势跟踪策略。它最大的优点是抓住主要趋势方向的同时可大幅过滤噪音。但也存在一定的反转识别不足问题。我们可以通过参数优化、加入辅助指标等方法来提高策略表现。这个策略适用于趋势较明显的品种,如果使用得当,可以获得稳定的交易收益。
||
Overview
The Polygon Moving Average strategy constructs a polygon with multiple moving averages of different periods and uses the breakthrough of the polygon as trading signals. This trend-following strategy incorporates multiple timeframes and can effectively filter market noise and capture the main trend.
Strategy Logic
The strategy plots several EMAs, such as 3-period, 7-period and 13-period EMAs, to form a polygon channel. When the price breaks above the EMAs, a long signal is generated. When the price breaks below the EMAs, a short signal is generated. This helps avoid many false breakouts.
The code determines the breakthrough signals by comparing the close price to the EMAs using conditions like close>ema1 and ema1>ema2 and ema2>ema3. The time condition time_cond is added to limit the backtest period. The strategy uses a trailing stop loss to protect profits after entry.
Advantages
The biggest advantage of this strategy is its ability to effectively capture the main trend direction by using multiple moving averages as filters to avoid noise. The trailing stop loss takes profits in a timely manner.
Risks and Solutions
The main risk is that this strategy fails to identify trend reversal points and may lead to loss during trend reversals. Inappropriate MA period settings may also result in overtrading or lagging signals. The risks can be reduced by optimizing MA combinations, adding reversal indicators, widening stop loss range, etc.
Optimization Directions
The strategy can be optimized in the following aspects:
-
Optimize the MA periods to find the best combination.
-
Add reversal indicators like RSI and MACD to exit trades timely.
-
Optimize the stop loss range and offset to reduce premature stop loss.
-
Optimize parameters for different products to improve adaptability.
Summary
The Polygon Moving Average strategy is generally a reliable and effective trend following system. Its biggest strength is capturing the main trend while filtering out noise significantly. But it has some limitations in identifying reversals. We can improve it by parameter optimization, adding auxiliary indicators, etc. It is suitable for markets with obvious trends and can generate stable profits if used properly.
[/trans]
Strategy Arguments
| Argument | Default | Description |
|---|---|---|
| v_input_1 | true | From Day |
| v_input_2 | true | From Month |
| v_input_3 | 2019 | From Year |
| v_input_4 | true | To Day |
| v_input_5 | true | To Month |
| v_input_6 | 2020 | To Year |
| v_input_7 | 3 | v_input_7 |
| v_input_8 | 7 | v_input_8 |
| v_input_9 | 13 | v_input_9 |
Source (PineScript)
/*backtest
start: 2023-09-30 00:00:00
end: 2023-10-30 00:00:00
period: 1h
basePeriod: 15m
exchanges: [{"eid":"Futures_Binance","currency":"BTC_USDT"}]
*/

// This source code is subject to the terms of the Mozilla Public License 2.0 at https://mozilla.org/MPL/2.0/
// © Crypto-Oli

//@version=4
strategy("BLANK Strategy + TSL", initial_capital=5000, default_qty_type=strategy.percent_of_equity, default_qty_value=100, commission_type=strategy.commission.percent, pyramiding=1, commission_value=0.075, overlay=true)

////////////////////////////////////////////////////////////////////////////////
// BACKTESTING RANGE

// From Date Inputs
fromDay = input(defval = 1, title = "From Day", minval = 1, maxval = 31)
fromMonth = input(defval = 1, title = "From Month", minval = 1, maxval = 12)
fromYear = input(defval = 2019, title = "From Year", minval = 1970)

// To Date Inputs
toDay = input(defval = 1, title = "To Day", minval = 1, maxval = 31)
toMonth = input(defval = 1, title = "To Month", minval = 1, maxval = 12)
toYear = input(defval = 2020, title = "To Year", minval = 1970)

// Calculate start/end date and time condition
startDate = timestamp(fromYear, fromMonth, fromDay, 00, 00)
finishDate = timestamp(toYear, toMonth, toDay, 00, 00)
time_cond = true

////////////////////////////////////////////////////////////////////////////////


/// YOUR INPUTS BELOW - DELET EXAPLES ///


ema1=ema(close,input(3))
ema2=ema(close,input(7))
ema3=ema(close,input(13))


/// PLOTS IF YOU NEED BELOW - DELET EXAPLES ///


plot(ema1, "EMA1", color.yellow)
plot(ema2, "EMA2", color.white)
plot(ema3, "EMA3", color.blue)


/// YOUR CONDITIONS BELOW - DELET EXAPLES ///


longCondition = close>ema1 and ema1>ema2 and ema2>ema3 and time_cond
shortCondition = close<ema1 and ema1<ema2 and ema2<ema3 and time_cond

/// EXECUTION ///


if (longCondition)
    strategy.entry("Long", strategy.long)
strategy.exit("Long Exit", "Long", trail_points = close * 0.05 / syminfo.mintick, trail_offset = close * 0.02 / syminfo.mintick)

if (shortCondition)
    strategy.entry("Short", strategy.short)
strategy.exit("Short Exit", "Short", trail_points = close * 0.05 / syminfo.mintick, trail_offset = close * 0.02 / syminfo.mintick)
Detail
https://www.fmz.com/strategy/430671
Last Modified
2023-10-31 14:53:50