
8.5 KiB
Name
移动均线交叉交易策略EMA-Crossover-Trading-Strategy
Author
ChaoZhang
Strategy Description
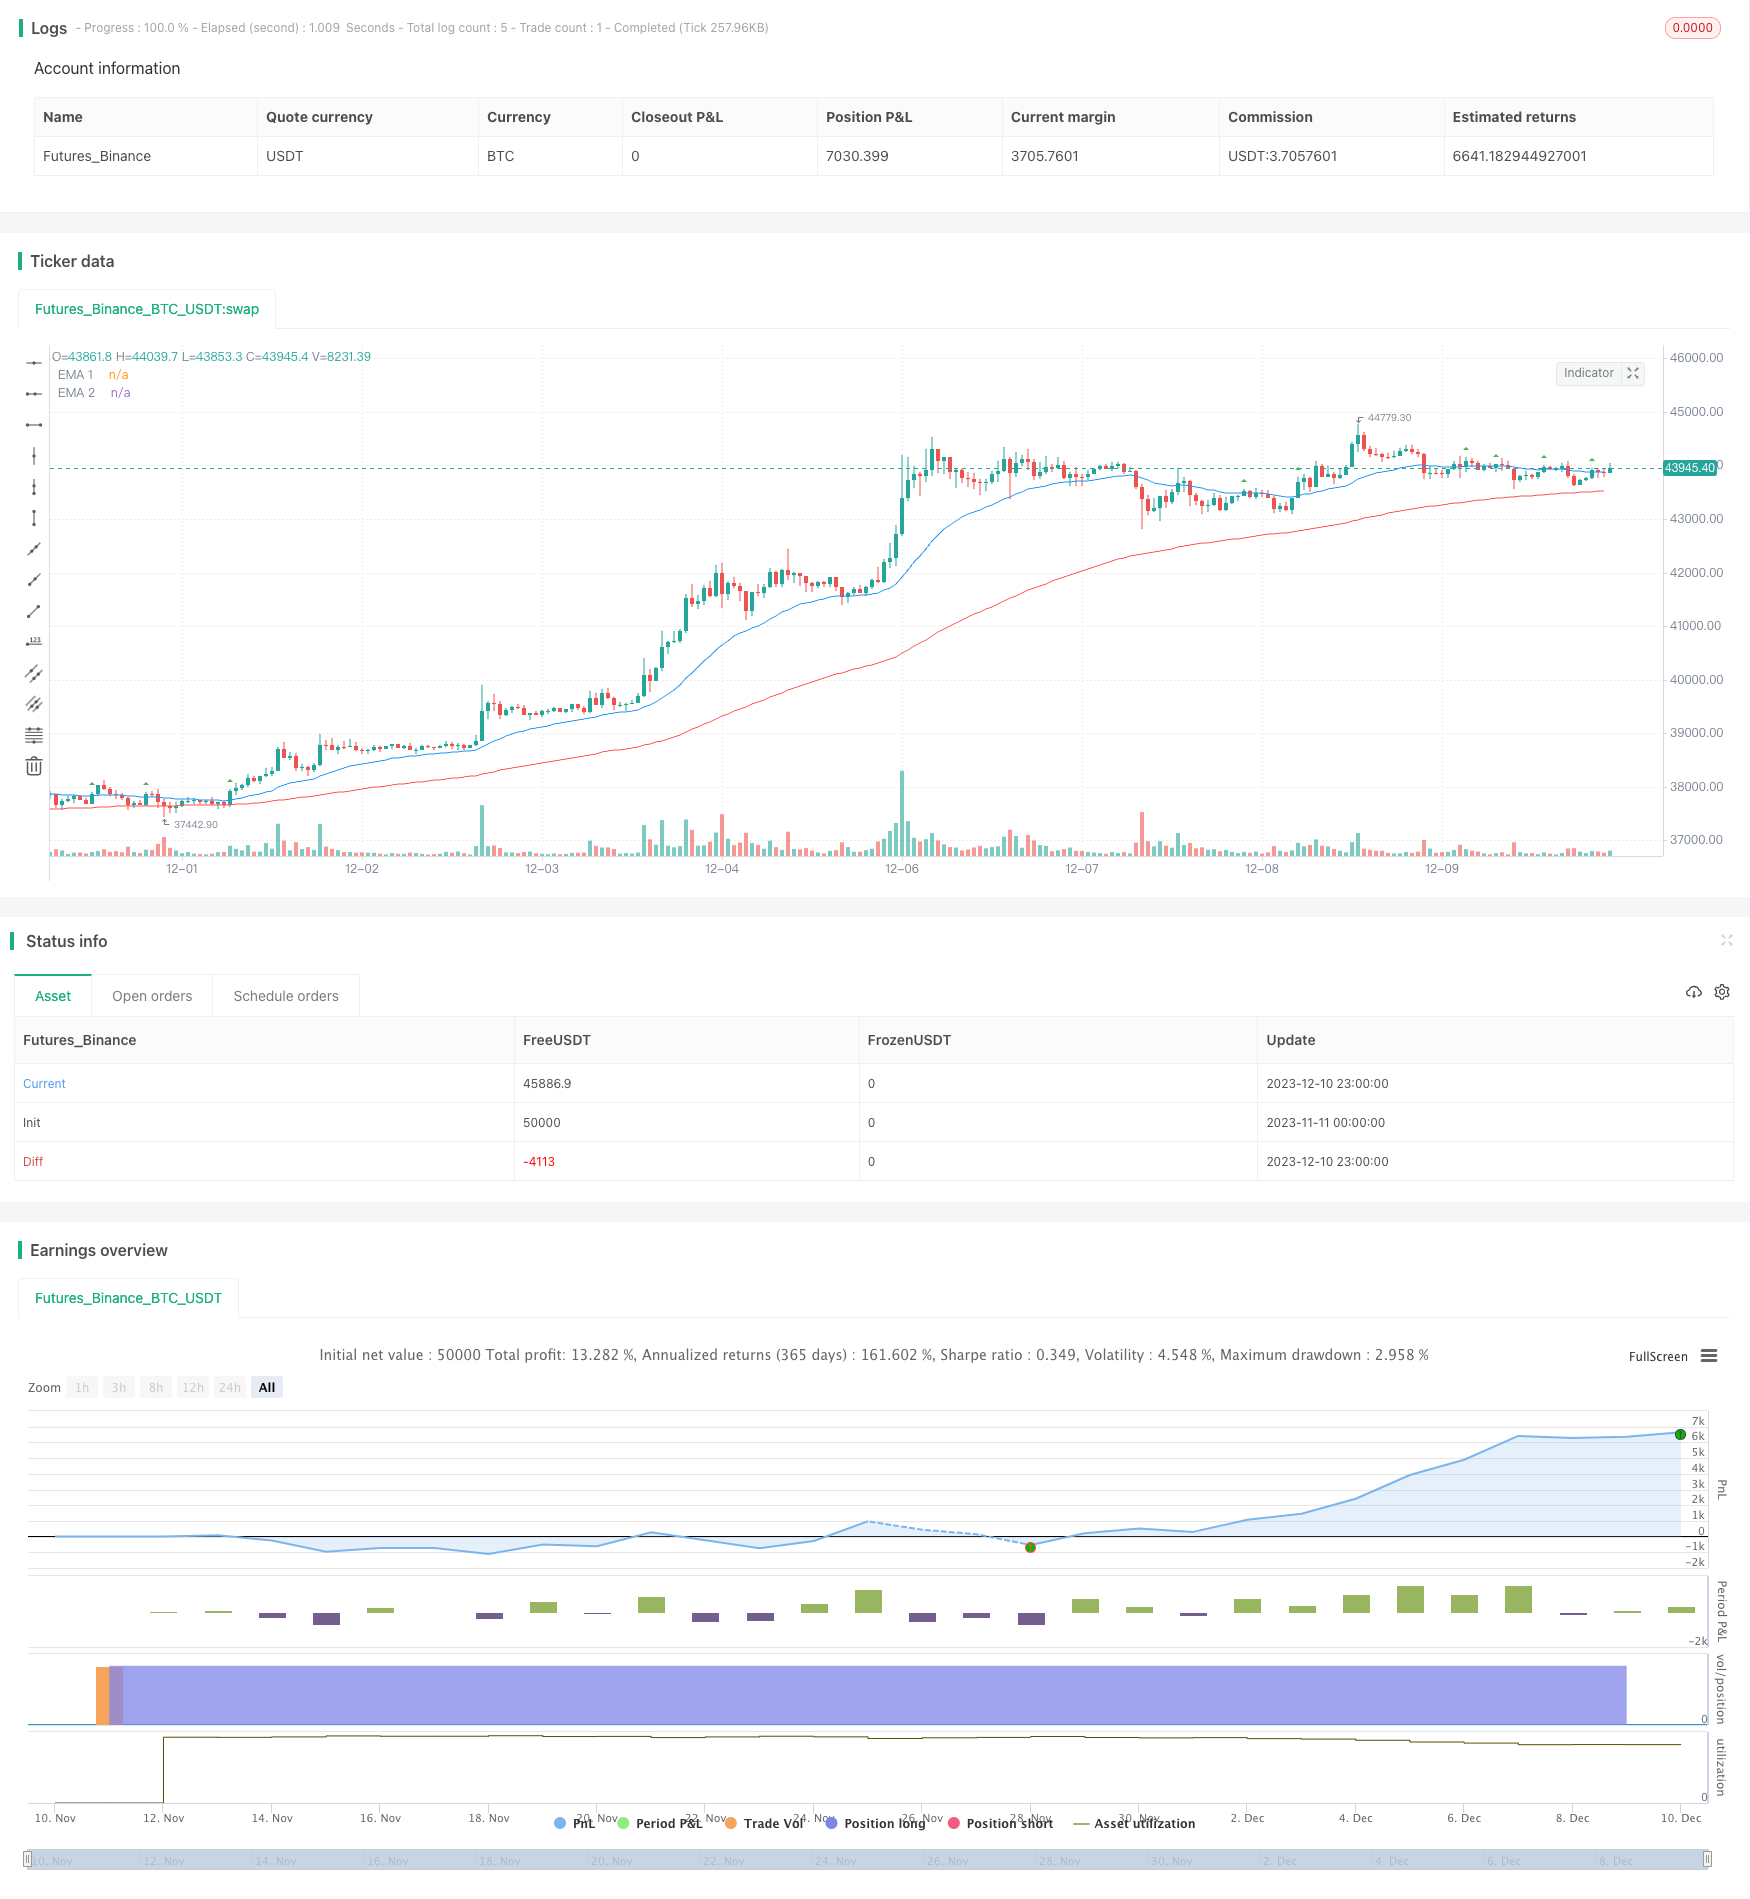 [trans]
概述
移动均线交叉交易策略是一种简单有效的量化交易策略。该策略运用指数移动均线(EMA)以及均线交叉信号来识别价格走势,确定买入和卖出的时机。相比其他更为复杂的策略,它更加简单易用,容易理解和实施。
策略原理
该策略的关键在于使用两条不同参数的EMA。EMA1设置为25天,EMA2设置为100天。当短期EMA从下方上穿较长期EMA时,是买入信号;当短期EMA从上方下穿较长期EMA时,是卖出信号。这样,短期EMA反映了价格的短期趋势和动量,较长期EMA反映了价格的长期趋势。两条EMA形成“黄金交叉”和“死亡交叉”就是买卖信号。
为过滤误差信号,策略还设置了一些附加条件。如要求柱体阳线为阴,要求交叉发生在RSI大于50时等。这可以避免因短期噪音造成错误交易。
优势分析
该策略最大的优点是简单明了,容易理解和使用。相比许多参数繁多、逻辑复杂的策略,它对交易者更为友好。
其次,该策略捕捉了价格在短期和长期上的趋势变化,利用均线的“金叉”和“死叉”这一经典技术指标识别价格反转,从而判断买入卖出的时机。这种方法行之有效,可以顺势而为,避免在没有明确信号的时候盲目交易。
最后,该策略还设置了适当的过滤条件。这可以减少误交易的概率,避免被市场噪音欺骗。这使得策略可以在复杂多变的市场中实现稳定的表现。
风险分析
该策略最大的风险在于,短期与长期趋势之间可能存在背离。价格短期内出现剧烈波动,触发了均线交叉信号,但长期趋势并未反转。这会导致错误交易亏损。此外,在长期横盘行情中,容易产生频繁的错误信号。
EMA参数设置也会影响策略表现。如果EMA周期设置不当,短期与长期EMA将失去代表性,无法有效识别趋势和趋势反转。这同样会增加错误信号和交易风险。
最后,附加过滤条件可能过于严格,错过了有效的交易机会。这会导致策略盈利能力下降。
优化建议
该策略可以考虑结合其他指标进行优化,如KDJ、MACD等,利用更多因素判断买卖时机,以减少错误信号。
此外,可以测试不同的参数,寻找最佳的EMA周期组合。也可以调整过滤条件参数,以兼顾交易频率和稳定性。
动态调整仓位也是一个改进策略的重要方向。例如,当两条EMA距离越远时,增加头寸;当两条EMA距离越近时,减少头寸。这样可以根据市场态势灵活调整风险。
总结
移动均线交叉策略是一个简单实用的量化交易策略。它利用EMA交叉买卖信号,顺应价格短期与长期趋势变化,以判断交易时机。该策略容易理解和实施,最大限度降低了复杂度,是初学者入门量化交易的好选择。但我们也不能忽视它可能存在的风险,需要对参数和过滤条件进行优化,使其可以适应更加复杂的市场环境。
||
Overview
The EMA crossover trading strategy is a simple yet effective quantitative trading strategy. It utilizes exponential moving averages (EMA) and crossover signals to identify price trends and determine entry and exit points. Compared to more complex strategies, it is simpler to understand and implement.
Strategy Logic
The key lies in using two EMAs with different parameters. EMA1 is set to 25 days and EMA2 is set to 100 days. When the shorter-term EMA crosses above the longer-term EMA, it is a buy signal. When the shorter EMA crosses below the longer EMA, it is a sell signal. Thus, the shorter EMA captures short-term price trends and momentum, while the longer EMA reflects long-term trends. The “golden cross” and “death cross” formed by the two EMAs generate trading signals.
To filter out false signals, the strategy also sets some additional criteria. For example, requiring a bullish candlestick pattern or crossover happening above 50 RSI level. This avoids erroneous trades due to short-term noise.
Advantages
The biggest advantage is the simplicity and intuitiveness of this strategy. Compared to strategies with numerous parameters and complex logic, it is much more user-friendly.
Also, it captures trend changes in both short-term and long-term timeframes, utilizing the classic technical indicator of EMA crosses to identify trend reversals and determine entries and exits, thus trading with the trend.
Lastly, appropriate filters are set to reduce false signals and avoid being misguided by market noise. This allows stable performance of the strategy in volatile markets.
Risks
The main risk is the divergence between short and long term trends. Dramatic price swings may trigger crossover signals but the longer-term trend remains unchanged, resulting in losing trades. Also, whipsaws often emerge in range-bound markets.
Inappropriate EMA period settings could also jeopardize strategy performance, as the representative power of the EMAs would diminish, rendering them ineffective in capturing trends and reversals. This introduces higher risks.
In addition, excessively strict filters may cause missing out potential trading opportunities, thus undermining profitability.
Enhancement
Combining with other indicators like KDJ, MACD etc. could help confirm trading signals and avoid false signals.
Testing different parameter sets to find optimal EMA periods, and adjusting filter criteria to balance trading frequency and reliability.
Dynamic position sizing is also important. For example, larger position when the two EMAs are further apart, smaller when closer. This adapts to changing market conditions.
Conclusion
The EMA crossover strategy is a simple yet practical quantitative trading strategy. It capitalizes on EMA crossover signals to trade along with short-term and long-term trends. Easy to understand and implement, it minimizes complexity and suits novice traders. However, its risks should not be neglected. Further optimization on parameters and filters can make the strategy more robust across varying markets.
[/trans]
Strategy Arguments
| Argument | Default | Description |
|---|---|---|
| v_input_1 | true | Position Size (%) |
| v_input_int_1 | 25 | EMA 1 |
| v_input_2_close | 0 | Source: close |
| v_input_int_2 | 100 | EMA 2 |
| v_input_3_close | 0 | Source: close |
| v_input_4 | 14 | RSI length |
Source (PineScript)
/*backtest
start: 2023-11-11 00:00:00
end: 2023-12-11 00:00:00
period: 1h
basePeriod: 15m
exchanges: [{"eid":"Futures_Binance","currency":"BTC_USDT"}]
*/

//@version=5
strategy('EMA Crossover Signal', shorttitle='EMA Crossover Signal', overlay=true)
// Define input for position size as a percentage of equity
position_size_pct = input(1, title='Position Size (%)') / 100

//Input EMA
len1 = input.int(25, minval=1, title='EMA 1')
src1 = input(close, title='Source')
ema1 = ta.ema(src1, len1)
len2 = input.int(100, minval=1, title='EMA 2')
src2 = input(close, title='Source')
ema2 = ta.ema(src2, len2)
//End of format

//Format RSI
lenrsi = input(14, title='RSI length')
outrsi = ta.rsi(close,lenrsi)

bodybar1 = math.abs(close - open)
bodybar2 = math.abs(close[1] - open[1])
// Plot the EMAs
plot(ema1, color=color.new(color.blue, 0), title='EMA 1')
plot(ema2, color=color.new(color.red, 0), title='EMA 2')

// EMA Crossover conditions
emaCrossoverUp = ta.crossover(ema1, ema2)
emaCrossoverDown = ta.crossunder(ema1, ema2)
var entrybar = close  // Initialize entrybar with the current close

// Calculate crossovers outside of the if statements
emaCrossoverUpOccured = ta.crossover(close, ema1) and ema1 > ema2 and bodybar1 > bodybar2 and close > entrybar
emaCrossoverDownOccured = ta.crossunder(close, ema1) and ema1 < ema2 and bodybar1 > bodybar2 and close < entrybar

plotshape(series=emaCrossoverUpOccured, location=location.abovebar, color=color.new(color.green, 0), style=shape.triangleup, title='New Buy Order', size=size.tiny)
plotshape(series=emaCrossoverDownOccured, location=location.belowbar, color=color.new(color.red, 0), style=shape.triangledown, title='New Sell Order', size=size.tiny)

if emaCrossoverUpOccured
    strategy.entry("Enter Long", strategy.long)
else if emaCrossoverDownOccured
    strategy.entry("Enter Short", strategy.short)
Detail
https://www.fmz.com/strategy/435154
Last Modified
2023-12-12 17:09:24