
11 KiB
Name
相对笔涨幅均线交叉策略Relative-Body-Index-Crossover-Strategy
Author
ChaoZhang
Strategy Description
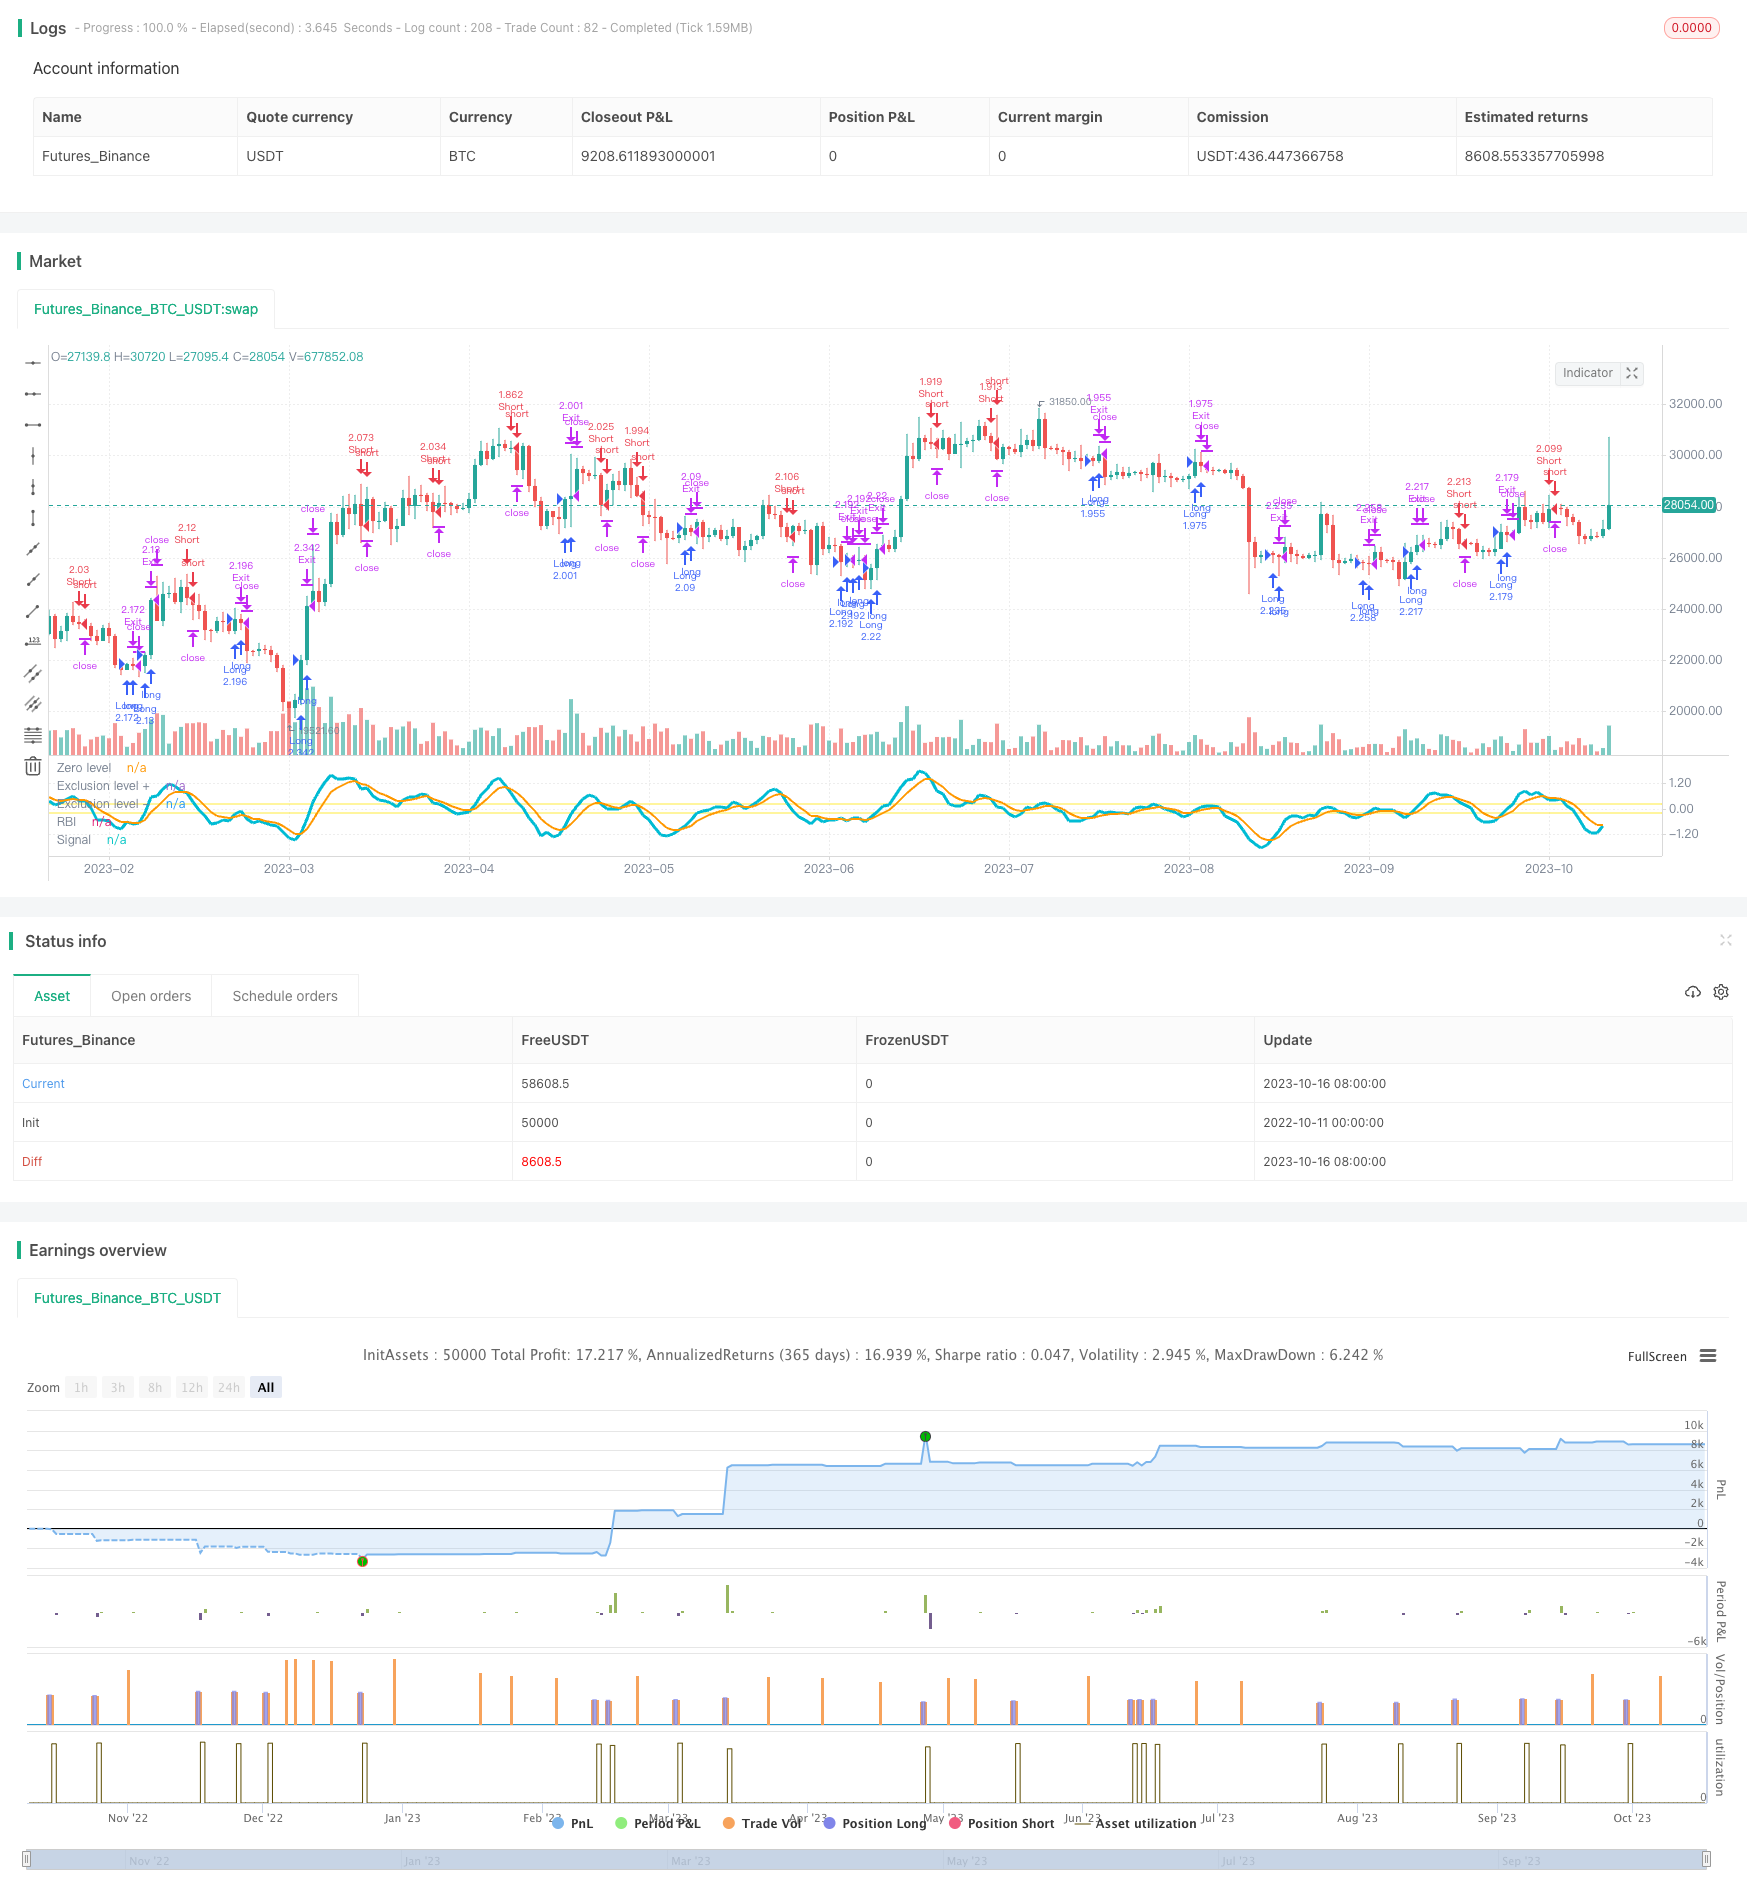
[trans]
概述
这个策略主要利用日线的相对笔体比率(RB)的均线交叉信号来判断趋势,并配合止损和止盈进行自动交易。策略名称中的“相对笔涨幅”指的是计算日线相对笔体涨幅的均线。
策略原理
该策略基于Vitelot的RBI指标,该指标计算的是日K线的相对笔体比率(RB)的移动平均。RB的计算方式是:
公式里,RB等于亚阳线的实体长度与整根K线长度之比,取正值;阴线的RB取负值。RB的取值范围在-1至1之间。
RBI指标通过RB的移动平均来过滤噪音,捕捉市场的本质特征。当RBI指标上穿其信号线时产生买入信号;当RBI指标下穿信号线时产生卖出信号。
为过滤掉多头不确定阶段的虚假信号,该策略在RBI指标上穿信号线时,还会判断收盘价是否高于13周期的EMA均线,若高于才产生真正的买入信号执行多头策略。类似地,只有收盘价低于13周期EMA时,才会执行空头策略。
该策略还设置了止损和止盈机制,以控制风险和锁定利润。开仓后会trail跟踪设置的止盈点数,同时设定固定点数的止损。
优势分析
-
RBI指标过滤了大量噪音,能捕捉市场趋势特征,避免被震荡市场的假信号误导。
-
结合均线过滤,能有效避免多头不确定时段的虚假信号,减少空头亏损。
-
止损止盈设置有助于降低个别仓位的损失风险,同时锁定利润,整体提高盈利率。
-
该策略参数较少,容易理解,适合用于自动交易。
风险分析
-
该策略仅基于RBI指标,如果指标本身产生错误信号,则整体策略也会失败。
-
指标参数设置不当也可能导致交易信号质量下降。
-
任何技术指标都可能在特定市况下失效,无法完全避免亏损。
-
止损点设置过小可能导致止损过于频繁;止损点过大又可能扩大单笔损失。
-
回撤控制不够可能导致账户爆仓风险。
优化方向
-
可以测试不同的参数组合,优化RBI指标的parameter。
-
可以加入其它辅助指标进行过滤,提高信号质量。
-
可以通过机器学习训练优化止损止盈的参数。
-
可以加入资金管理策略,控制整体仓位和风险敞口。
-
可以尝试不同持仓时间的策略,如隔夜持仓或短线交易。
总结
该策略整体来说是一个较为简单直接的趋势跟踪策略。它通过计算日线相对笔体比率的均线交叉来判断趋势方向,同时加入均线过滤和止损止盈来控制风险,可以有效避免震荡市的假信号。但任何技术指标策略都无法完全规避风险,仍需要注意参数优化、风险控制等方面的持续改进优化,才能获得长期稳定的 excess return。整体来说,该策略逻辑清晰、易于理解,适合自动交易,是一个非常实用的趋势跟踪策略。
||
Overview
This strategy mainly uses the moving average crossover signals of the relative body ratio (RB) of daily candlesticks to determine the trend, together with stop loss and take profit for automated trading. The "Relative Body Strength" in the strategy name refers to the moving average of the relative body strength of daily candlesticks.
Strategy Logic
The strategy is based on Vitelot's RBI indicator, which calculates the moving average of the relative body ratio (RB) of daily candlesticks. The RB is calculated as:
The formula calculates the ratio of the real body to the full length of the candlestick for bullish candles, taking positive values; and negative values for bearish candles. RB ranges from -1 to 1.
The RBI indicator uses the moving average of RB to filter out noise and capture the essence of market trends. A buy signal is generated when RBI crosses above its signal line, and a sell signal when crossing below.
To avoid false signals during uncertain bullish phases, the strategy also checks if the closing price is above the 13-period EMA before generating a true buy signal for long position. Similarly, only when the close is below the 13 EMA will the short position be executed.
The strategy also implements stop loss and take profit to control risks and lock in profits. After opening position, profit will be trailed based on the set points, with a fixed stop loss in points.
Advantage Analysis
-
RBI filters out significant noise and captures market trend characteristics, avoiding false signals from ranging markets.
-
Using moving average filter avoids false signals effectively during uncertain bullish phases, reducing losses from shorts.
-
Stop loss and take profit helps reduce loss risk on individual positions and lock in profits, improving overall profitability.
-
The strategy has few parameters and is easy to understand, suitable for automated trading.
Risk Analysis
-
The strategy relies solely on RBI, any wrong signals from the indicator could lead to failure.
-
Poor parameter tuning of the indicator could also worsen the quality of trading signals.
-
No technical indicators can completely avoid losses in certain market conditions.
-
Stop loss set too tight may result in too frequent stop outs; too wide may lead to large losses on single positions.
-
Insufficient drawdown control could lead to account wipeout risks.
Optimization Directions
-
Different parameter combinations can be tested to optimize the RBI parameters.
-
Additional indicators could be added for signal filtering and quality improvements.
-
Machine learning can be used to train and optimize the stop loss and take profit parameters.
-
Risk management strategies can be added to control overall position sizing and risk exposure.
-
Different holding periods like overnight holdings or short term scalping could be explored.
Conclusion
Overall this is a relatively simple and straightforward trend following strategy. It uses RBI crossover to determine trend direction, with additional filters and stop loss/take profit to control risks, effectively avoiding false signals from ranging markets. But no technical indicators can completely avoid risks. Continuous improvements such as parameter optimization, risk management are still needed for long term stable excess returns. The logic is clear and easy to understand, suitable for automated trading. It is a very practical trend following strategy.
[/trans]
Strategy Arguments
| Argument | Default | Description |
|---|---|---|
| v_input_1 | 5 | MA1 Period |
| v_input_2 | 5 | Signal Period |
| v_input_3 | 0.2 | Exclusion level |
| v_input_4 | false | Calculate the binary version |
| v_input_5 | false | Treshold Long |
| v_input_6 | false | Treshold Short |
| v_input_7 | 300 | SL Activation |
| v_input_8 | true | SL Trigger |
| v_input_9 | 120 | TP Activation |
| v_input_10 | true | TP Trigger |
| v_input_11 | true | From Month |
| v_input_12 | true | From Day |
| v_input_13 | 2019 | From Year |
| v_input_14 | 6 | To Month |
| v_input_15 | 19 | To Day |
| v_input_16 | 2020 | To Year |
Source (PineScript)
/*backtest
start: 2022-10-11 00:00:00
end: 2023-10-17 00:00:00
period: 1d
basePeriod: 1h
exchanges: [{"eid":"Futures_Binance","currency":"BTC_USDT"}]
*/

//@version=3
strategy("RBI Backtest /w TSSL", shorttitle="RBI Strategy", overlay=false, default_qty_type = strategy.percent_of_equity, default_qty_value = 100, initial_capital = 10000, slippage = 5)
// RBI:
//  The EMA of the relative body (RB) of Japanese candles is evaluated.
//  The RB of a candle (my definition) is simply the ratio of the body with respect to its full length
//  and taken positive for bull candles and negative for bear candles:
//      e.g. a bull "marubozo" has RB=1 a bear "marubozo" has RB=-1;
//      a "doji" has RB=0.
//  This simple indicator grasps the essence of the market by filtering out a great deal of noise.
//
//  A flag can be selected to calculate its very basic binary version, where a bull candle counts as a one
//  and a bear candle counts as a minus one.
//
//  Enter (or exit) the market when the signal line crosses the base line.
//  When the market is choppy we have a kind of alternating bear and bull candles so that
//  RBI is FLAT and usually close to zero.
//  Therefore avoid entering the market when RBI is FLAT and INSIDE the Exclusion level.
//  The exclusion level is to be set by hand: go back in history and check when market was choppy; a good
//  way to set it is to frame the oscillations of RBI whe price was choppy.
//
//  RBI is more effective when an EMA of price is used as filtering. I found EMA(13) to be
//  a decent filter: go long when base crosses signal upwards AND closing price is above EMA(13);
//  same concept for going short.
//
//  As any other indicator, use it with responsibility: THERE CAN'T BE A SINGLE MAGIC INDICATOR winning
//  all trades.
//
//  Above all, have fun.
//
// Vitelot/Yanez/Vts March 31, 2019

par1 = input(5, title="MA1 Period")
par2 = input(5, title="Signal Period")
exclusion = input(0.2, title="Exclusion level")

useBin = input(false, title="Calculate the binary version")

treshold_long = input(0, title="Treshold Long")
treshold_short = input(0, title="Treshold Short")

fixedSL = input(title="SL Activation", defval=300)
trailSL = input(title="SL Trigger", defval=1)
fixedTP = input(title="TP Activation", defval=120)
trailTP = input(title="TP Trigger", defval=1)

FromMonth = input(defval = 1, title = "From Month", minval = 1, maxval = 12)
FromDay   = input(defval = 1, title = "From Day", minval = 1, maxval = 31)
FromYear  = input(defval = 2019, title = "From Year", minval = 2017)
ToMonth   = input(defval = 6, title = "To Month", minval = 1, maxval = 12)
ToDay     = input(defval = 19, title = "To Day", minval = 1, maxval = 31)
ToYear    = input(defval = 2020, title = "To Year", minval = 2017)
start     = timestamp(FromYear, FromMonth, FromDay, 00, 00)  // backtest start window
finish    = timestamp(ToYear, ToMonth, ToDay, 23, 59)        // backtest finish window
startTimeOk()  => true // create function "within window of time" if statement true

ynSimple(t) =>
    s = (close>open)? 1: -1
    ema(sum(s,t),t)

ynRel(t) =>
    s = (close-open)/(high-low)
    ema(sum(s,t),t)

yn = useBin? ynSimple(par1): ynRel(par1)
sig = ema(yn,par2)


plot(yn, color=aqua, title="RBI", linewidth=3, transp=0)
plot(sig, color=orange, title="Signal", linewidth=2, transp=0)

hline(0, color=white, title="Zero level", editable=false)
hline(exclusion, color=yellow, title="Exclusion level +", editable=true, linestyle=line)
hline( 0-exclusion, color=yellow, title="Exclusion level -", editable=true, linestyle=line)

long = crossover(yn,sig) and yn < treshold_long
short = crossover(sig,yn)  and yn > treshold_short

// === STRATEGY - LONG POSITION EXECUTION ===
strategy.entry("Long", strategy.long, when= long and startTimeOk())
strategy.exit("Exit", qty_percent = 100, loss=fixedSL, trail_offset=trailTP, trail_points=fixedTP)
strategy.exit("Exit", when= short)
// === STRATEGY - SHORT POSITION EXECUTION ===
strategy.entry("Short", strategy.short, when= short and startTimeOk())
strategy.exit("Exit", qty_percent = 100, loss=fixedSL, trail_offset=trailTP, trail_points=fixedTP)
strategy.exit("Exit", when= long)
Detail
https://www.fmz.com/strategy/429564
Last Modified
2023-10-18 11:16:53