
8.5 KiB
Name
牛市追涨杀跌策略Bull-Market-Buy-Dips-Strategy
Author
ChaoZhang
Strategy Description
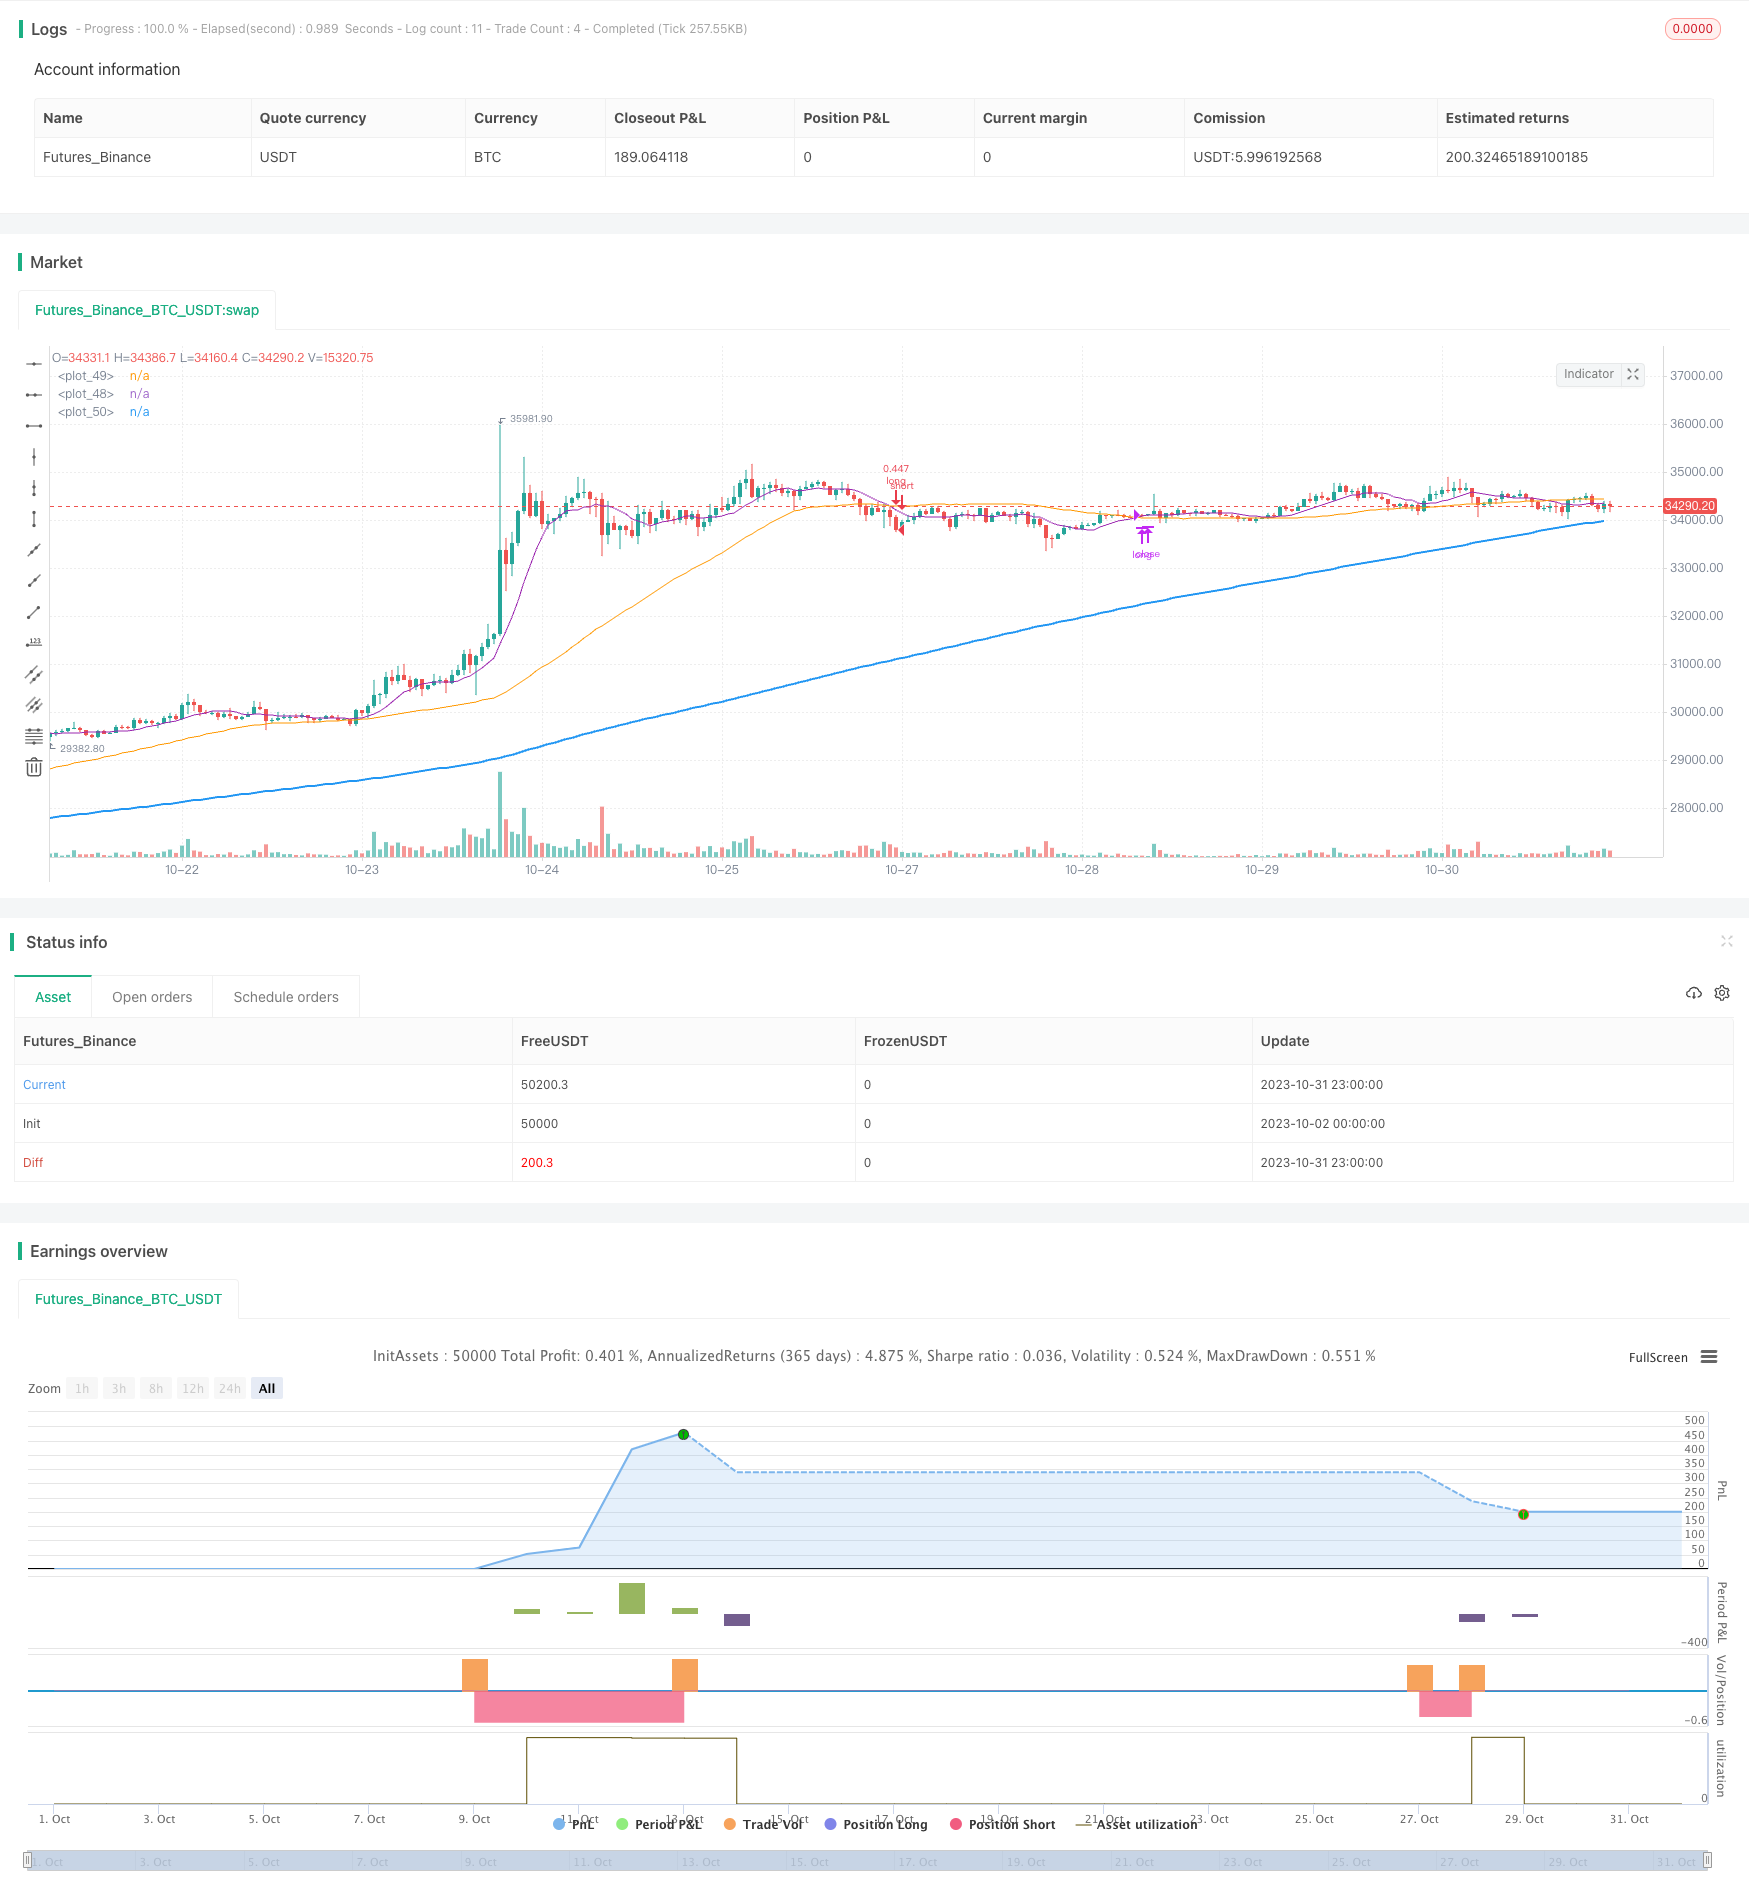 [trans]
概述
牛市追涨杀跌策略旨在牛市阶段利用RSI指标捕捉回撤买入,并利用双均线确认趋势买入。当价格重新回到多头趋势时,利用均线确认信号平仓获利。
策略原理
该策略首先设置回测的起始日期和结束日期,然后设置RSI参数以及快慢均线参数。
策略信号发出的逻辑是:
-
当RSI小于设定的阈值(默认35)时,表示处于超卖区,发出买入信号;
-
同时,快均线要高于慢均线,表示目前处于多头趋势,避免在盘整时买入;
-
当价格高于快均线,且快均线高于中均线时,发出平仓信号。
以上合理应用RSI指标和双均线的交叉原理,在牛市中捕捉回调买入机会,并在价格重新回到趋势上时及时获利了结。
策略优势分析
- 利用RSI指标有效识别超卖点位
- 快慢均线判断大趋势,避免买入震荡市
- 均线再次交叉判断回到趋势,及时获利
RSI指标非常适合捕捉反转点位。当RSI进入超卖区时买入,可以有效锁定超卖区买入时机。同时结合均线判断趋势,可以过滤震荡行情,避免在盘整时重复买入。最后利用均线交叉再次确认趋势,及时止盈,避免给回撤带来损失。
策略风险分析
- RSI参数设定不当,无法有效识别超卖区
- 均线参数选择不当,产生多次错误信号
- 止盈平仓过早或过晚
RSI参数如果设定过大或过小,将失去准确判断超卖区的效果。如果均线参数选择不当,快线过快或慢线过慢也会判断错误的趋势。止盈平仓的时机如果选择不当,过早平仓无法获利充分,过晚平仓又容易损失利润。
可以通过调整RSI参数,选取合适的均线周期,并测试不同的止盈方式来优化止盈效果。
策略优化方向
- 测试不同周期RSI参数
- 测试不同均线组合
- 尝试其他止盈方式,如移动止盈、突破止盈等
- 优化仓位管理
- 考虑交易费用影响
可以通过测试不同参数的RSI周期来优化超卖区判断。调整均线周期组合找到判断趋势的最佳参数。此外可以测试移动止盈、阻力止盈等其他止盈方式。优化仓位管理可以更好控制风险。最后考虑交易费用的影响可以使策略更加贴近实盘。
总结
牛市追涨杀跌策略整体思路清晰合理,综合运用RSI和均线原理,在趋势行情中有效把握买入时机和止盈时机。通过参数优化、止盈方式测试以及优化仓位管理可以进一步增强策略稳定性和实盘表现。该策略思路简单实用,适用于捕捉牛市阶段的回调机会,可以为投资组合带来较好收益。
||
Overview
The Bull Market Buy Dips strategy aims to buy the dips in bull market by utilizing RSI indicator and confirm the trend by double moving averages. When the price gets back to the uptrend, the moving averages crossover is used as profit taking signal.
Strategy Logic
The strategy first sets the backtesting start and end date, then configures the parameters for RSI and fast/slow moving averages.
The strategy signal logic is:
-
When RSI drops below the threshold (default 35), it triggers buy signal as it indicates oversold area.
-
The fast MA needs to be above slow MA, which confirms the current uptrend and avoids buying in consolidation.
-
When price goes above fast MA and fast MA is above medium MA, it triggers close signal to take profit.
The reasonable application of RSI and MA crossover principles helps catch pullback opportunities in bull market and take profits once the price resumes trend.
Advantage Analysis
- RSI effectively identifies oversold levels
- Fast/slow MAs determine the major trend and avoid buying in ranging market
- MA crossover again suggests the resumption of trend for timely profit taking
RSI is very suitable for catching reversal points. Buying when RSI enters oversold area allows accurately locking oversold opportunities. Using MAs to determine the trend can filter ranging market and prevent repeated buying in consolidation. Finally, the MA crossover confirms the trend again for timely taking profit and avoiding pullback loss.
Risk Analysis
- Improper RSI parameter may fail to identify oversold area effectively
- Wrong selection of MA parameters may generate multiple false signals
- Premature or delayed profit taking
If RSI parameter is set too wide or too narrow, it may lose the accuracy in judging oversold levels. Wrongly chosen fast or slow MA periods could also lead to false trend determination. If profit taking timing is improper, too early may miss further profits while too late may sacrifice gained profits.
Parameters of RSI can be optimized, suitable MA periods can be selected, and different profit taking mechanisms can be tested to improve profit taking performance.
Optimization Directions
- Test RSI parameters of different periods
- Try different MA combinations
- Attempt other profit taking mechanisms like trailing stop, breakout stop etc
- Optimize position sizing
- Consider trading cost impact
Different RSI periods can be tested to optimize oversold area judgment. Different MA period combinations can be tried to find the best parameters for trend determination. Other profit taking mechanisms like trailing stop, resistance stop can also be tested. Optimizing position sizing can better control risks. Finally, considering trading costs can make the strategy closer to live trading.
Summary
The Bull Market Buy Dips strategy has clear and sensible logic overall, skillfully utilizes RSI and MA principles to capture buying and profit taking timing in trending market. Through parameter optimization, profit taking tests and position sizing management, the robustness and real trading performance can be further enhanced. With simple and practical idea, this strategy is suitable for catching pullbacks in bull market and can bring decent profits to the portfolio.
[/trans]
Strategy Arguments
| Argument | Default | Description |
|---|---|---|
| v_input_1 | true | From Month |
| v_input_2 | 10 | From Day |
| v_input_3 | 2020 | From Year |
| v_input_4 | true | Thru Month |
| v_input_5 | true | Thru Day |
| v_input_6 | 2112 | Thru Year |
| v_input_7 | true | Show Date Range |
| v_input_8 | 14 | RSI period |
| v_input_9 | 9 | MAfast |
| v_input_10 | 50 | MAslow |
| v_input_11 | 200 | MAslow |
| v_input_12 | 35 | RSI Buy Signal |
Source (PineScript)
/*backtest
start: 2023-10-02 00:00:00
end: 2023-11-01 00:00:00
period: 1h
basePeriod: 15m
exchanges: [{"eid":"Futures_Binance","currency":"BTC_USDT"}]
*/

//@version=4
strategy(shorttitle='Buy The Dips in Bull Market',title='Buy The Dips in Bull Market (by Coinrule)', overlay=true, initial_capital = 1000, default_qty_type = strategy.percent_of_equity, default_qty_type = strategy.percent_of_equity, default_qty_value = 30, commission_type=strategy.commission.percent, commission_value=0.1)

//Backtest dates
fromMonth = input(defval = 1,  title = "From Month")
fromDay   = input(defval = 10,    title = "From Day")
fromYear  = input(defval = 2020, title = "From Year")
thruMonth = input(defval = 1,    title = "Thru Month")
thruDay   = input(defval = 1,    title = "Thru Day")
thruYear  = input(defval = 2112, title = "Thru Year")

showDate  = input(defval = true, title = "Show Date Range")

start     = timestamp(fromYear, fromMonth, fromDay, 00, 00)        // backtest start window
finish    = timestamp(thruYear, thruMonth, thruDay, 23, 59)        // backtest finish window
window()  => time >= start and time <= finish ? true : false       // create function "within window of time"


// RSI inputs and calculations
lengthRSI = input(14, title = 'RSI period', minval=1)
RSI = rsi(close, lengthRSI)

//MA inputs and calculations
inSignal=input(9, title='MAfast')
inlong1=input(50, title='MAslow')
inlong2=input(200, title='MAslow')


MAfast= sma(close, inSignal)
MAslow= sma(close, inlong1)
MAlong= sma(close, inlong2)


RSI_buy_signal= input(35, title='RSI Buy Signal')


//Entry


strategy.entry(id="long", long = true, when = RSI < RSI_buy_signal and MAlong < MAslow and window())

//Exit


strategy.close("long", when = close > MAfast and MAfast > MAslow and window())


plot(MAslow, color=color.orange, linewidth=1)
plot(MAfast, color=color.purple, linewidth=1)
plot(MAlong, color=color.blue, linewidth=2)
Detail
https://www.fmz.com/strategy/430878
Last Modified
2023-11-02 16:21:21