
13 KiB
Name
混沌交易规则止损策略Chaotic-Trading-Rules-Stop-Loss-Strategy
Author
ChaoZhang
Strategy Description
 [trans]
概述
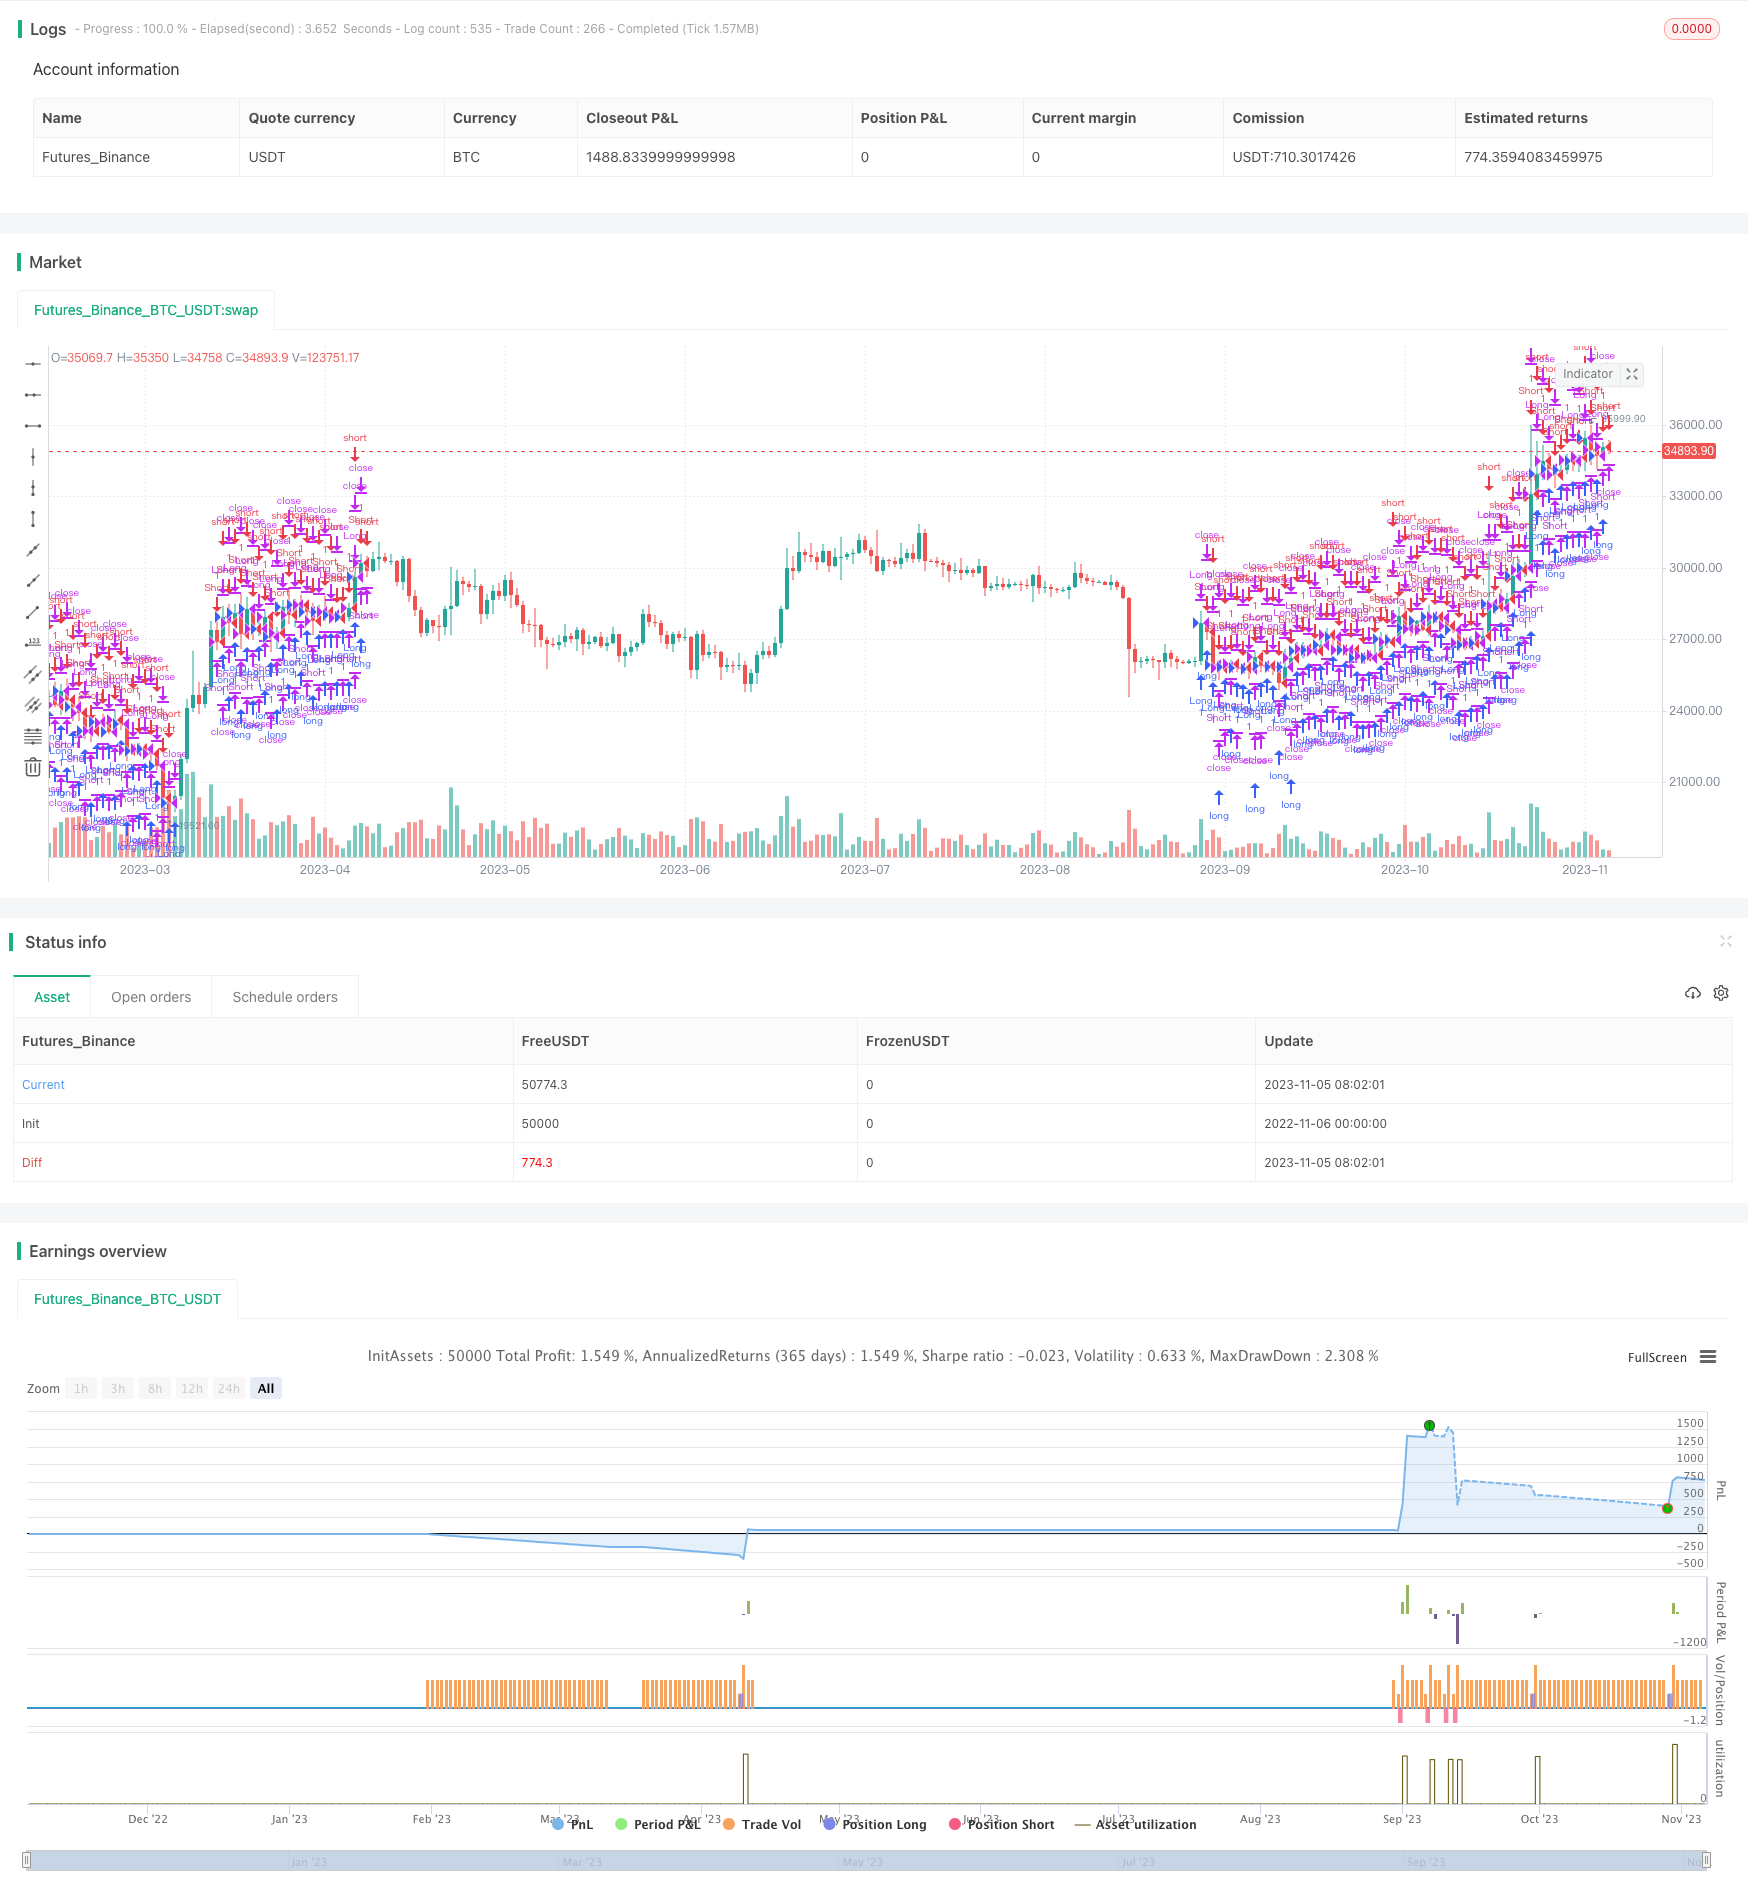
本策略的核心思想是在RSI策略的基础上,加入了一些关键的交易管理规则,包括止损、止盈、追踪止损,以及杠杆追踪止损。这使得策略在回测期间能够在趋势行情中获得更高收益,同时在震荡行情中尽量减少亏损。
策略原理
该策略首先计算RSI指标,当RSI低于超买线时做多,当RSI高于超卖线时做空。
做多信号触发后,记录该时刻的最高价作为追踪止损的参考点。如果价格低于追踪止损点减去止损幅度,则止损平仓。
做空信号触发后,记录该时刻的最低价作为追踪止损的参考点。如果价格高于追踪止损点加上止损幅度,则止损平仓。
同时设置固定止盈和止损距离。如果价格达到止盈距离,则止盈清仓;如果达到止损距离,则止损清仓。
另外,根据杠杆设置杠杆追踪止损线。如果价格触及杠杆追踪止损线,则清仓止损。
通过在趋势向上时追踪最高价止损,趋势向下时追踪最低价止损,结合固定止盈止损距离,可以在趋势行情中获得更高收益。同时设置杠杆追踪止损可以尽量避免亏损扩大。
优势分析
该策略最大的优势在于引入了多个交易管理规则,在发挥RSI策略优势的同时,可以更好地控制风险。
具体来说,策略的优势有:
-
在趋势行情中,追踪止损可以持续跟踪趋势获利,从而获得更高收益。
-
固定止盈止损距离可以锁定部分利润,避免全部盈利在趋势反转时被套牢。
-
杠杆追踪止损可以尽量避免亏损扩大,控制风险。
-
多种止损方式的结合可以在不同市场环境中发挥各自的优势,整体上提高策略的稳定性。
-
策略参数可以灵活调整,适应不同交易品种和市场环境。
-
策略逻辑清晰易理解,便于验证、优化和应用。
风险分析
该策略的主要风险来源于:
-
RSI策略本身存在一定的错交易风险,可能出现止损被触发的情况。可以通过调整RSI参数来优化。
-
在止损点附近震荡可能频繁触发止损。可以适当扩大止损距离来避免。
-
止盈距离无法完全锁定趋势行情中的利润。可以结合其它指标判断趋势结束时机。
-
固定止损距离可能过小,无法完全避免亏损。可以考虑采用振荡止损或动态止损。
-
杠杆过高可能导致杠杆追踪止损过于靠近开仓价格。应适当降低杠杆设置。
-
回测时间范围无法完全代表未来市场行情。应做好风险控制,并验证不同时间段的效果。
以上风险可以通过参数调整、优化止损机制、风险控制等方式得到缓解。但任何策略都无法完全规避市场风险,需做好风险控制。
优化方向
该策略可以从以下几个方向进行进一步优化:
-
优化RSI参数,降低错交易概率。可以测试不同市场的最优参数组合。
-
尝试其他指标判断入场时机,如KD,MACD等,结合RSI形成多重过滤。
-
利用机器学习等方法动态优化止损止盈参数。
-
尝试更复杂的止损方式,如振荡止损、平均止损、动态止损等。
-
优化杠杆水平的设置,不同杠杆对收益和风险控制的影响。
-
根据市场环境变化自动调整参数,如α-Dual Thrust。
-
结合其它因素判断趋势持续性,如交易量能量等。
-
利用深度学习等技术开发更稳定和可解释的止损方式。
-
测试不同品种和时段的数据,评估策略的稳健性。
总结
本策略在RSI策略基础上增加多种止损方式,充分发挥止损在趋势获利和风险控制中的双重作用。策略优化空间还很大,可以从多方面入手提高策略优势并降低风险。止损策略思想普适性强,可扩展到更多策略和交易品种中,是非常值得研究的方向。通过不断优化和验证,止损策略可以成为机械交易体系中极为重要的一环。
||
Overview
The core idea of this strategy is to add some key trading management rules on the basis of RSI strategy, including stop loss, take profit, trailing stop loss, and leverage tracking stop loss. This allows the strategy to achieve higher returns during trending markets and minimize losses during ranging markets in backtest.
Strategy Logic
The strategy first calculates the RSI indicator. It goes long when RSI is below the oversold level and goes short when RSI is above the overbought level.
After a long signal is triggered, the highest price at that time is recorded as the trailing stop loss reference point. If the price falls below the stop loss point minus the stop loss range, the position is closed by stop loss.
After a short signal is triggered, the lowest price at that time is recorded as the trailing stop loss reference point. If the price rises above the stop loss point plus the stop loss range, the position is closed by stop loss.
At the same time, fixed take profit and stop loss distances are set. If the price reaches the take profit distance, take profit to close position. If it reaches the stop loss distance, close position by stop loss.
In addition, a leverage tracking stop loss line is set based on the leverage. If the price hits the leverage tracking stop loss line, the position is closed by stop loss.
By trailing the highest price during uptrends and the lowest price during downtrends, combined with fixed take profit and stop loss distances, higher returns can be achieved in trending markets. Meanwhile, leverage tracking stop loss helps avoid expanding losses.
Advantage Analysis
The biggest advantage of this strategy is the introduction of multiple trading management rules that better control risks while leveraging the strengths of RSI strategy.
Specifically, the advantages are:
-
Trailing stop loss can continuously follow the trend to gain higher profit during trending markets.
-
Fixed take profit and stop loss lock in some profits and avoid full profits being wiped out when trend reverses.
-
Leverage tracking stop loss helps avoid expanding losses and controls risk.
-
The combination of various stop loss methods can exert their strengths in different market environments, improving overall stability of the strategy.
-
Flexible adjustment of strategy parameters fits different trading instruments and market environments.
-
Easy to understand logic facilitates verification, optimization and application.
Risk Analysis
The main risks of this strategy come from:
-
RSI strategy itself has some whipsaw risks, which may trigger stop loss. RSI parameters can be optimized.
-
Oscillation around stop loss points may frequently trigger stop loss. Stop loss range can be widened.
-
Take profit distance cannot fully lock in profits during trending markets. Other indicators can help determine trend ending.
-
Fixed stop loss distance may be too small to fully avoid losses. Consider using oscillating stop loss or dynamic stop loss.
-
Excessive leverage leads to stop loss being too close to entry price. Lower leverage setting should be used.
-
Backtest period may not fully represent future market conditions. Proper risk control should be implemented and different periods tested.
The above risks can be mitigated through parameter tuning, optimizing stop loss mechanisms, risk control etc. But no strategy can completely avoid market risks. Proper risk control is a must.
Optimization Directions
The strategy can be further optimized in the following aspects:
-
Optimize RSI parameters to reduce whipsaw trades, and test optimum parameters for different markets.
-
Try other indicators like KD, MACD combined with RSI to filter entries.
-
Use machine learning to dynamically optimize stop loss and take profit parameters.
-
Test more complex stop loss mechanisms like oscillating stop loss, average stop loss, dynamic stop loss etc.
-
Optimize leverage setting and study impacts on profit and risk control.
-
Auto adjust parameters based on market regime changes, like α-Dual Thrust.
-
Incorporate other factors to determine trend persistence, e.g. volume energy.
-
Use deep learning models to develop more robust and interpretable stop loss ways.
-
Test data from different instruments and time periods to evaluate strategy robustness.
Conclusion
This strategy complements RSI strategy with various stop loss methods, giving full play to the dual effects of stop loss in profiting from trends and controlling risks. There is still large room for optimization. The ideas can be extended to more strategies and trading instruments. Stop loss strategies are worth in-depth research and can become a very important part of mechanical trading systems after continuous optimization and verification.
[/trans]
Strategy Arguments
| Argument | Default | Description |
|---|---|---|
| v_input_1 | 2011 | Backtest Start Year |
| v_input_2 | 8 | Backtest Start Month |
| v_input_3 | true | Backtest Start Day |
| v_input_4 | 2016 | Backtest Stop Year |
| v_input_5 | 9 | Backtest Stop Month |
| v_input_6 | 29 | Backtest Stop Day |
| v_input_7 | true | Color Background? |
| v_input_8 | 14 | length |
| v_input_9 | 30 | overSold |
| v_input_10 | 70 | overBought |
| v_input_11 | 99999 | Trailing Stop |
| v_input_12 | 99999 | Take Profit |
| v_input_13 | 99999 | Stop Loss |
| v_input_14 | 200 | Leverage |
Source (PineScript)
/*backtest
start: 2022-11-06 00:00:00
end: 2023-11-06 00:00:00
period: 1d
basePeriod: 1h
exchanges: [{"eid":"Futures_Binance","currency":"BTC_USDT"}]
*/

//@version=2
strategy("Adding some essential components to a prebuilt RSI strategy", overlay=true)

/////////////// Component Code Start ///////////////
testStartYear = input(2011, "Backtest Start Year")
testStartMonth = input(8, "Backtest Start Month")
testStartDay = input(1, "Backtest Start Day")
testPeriodStart = timestamp(testStartYear,testStartMonth,testStartDay,0,0)

testStopYear = input(2016, "Backtest Stop Year")
testStopMonth = input(9, "Backtest Stop Month")
testStopDay = input(29, "Backtest Stop Day")
// testStopDay = testStartDay + 1
testPeriodStop = timestamp(testStopYear,testStopMonth,testStopDay,0,0)

// A switch to control background coloring of the test period
testPeriodBackground = input(title="Color Background?", type=bool, defval=true)
testPeriodBackgroundColor = testPeriodBackground and (time >= testPeriodStart) and (time <= testPeriodStop) ? #00FF00 : na
bgcolor(testPeriodBackgroundColor, transp=97)

testPeriod() => true
/////////////// Component Code Stop ///////////////

///////////// RSI component /////////////
length = input( 14 )
overSold = input( 30 )
overBought = input( 70 )
price = close

vrsi = rsi(price, length)
notna = not na(vrsi)

/////////////// STRATEGY ///////////////
ts = input(99999, "Trailing Stop") / 100
tp = input(99999, "Take Profit") / 100
sl = input(99999, "Stop Loss") / 100

long = notna and crossover(vrsi, overSold)
short = notna and crossunder(vrsi, overBought)

last_long = long ? time : nz(last_long[1])
last_short = short ? time : nz(last_short[1])

long_signal = crossover(last_long, last_short)
short_signal = crossover(last_short, last_long)

last_open_long_signal = long_signal ? open : nz(last_open_long_signal[1])
last_open_short_signal = short_signal ? open : nz(last_open_short_signal[1])

last_long_signal = long_signal ? time : nz(last_long_signal[1])
last_short_signal = short_signal ? time : nz(last_short_signal[1])

in_long_signal = last_long_signal > last_short_signal
in_short_signal = last_short_signal > last_long_signal

last_high = not in_long_signal ? na : in_long_signal and (na(last_high[1]) or high > nz(last_high[1])) ? high : nz(last_high[1])
last_low = not in_short_signal ? na : in_short_signal and (na(last_low[1]) or low < nz(last_low[1])) ? low : nz(last_low[1])

long_ts = not na(last_high) and high <= (last_high - ts) //and high >= last_open_long_signal
short_ts = not na(last_low) and low >= (last_low + ts) //and low <= last_open_short_signal

long_tp = high >= (last_open_long_signal + tp)
short_tp = low <= (last_open_short_signal - tp)

long_sl = low <= (last_open_long_signal - sl)
short_sl = high >= (last_open_short_signal + sl)

leverage = input(200, "Leverage")
long_call = last_open_long_signal - (0.8 + 0.2 * (1/leverage)) / leverage * last_open_long_signal
short_call = last_open_short_signal + (0.78 + 0.2 * (1/leverage)) / leverage * last_open_short_signal
long_call_signal = low <= long_call
short_call_signal = high >= short_call

if testPeriod()
    strategy.entry("Long", strategy.long, when=long_signal)
    strategy.entry("Short", strategy.short, when=short_signal)

    // plot(long_call, color=red)
    // plot(short_call, color=green)
    strategy.close("Long", when=long_call_signal)
    strategy.close("Short", when=short_call_signal)
    strategy.close("Long", when=long_tp)
    strategy.close("Short", when=short_tp)
    strategy.close("Long", when=long_sl)
    strategy.close("Short", when=short_sl)
    strategy.close("Long", when=long_ts)
    strategy.close("Short", when=short_ts)
Detail
https://www.fmz.com/strategy/431415
Last Modified
2023-11-07 16:44:31