
9.4 KiB
Name
波动率价格通道均线交易策略Volatility-Price-Channel-Moving-Average-Trading-Strategy
Author
ChaoZhang
Strategy Description
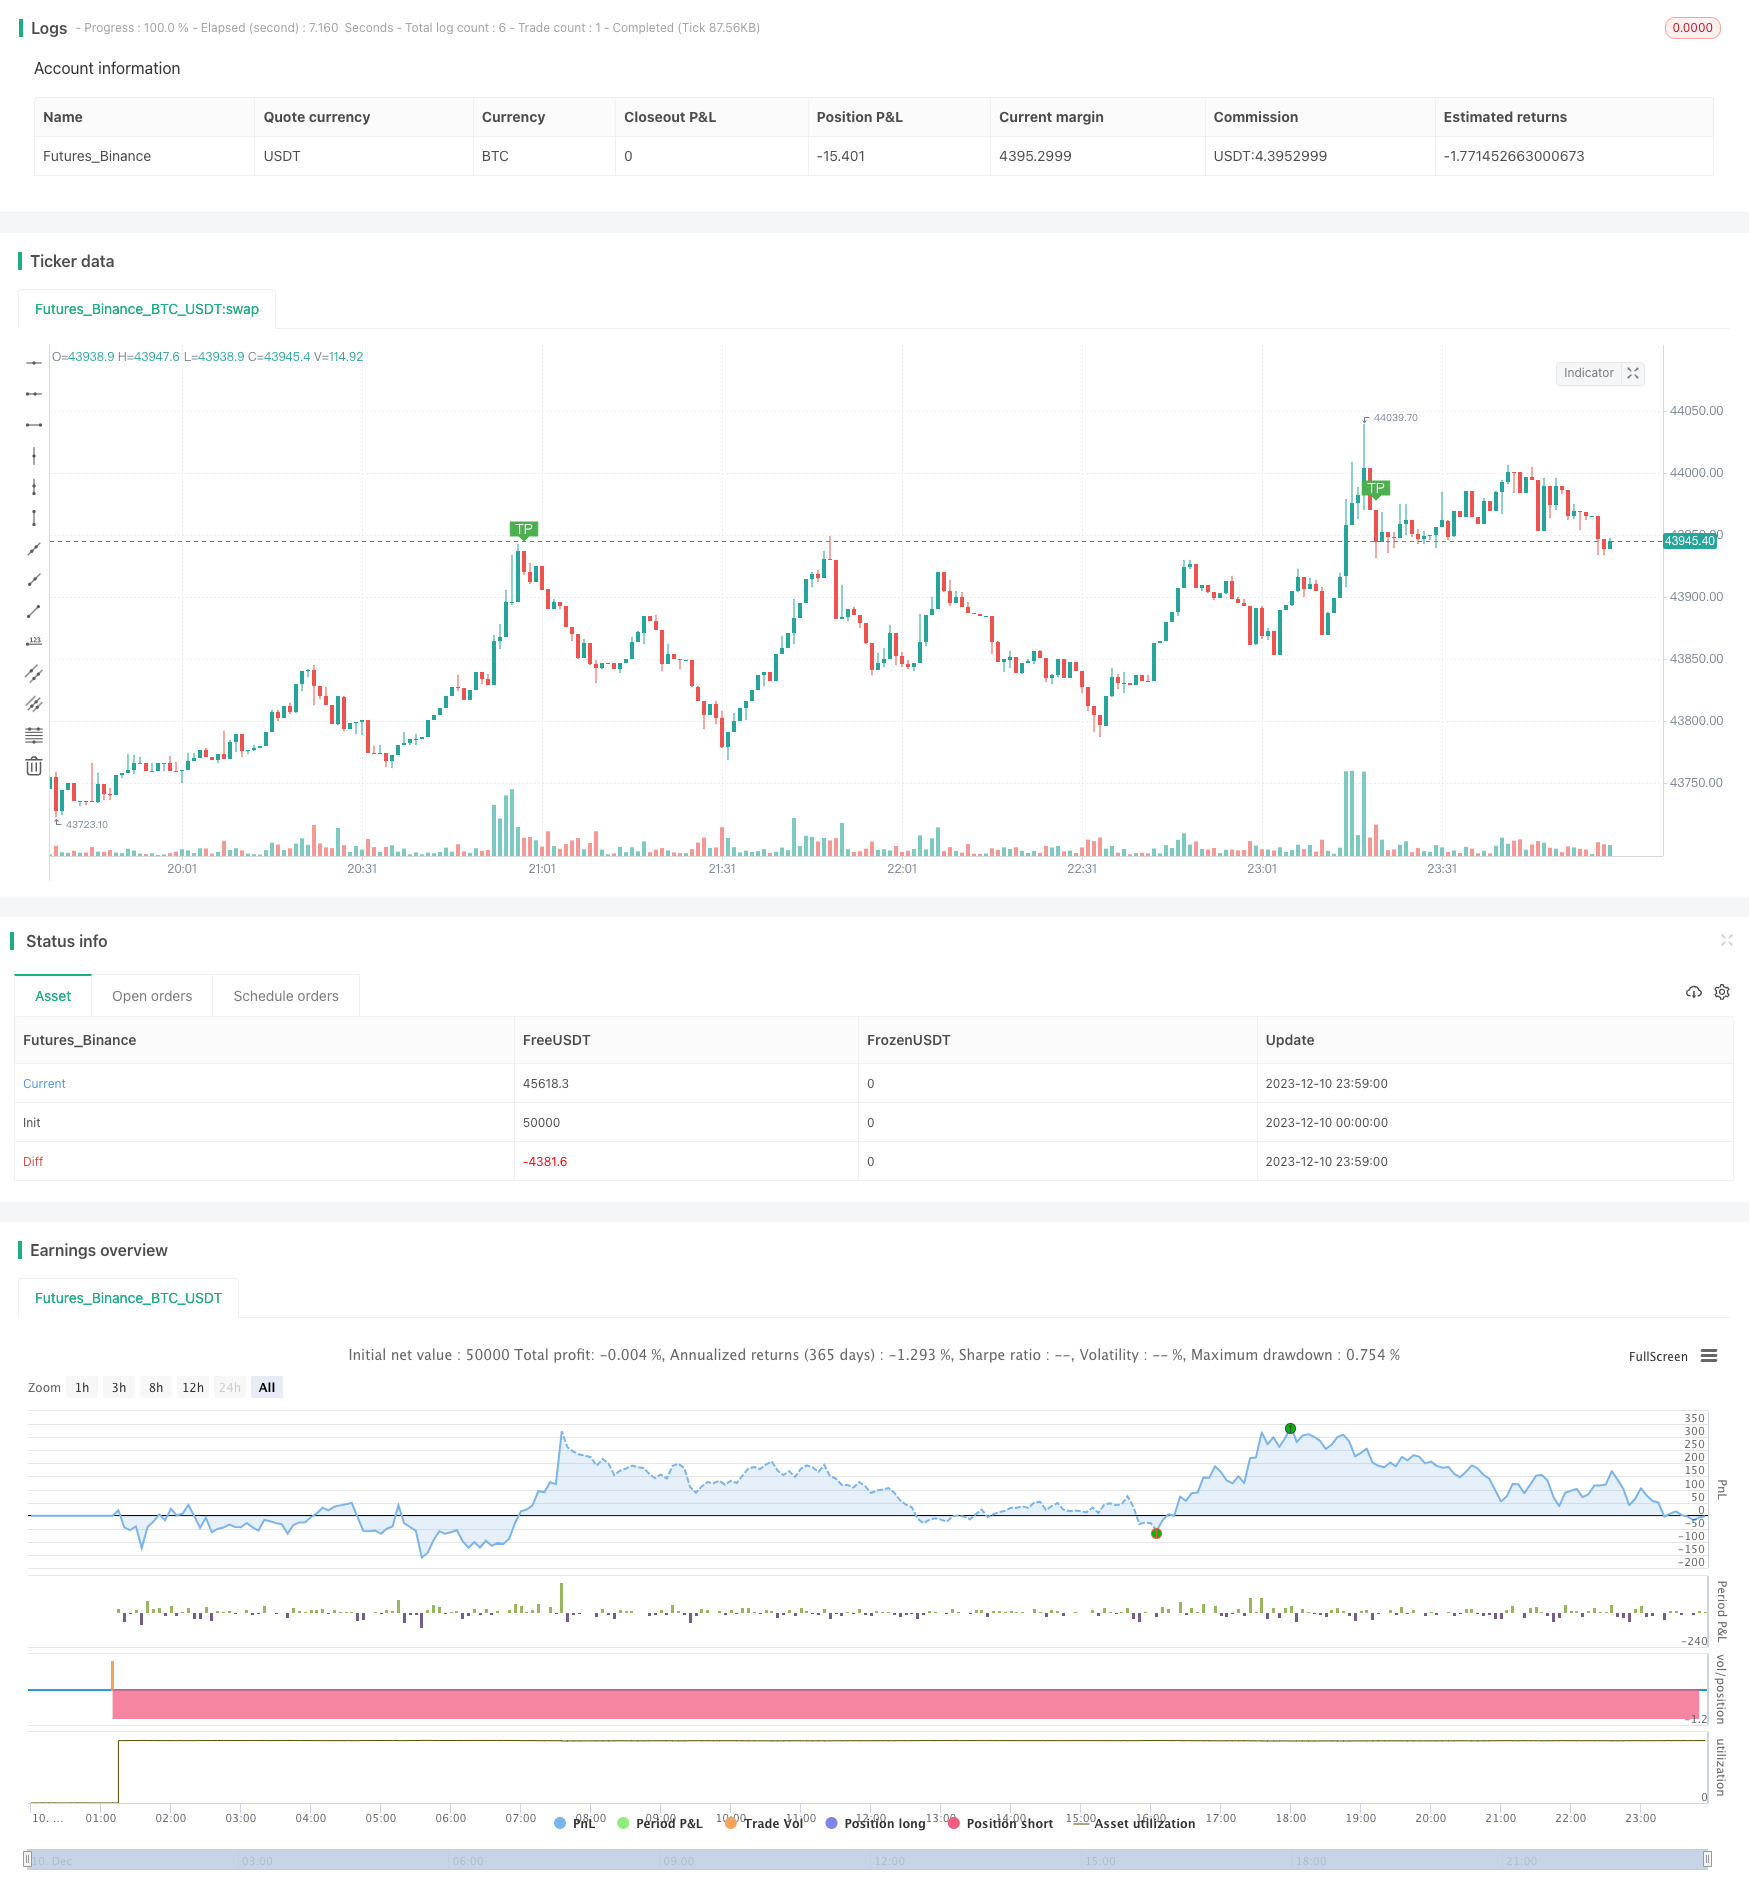 [trans]
概述
该策略基于超级趋势指标和价格通道指标,结合均线信号进行交易。其核心思想是利用价格通道判断当前价格是否处于异常状态,超级趋势判断当前趋势方向,并与均线信号组合产生交易信号。
策略原理
-
计算超级趋势指标。其中上轨线和下轨线分别为当前价格加/减去ATR指标的N倍。当价格高于上轨时为看涨,价格低于下轨时为看跌。
-
计算价格通道指标。其中价格通道线为价格的N日内标准差的M倍。价格高于/低于通道线视为异常状态。
-
计算均线。分别取开盘价、收盘价和超级趋势的平均线。
-
产生交易信号:
-
买入信号:收盘价上穿超级趋势线且高于开盘价均线
-
卖出信号:收盘价下穿超级趋势线且低于开盘价均线
-
-
设置止损止盈价格通道。
策略优势分析
-
结合多个指标,避免假信号。
-
利用价格通道判断价格异常状态,可过滤掉一些不理想的入场点。
-
均线结合判断趋势方向,避免逆势操作。
-
设置止损止盈范围,控制风险。
风险分析
-
参数设置过于主观,需要优化。
-
止损止盈范围可能设置过大过小。
-
价格通道参数可能不适合全部品种,需要根据不同品种分别测试。
-
在趋势剧烈变化时,可能产生较大亏损。
优化方向
-
对参数进行测试优化,找到最佳参数组合。
-
测试不同的均线周期,选取最优参数。
-
对多种品种进行回测,根据表现分别选择参数。
-
优化止损策略,避免单次损失过大。
总结
本策略综合多种指标判断价格异常和趋势方向,在理论上可以过滤掉一定假信号。但参数设置依然比较主观,有一定优化空间。此外在具体实盘中,还需要考虑手续费、滑点等交易成本的影响。总体来说,本策略作为趋势跟踪策略较为适合,但需要针对不同品种进行参数优化调整。
||
Overview
This strategy is based on the Super Trend indicator and price channel indicator, combined with moving average signals for trading. Its core idea is to use the price channel to judge whether the current price is in an abnormal state, the Super Trend to determine the current trend direction, and generate trading signals in combination with the moving average signals.
Strategy Logic
-
Calculate the Super Trend indicator. The upper and lower rails are the current price plus/minus N times the ATR indicator respectively. When the price is higher than the upper rail, it is bullish. When the price is lower than the lower rail, it is bearish.
-
Calculate the price channel indicator. The price channel line is M times the N-day standard deviation of the price. Prices higher/lower than the channel line are considered abnormal states.
-
Calculate moving averages. Take the average lines of open price, close price and Super Trend respectively.
-
Generate trading signals:
-
Buy signal: Close price crosses above Super Trend line and is higher than open price moving average.
-
Sell signal: Close price crosses below Super Trend line and is lower than open price moving average.
-
-
Set stop loss and take profit price channel.
Advantage Analysis
-
Combining multiple indicators avoids false signals.
-
Using price channel to judge abnormal price states can filter out some undesirable entry points.
-
Moving averages combined with judging trend direction avoid trading against the trend.
-
Setting stop loss and take profit range controls risk.
Risk Analysis
-
Parameter settings are too subjective and need optimization.
-
Stop loss and take profit range may be set too wide or too narrow.
-
Price channel parameters may not suit all products, separate testing is needed.
-
Significant losses may occur during drastic trend changes.
Optimization Directions
-
Test and optimize parameters to find optimal combinations.
-
Test moving averages with different periods to select optimal parameters.
-
Backtest on multiple products and select parameters according to performance respectively.
-
Optimize stop loss strategy to avoid excessively large single loss.
Conclusion
This strategy combines multiple indicators to judge price abnormalities and trend directions, which can theoretically filter out some false signals. However, parameter settings are still relatively subjective with room for optimization. In addition, trading costs like commissions and slippage should be considered in actual trading. Overall, this strategy is more suitable as a trend following strategy, but parameters need to be optimized and adjusted for different products.
[/trans]
Strategy Arguments
| Argument | Default | Description |
|---|---|---|
| v_input_1 | 720 | tf |
| v_input_2 | true | SuperTrend Multiplier |
| v_input_3 | 10 | SuperTrend Period |
| v_input_4 | 2 | TP |
| v_input_5 | 150 | TP length |
Source (PineScript)
/*backtest
start: 2023-12-10 00:00:00
end: 2023-12-11 00:00:00
period: 1m
basePeriod: 1m
exchanges: [{"eid":"Futures_Binance","currency":"BTC_USDT"}]
*/

//@version=4
strategy(title="Vol ST VM", overlay=true)

source = close
hilow = ((high - low)*100)
openclose = ((close - open)*100)
vol = (volume / hilow)
spreadvol = (openclose * vol)
VPT = spreadvol + cum(spreadvol)
window_len = 28

v_len = 14
price_spread = stdev(high-low, window_len)

v =  spreadvol + cum(spreadvol)
smooth = sma(v, v_len)
v_spread = stdev(v - smooth, window_len)
shadow = (v - smooth) / v_spread * price_spread

out = shadow > 0 ? high + shadow : low + shadow
//
src = out
src1=open
src2=low
src3=high
tf =input(720)
len = timeframe.isintraday and timeframe.multiplier >= 1 ?
   tf / timeframe.multiplier * 7 :
   timeframe.isintraday and timeframe.multiplier < 60 ?
   60 / timeframe.multiplier * 24 * 7 : 7

c = ema(src, len)
plot(c,color=color.red)
o = ema(src1,len)
plot(o,color=color.blue)
//h = ema(src3,len)
//l=ema(src2,len)
//
col=c > o? color.lime : color.orange
vis = true
vl = c
ll = o
m1 = plot(vl, color=col, linewidth=1, transp=60)
m2 = plot(vis ? ll : na,  color=col, linewidth=2, transp=80)

fill(m1, m2,  color=col, transp=70)
//

vpt=ema(out,len)

// INPUTS //
st_mult   = input(1,   title = 'SuperTrend Multiplier', minval = 0, maxval = 100, step = 0.01)
st_period = input(10, title = 'SuperTrend Period',     minval = 1)

// CALCULATIONS //
up_lev = vpt - (st_mult * atr(st_period))
dn_lev = vpt + (st_mult * atr(st_period))

up_trend   = 0.0
up_trend   := close[1] > up_trend[1]   ? max(up_lev, up_trend[1])   : up_lev

down_trend = 0.0
down_trend := close[1] < down_trend[1] ? min(dn_lev, down_trend[1]) : dn_lev

// Calculate trend var
trend = 0
trend := close > down_trend[1] ? 1: close < up_trend[1] ? -1 : nz(trend[1], 1)

// Calculate SuperTrend Line
st_line = trend ==1 ? up_trend : down_trend

// Plotting
plot(st_line[1], color = trend == 1 ? color.green : color.red , style = plot.style_cross, linewidth = 2, title = "SuperTrend")
buy=crossover( close, st_line) and close>o
sell=crossunder(close, st_line) and close<o
//plotshape(crossover( close, st_line), location = location.belowbar, color = color.green,size=size.tiny)
//plotshape(crossunder(close, st_line), location = location.abovebar, color = color.red,size=size.tiny)
plotshape(buy, title="buy", color=color.green, style=shape.arrowup, location=location.belowbar, size=size.normal, textcolor=color.white, transp=0)  //plot for buy icon
plotshape(sell, title="sell", color=color.red, style=shape.arrowdown, location=location.abovebar, size=size.normal, textcolor=color.white, transp=0)  //plot for sell icon


//
multiplier = input(title="TP", type=input.float, defval=2, minval=1)
src5 = close
len5 = input(title="TP length", defval=150, minval=1)
offset = 0

calcSlope(src5, len5) =>
    sumX = 0.0
    sumY = 0.0
    sumXSqr = 0.0
    sumXY = 0.0
    for i = 1 to len5
        val = src5[len5-i]
        per = i + 1.0
        sumX := sumX + per
        sumY := sumY + val
        sumXSqr := sumXSqr + per * per
        sumXY := sumXY + val * per


    slope = (len5 * sumXY - sumX * sumY) / (len5 * sumXSqr - sumX * sumX)
    average = sumY / len5
    intercept = average - slope * sumX / len5 + slope
    [slope, average, intercept]

var float tmp = na
[s, a, i] = calcSlope(src5, len5)

vwap1=(i + s * (len5 - offset))
sdev = stdev(close, len5)
dev = multiplier * sdev
top=vwap1+dev
bott=vwap1-dev

//
z1 = vwap1 + dev
x1 = vwap1 - dev

low1 = crossover(close, x1)
high1 = crossunder(close, z1)

plotshape(low1, title="low", text="TP", color=color.red, style=shape.labelup, location=location.belowbar, size=size.small, textcolor=color.white, transp=0)  //plot for buy icon
plotshape(high1, title="high", text="TP", color=color.green, style=shape.labeldown, location=location.abovebar, size=size.small, textcolor=color.white, transp=0)  //plot for sell icon


strategy.entry(id="Enter Long MA", long=true, comment="Buy", when=high1)
strategy.entry(id="Short Entry MA", long=false, comment="Sell", when=low1)

/////// Alerts /////
alertcondition(buy,title="buy")
alertcondition(sell,title="sell")
alertcondition(low1,title="sell tp")
alertcondition(high1,title="buy tp")
Detail
https://www.fmz.com/strategy/435095
Last Modified
2023-12-12 11:44:15