
7.8 KiB
Name
月度回报双极化策略Bi-Polar-Monthly-Return-Strategy
Author
ChaoZhang
Strategy Description
[trans]
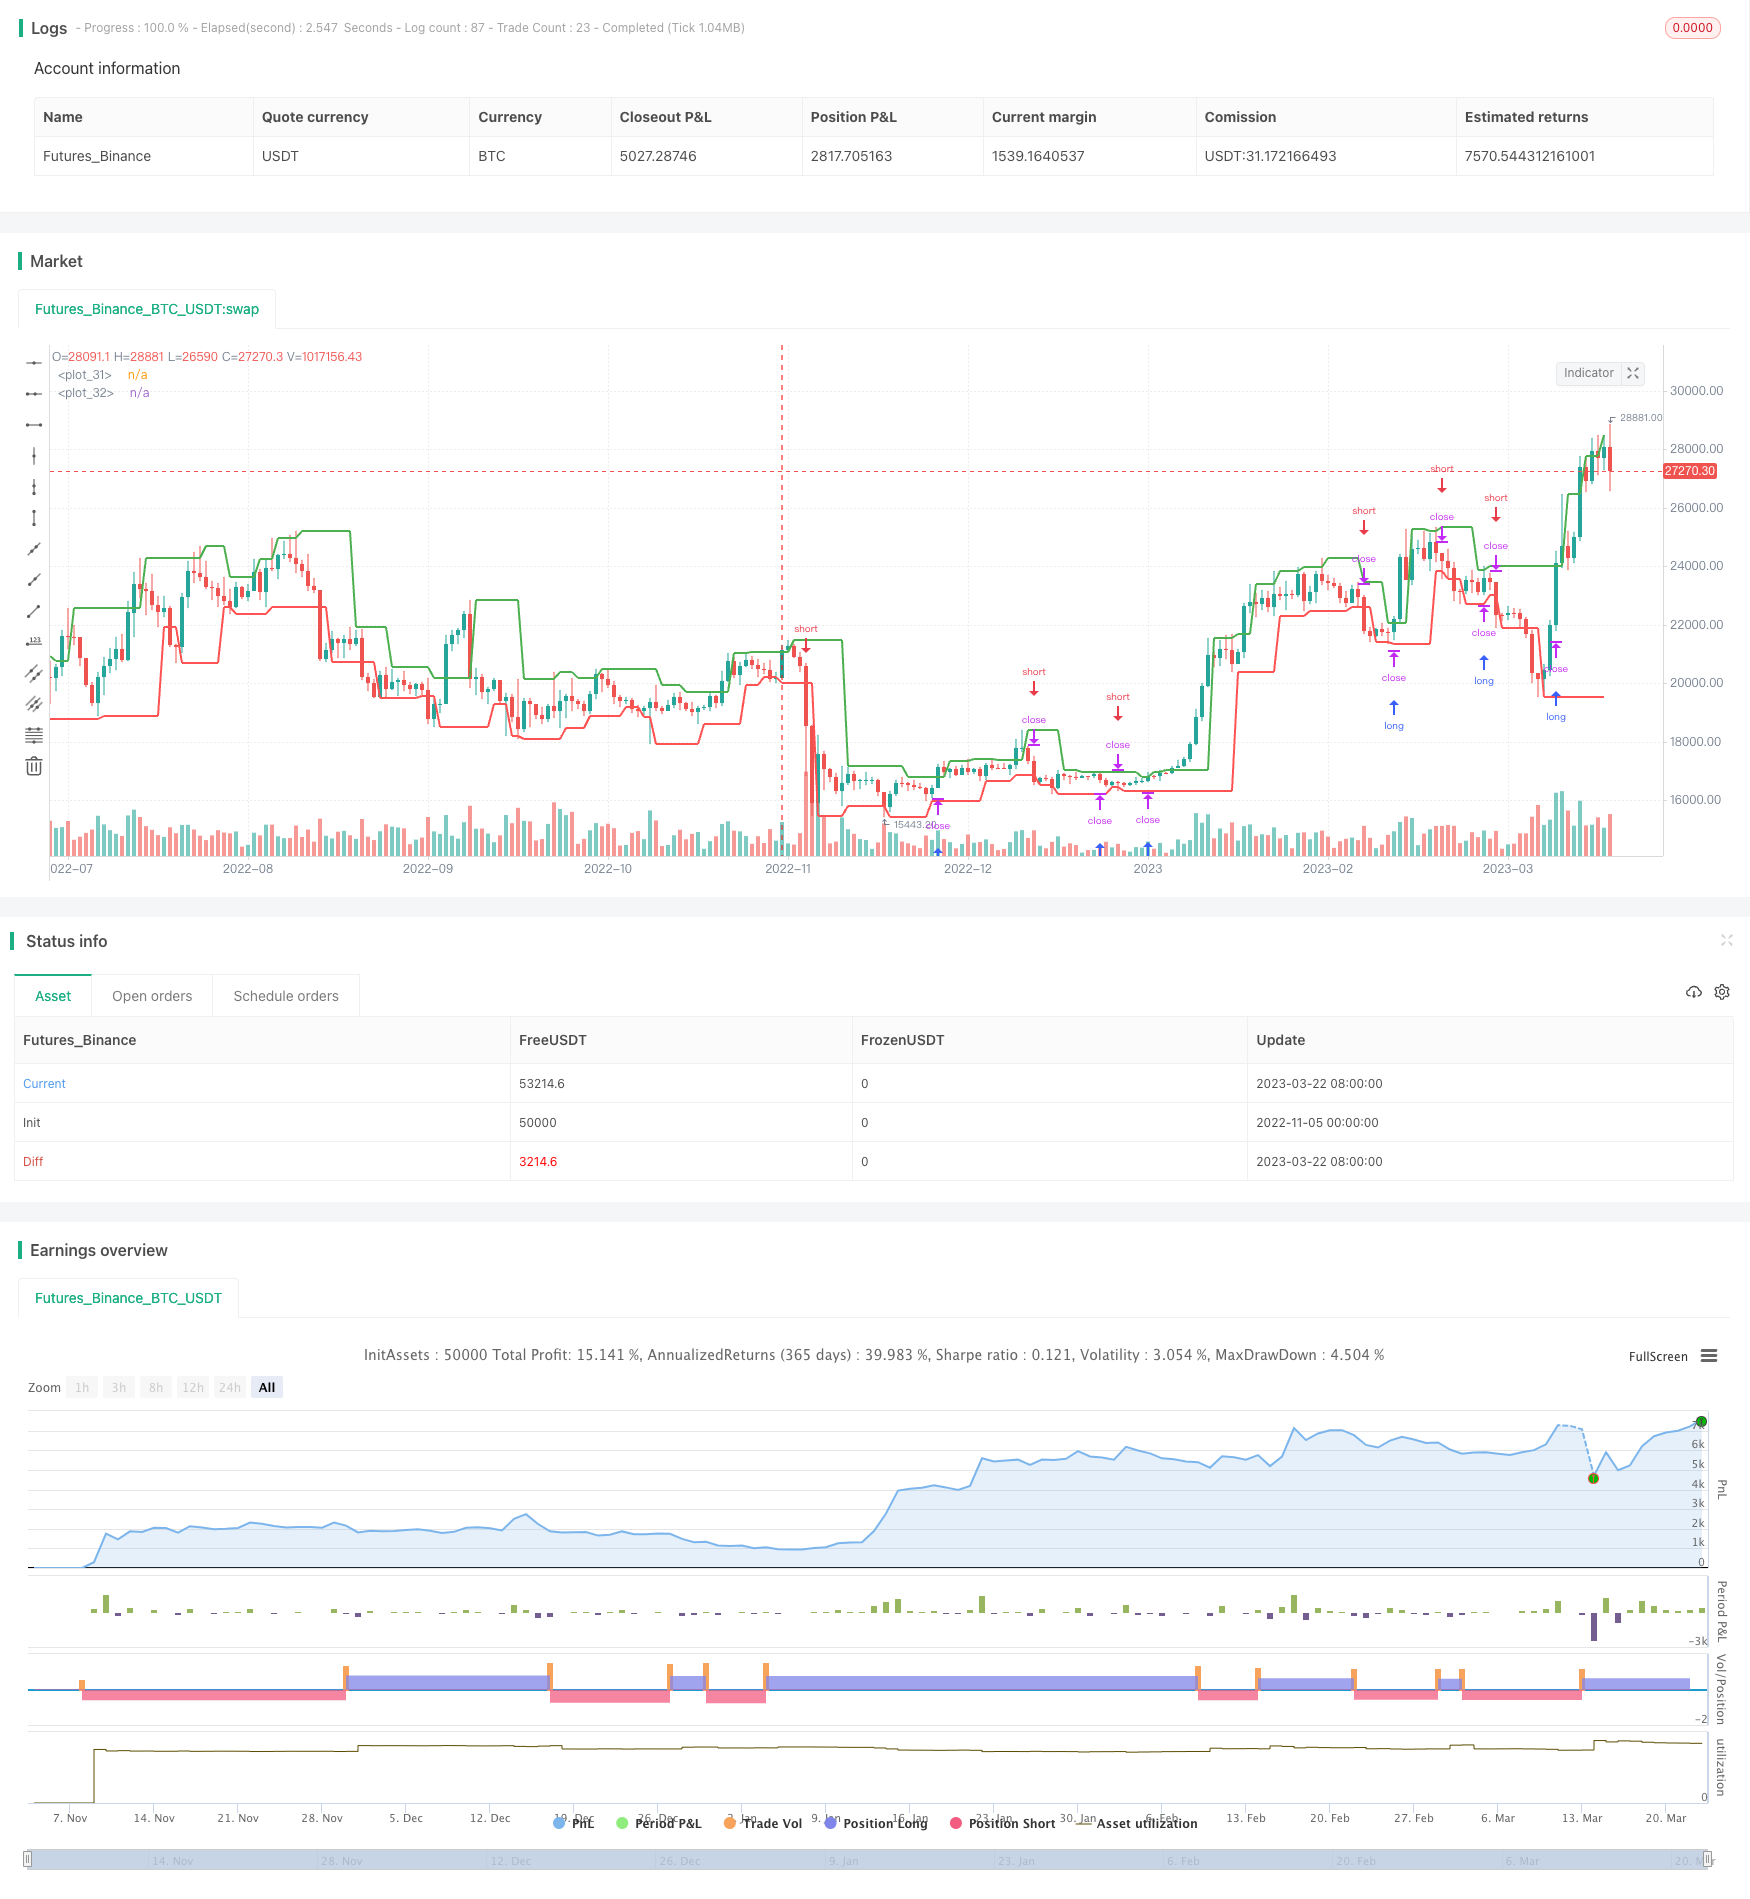
##概述 该策略利用K线的枢轴点来判断趋势反转,并以此为信号进行多空头交易。在盈利时,策略会锁定当月已实现收益,防止给回撤期带来较大亏损。
##策略原理
- 利用
pivothigh()和pivotlow()函数计算K线的枢轴点。枢轴点可以判断趋势反转。 - 当价格超过上枢轴点时,做多头仓位。当价格跌破下枢轴点时,做空头仓位。
- 每月初,计算上月收益率,保存到数组。
- 每年初,计算上年收益率,保存到数组。
- 绘制收益率表格,可以直观看到每个月和年的收益情况。
##优势分析
- 利用枢轴点判断趋势反转,可以过滤掉部分噪音交易信号。
- 每月锁定收益,可以减少亏损月的影响,双极化收益。
- 收益表格直观展示每个月收益情况,可以清晰看到策略好坏时期。
##风险分析
- 枢轴点发生变化时,可能会造成错误反向开仓。可以适当优化参数或增加过滤条件。
- 月初强制平仓会错过余下月份的盈利机会。可以考虑只锁定部分头寸。
- 表格无法展示最大回撤等风险指标。可以考虑增加其他衡量策略风险的指标。
##优化方向
- 可以在枢轴点附近增加过滤条件,避免频繁无效反转交易。
- 可以只锁定部分头寸,而不是全部平仓,减少遗漏机会的可能。
- 可以增加最大回撤、夏普比率等量化风险指标在表格中的展示。
##总结 该策略利用枢轴点判断趋势反转进行交易,并在月末锁定收益,可以有效控制回撤风险。但部分参数和策略逻辑仍可进一步优化,使交易信号更准确、风险控制更稳健。表格形式的直观展示每月收益情况,也有利于策略分析。总体来说,该策略具有一定参考价值,但实盘时还需谨慎评估。
||
##Overview This strategy uses pivot points to identify trend reversals and take long/short positions accordingly. It locks in monthly profits to prevent large drawdowns during losing periods.
##How It Works
- Uses
pivothigh()andpivotlow()to calculate pivot points, which indicate trend reversals. - Goes long when price breaks above pivot high. Goes short when price breaks below pivot low.
- Calculates monthly return at start of each month and saves to array.
- Calculates yearly return at start of each year and saves to array.
- Draws table of returns for intuitive view of monthly and yearly performance.
##Advantage Analysis
- Pivot points filter out some false reversal signals.
- Locking monthly profits reduces losing months' impact - bi-polar returns.
- Return table shows performance trends clearly.
##Risk Analysis
- Pivots may change, causing wrong reversal entries. Can optimize params or add filters.
- Forced monthly close misses further profits. Consider partial position closure.
- Table lacks max drawdown and risk metrics. Add more metrics.
##Optimization Directions
- Add filters near pivots to avoid frequent invalid reversals.
- Close partial instead of full position to reduce missed opportunities.
- Add quantitative risk metrics like max drawdown, Sharpe ratio.
##Summary This strategy trades reversals at pivot points and locks monthly profits to control drawdowns. But some parameters and logic can be improved for more accurate signals and robust risk management. The intuitive return table aids analysis. Overall, this strategy has merit but requires prudent evaluation for live trading. [/trans]
Strategy Arguments
| Argument | Default | Description |
|---|---|---|
| v_input_1 | 2 | leftBars |
| v_input_2 | true | rightBars |
| v_input_3 | 2 | Return Precision |
Source (PineScript)
/*backtest
start: 2022-11-05 00:00:00
end: 2023-03-23 05:20:00
period: 1d
basePeriod: 1h
exchanges: [{"eid":"Futures_Binance","currency":"BTC_USDT"}]
*/

//@version=4
strategy("Monthly Returns in PineScript Strategies", overlay = true, default_qty_type = strategy.percent_of_equity, default_qty_value = 25, calc_on_every_tick = true, commission_type = strategy.commission.percent, commission_value = 0.1)

// Inputs
leftBars  = input(2)
rightBars = input(1)
prec      = input(2, title = "Return Precision")

// Pivot Points
swh = pivothigh(leftBars, rightBars)
swl = pivotlow(leftBars, rightBars)

hprice = 0.0
hprice := not na(swh) ? swh : hprice[1]

lprice = 0.0
lprice := not na(swl) ? swl : lprice[1]

le = false
le := not na(swh) ? true : (le[1] and high > hprice ? false : le[1])

se = false
se := not na(swl) ? true : (se[1] and low < lprice ? false : se[1])

if (le)
	strategy.entry("PivRevLE", strategy.long, comment="PivRevLE", stop=hprice + syminfo.mintick)

if (se)
	strategy.entry("PivRevSE", strategy.short, comment="PivRevSE", stop=lprice - syminfo.mintick)

plot(hprice, color = color.green, linewidth = 2)
plot(lprice, color = color.red,   linewidth = 2)

///////////////////
// MONTHLY TABLE //

new_month = month(time) != month(time[1])
new_year  = year(time)  != year(time[1])

eq = strategy.equity

bar_pnl = eq / eq[1] - 1

cur_month_pnl = 0.0
cur_year_pnl  = 0.0

// Current Monthly P&L
cur_month_pnl := new_month ? 0.0 :
                 (1 + cur_month_pnl[1]) * (1 + bar_pnl) - 1

// Current Yearly P&L
cur_year_pnl := new_year ? 0.0 :
                 (1 + cur_year_pnl[1]) * (1 + bar_pnl) - 1

// Arrays to store Yearly and Monthly P&Ls
var month_pnl  = array.new_float(0)
var month_time = array.new_int(0)

var year_pnl  = array.new_float(0)
var year_time = array.new_int(0)

if (not na(cur_month_pnl[1]) and (new_month or barstate.islast))
    array.push(month_pnl , cur_month_pnl[1])
    array.push(month_time, time[1])

if (not na(cur_year_pnl[1]) and (new_year or barstate.islast))
    array.push(year_pnl , cur_year_pnl[1])
    array.push(year_time, time[1])

// Monthly P&L Table
var monthly_table = table(na)

if (barstate.islast)
    monthly_table := table.new(position.bottom_right, columns = 14, rows = array.size(year_pnl) + 1, border_width = 1)

    table.cell(monthly_table, 0,  0, "",     bgcolor = #cccccc)
    table.cell(monthly_table, 1,  0, "Jan",  bgcolor = #cccccc)
    table.cell(monthly_table, 2,  0, "Feb",  bgcolor = #cccccc)
    table.cell(monthly_table, 3,  0, "Mar",  bgcolor = #cccccc)
    table.cell(monthly_table, 4,  0, "Apr",  bgcolor = #cccccc)
    table.cell(monthly_table, 5,  0, "May",  bgcolor = #cccccc)
    table.cell(monthly_table, 6,  0, "Jun",  bgcolor = #cccccc)
    table.cell(monthly_table, 7,  0, "Jul",  bgcolor = #cccccc)
    table.cell(monthly_table, 8,  0, "Aug",  bgcolor = #cccccc)
    table.cell(monthly_table, 9,  0, "Sep",  bgcolor = #cccccc)
    table.cell(monthly_table, 10, 0, "Oct",  bgcolor = #cccccc)
    table.cell(monthly_table, 11, 0, "Nov",  bgcolor = #cccccc)
    table.cell(monthly_table, 12, 0, "Dec",  bgcolor = #cccccc)
    table.cell(monthly_table, 13, 0, "Year", bgcolor = #999999)


    for yi = 0 to array.size(year_pnl) - 1
        table.cell(monthly_table, 0,  yi + 1, tostring(year(array.get(year_time, yi))), bgcolor = #cccccc)

        y_color = array.get(year_pnl, yi) > 0 ? color.new(color.green, transp = 50) : color.new(color.red, transp = 50)
        table.cell(monthly_table, 13, yi + 1, tostring(round(array.get(year_pnl, yi) * 100, prec)), bgcolor = y_color)

    for mi = 0 to array.size(month_time) - 1
        m_row   = year(array.get(month_time, mi))  - year(array.get(year_time, 0)) + 1
        m_col   = month(array.get(month_time, mi))
        m_color = array.get(month_pnl, mi) > 0 ? color.new(color.green, transp = 70) : color.new(color.red, transp = 70)

        table.cell(monthly_table, m_col, m_row, tostring(round(array.get(month_pnl, mi) * 100, prec)), bgcolor = m_color)
Detail
https://www.fmz.com/strategy/431273
Last Modified
2023-11-06 16:06:55