
9.3 KiB
Name
指标积分策略Momentum-Integral-Indicator-Strategy
Author
ChaoZhang
Strategy Description
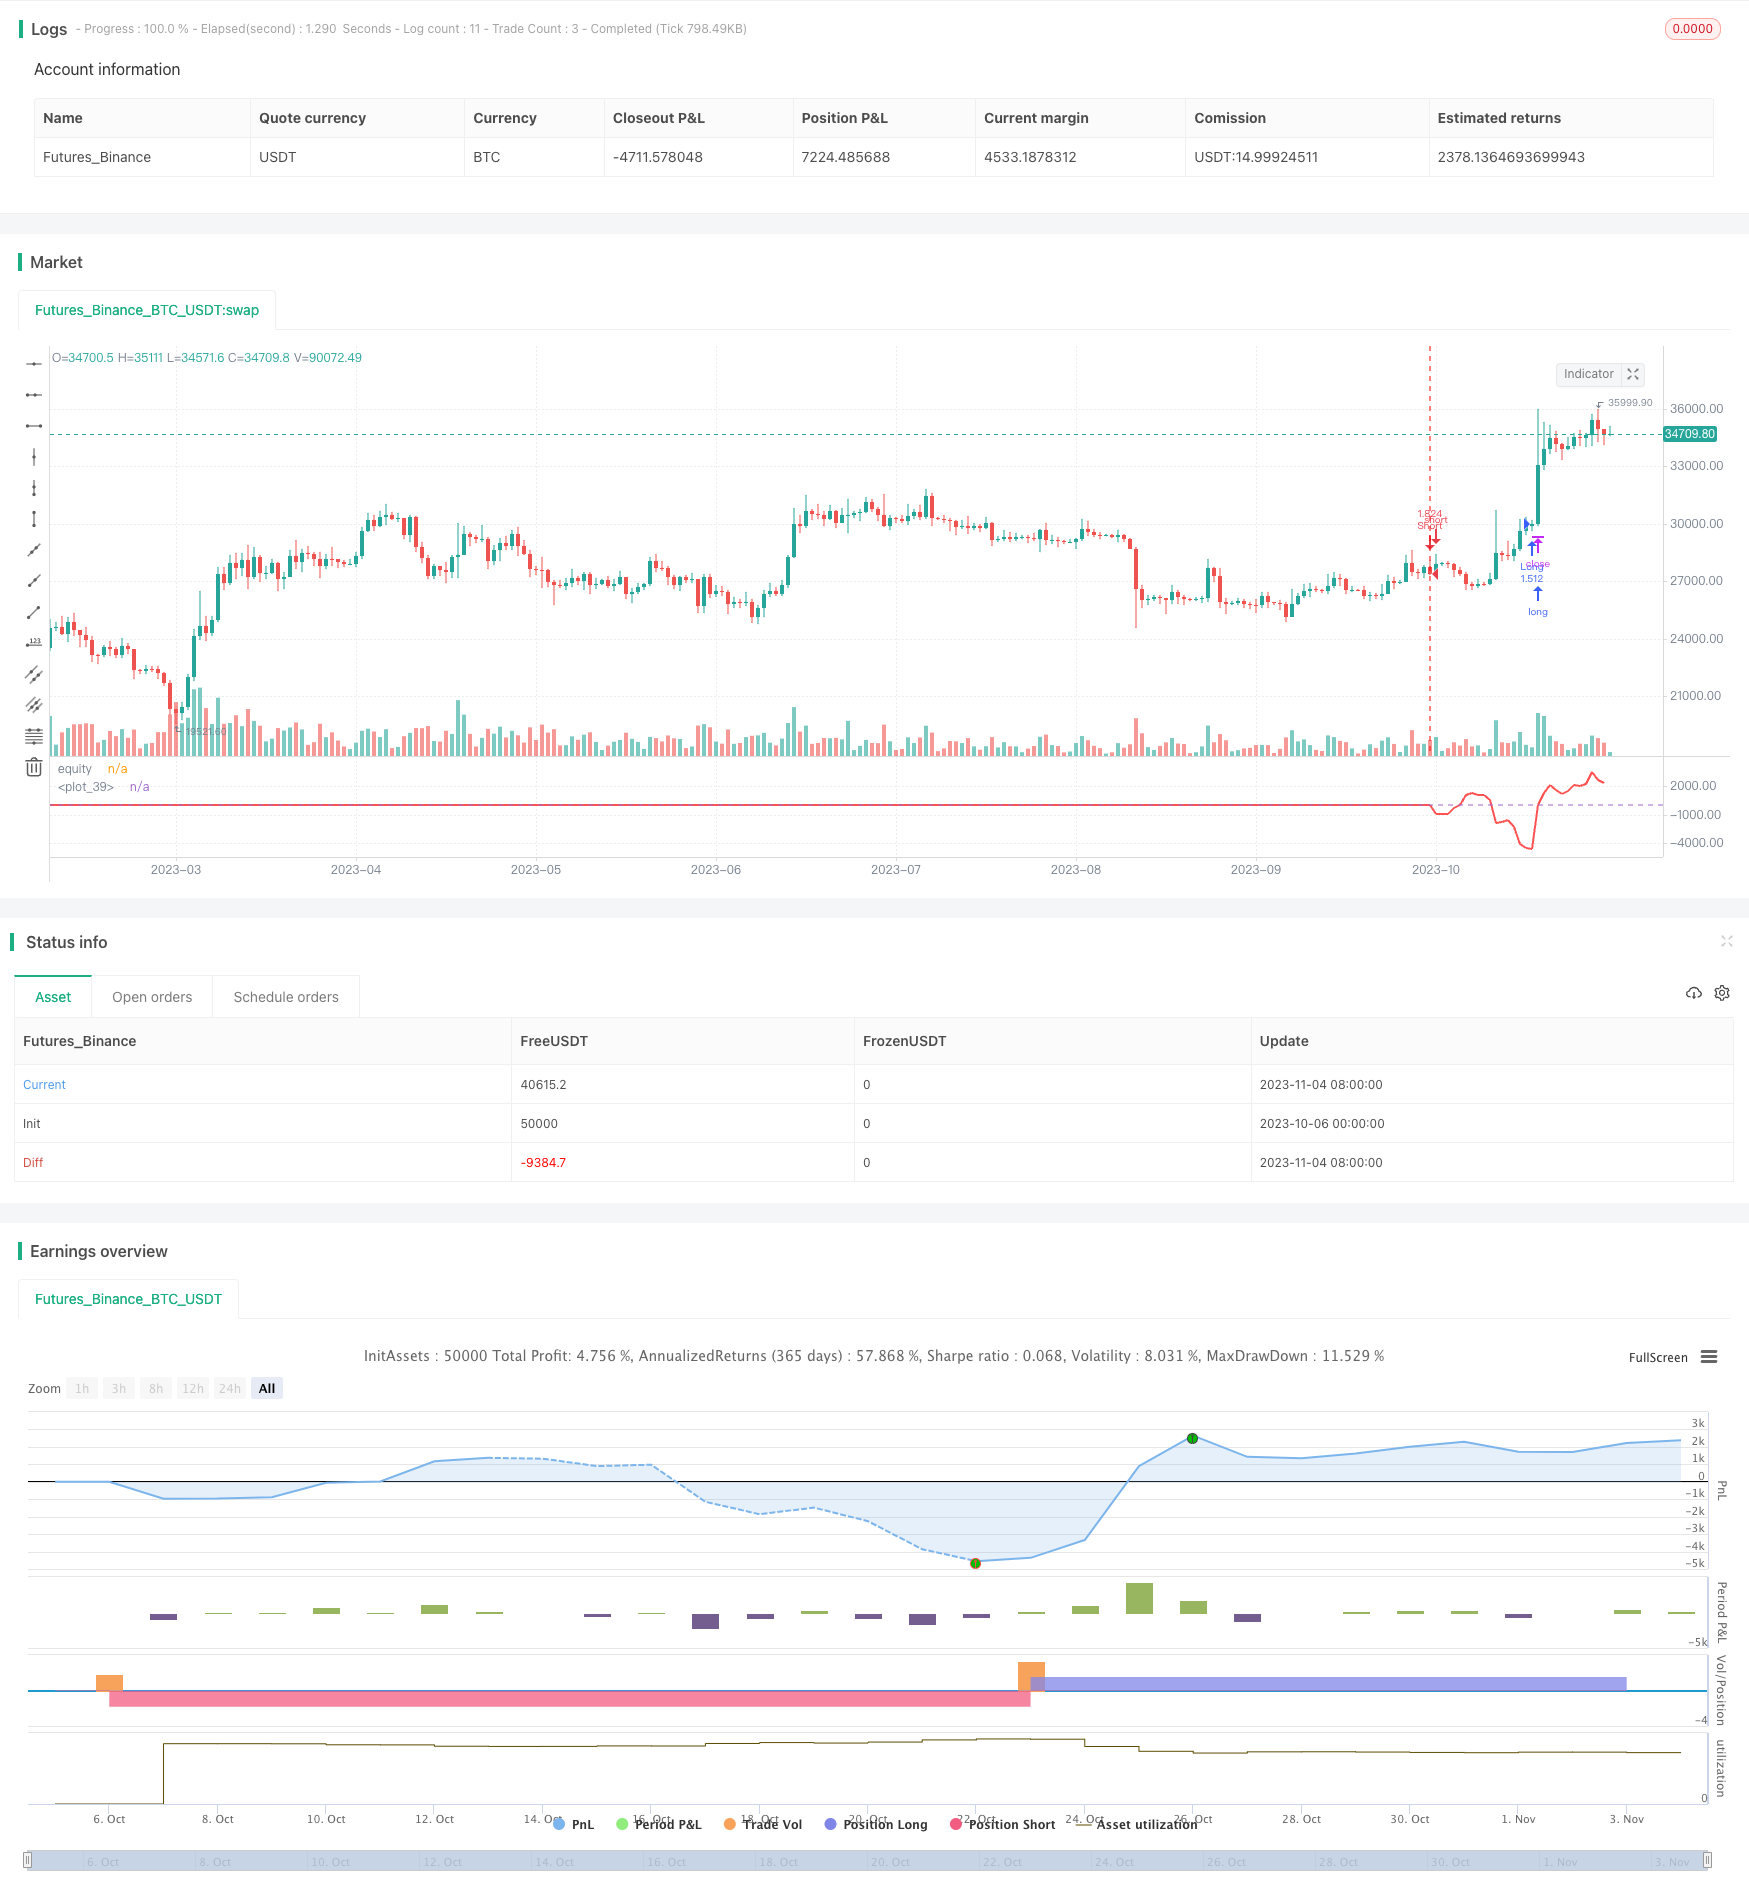
[trans]
概述
该策略通过计算ROC和SMA这两个指标的差值k,再对k进行一定长度的求和,根据求和值sum的正负作为做多做空的判断依据。该策略属于短线交易策略。
策略原理
该策略首先计算长度为l的SMA均线和ROC指标,然后计算当前收盘价与SMA的差值k。接着计算k的s日累加和sum。当sum>0时做多,当sum<0时做空。
具体来说,代码中:
-
计算长度为l的SMA均线a
-
计算长度为l的ROC指标r
-
计算当前收盘价与SMA均线的差值k = close - a
-
对k进行s日累加求和,得到sum
-
如果sum>0,则做多;如果sum<0,则做空
-
平仓条件:做多平仓时sum<0;做空平仓时sum>0
该策略的关键是计算k的累加和sum,通过sum的正负作为交易信号。当最近一段时间k>0,说明价格在上涨,这时做多;当最近一段时间k<0,说明价格在下跌,这时做空。
优势分析
这是一个较为简单实用的短线交易策略,具有以下优势:
-
使用的指标组合较为简单,容易理解和实现。
-
通过指标的差值进行滤波,可以发现更精确的交易机会。
-
对差值进行累加求和,可以更准确抓取短线趋势。
-
可根据市场调整参数l和s,适应不同周期。
-
策略思路清晰,程序简洁,容易修改和优化。
-
资金使用效率高,可实现频繁短线交易。
风险分析
该策略也存在一定的风险,主要包括:
-
短线交易风险较大,存在亏损的可能。
-
参数设置不当可能导致过于频繁交易或漏失机会。
-
无法有效应对趋势反转,跳过止损可能造成较大亏损。
-
需要频繁监控和调整参数,较为依赖交易者经验。
-
交易频繁容易增加交易成本和滑点,影响盈利。
对应风险的解决方法包括:
-
适当调整参数,降低交易频率。
-
结合趋势指标,识别趋势反转。
-
优化止损策略,控制单笔亏损。
-
加入自动化参数优化模块,降低依赖交易者经验。
-
优化下单模块,降低交易成本。
优化方向
该策略可以从以下几个方面进行进一步优化:
-
优化参数计算方法,使参数更具自适应性。可以考虑使用遗传算法、马尔科夫链等方法动态优化参数。
-
结合更多指标和过滤条件,提高交易信号的质量。例如结合趋势指标避免逆势交易等。
-
改进止损策略,例如引入移动止损、平均止损等,控制单笔亏损。
-
优化资金管理策略,例如风险点数管理、固定比例划分资金等,控制整体风险。
-
优化下单模块,使用趋势追踪、滑点控制等算法,降低交易成本。
-
增加自动化回测优化模块,快速评估不同参数对策略的影响。
-
增加量化指标评估模块,评估交易信号质量,提高策略稳定性。
通过以上优化,可以将该策略打造成一个更全面、智能、稳定、可控的短线交易体系。
总结
总体来说,该策略通过简单的指标计算产生交易信号,思路清晰易于实现,属于典型的短线交易策略。通过对参数、止损、资金管理等方面的进一步优化,可以降低风险、提高稳定性,使其成为值得运用的量化交易策略之一。但任何策略都无法完美,交易者还需要保持理性,并适当结合自己的风险偏好进行调整运用。
||
Overview
This strategy generates trading signals by calculating the sum of differences between ROC and SMA. It belongs to short-term trading strategies.
Strategy Logic
The strategy first calculates SMA with length l and ROC. Then it calculates the difference k between close price and SMA. Next it sums up k for s days and gets sum. When sum>0, it goes long. When sum<0, it goes short.
Specifically, in the code:
-
Calculate SMA with length l, get a.
-
Calculate ROC with length l, get r.
-
Calculate difference between close price and SMA: k = close - a.
-
Sum up k for s days, get sum.
-
If sum>0, long position; if sum<0, short position.
-
Exit when sum<0 for long, and sum>0 for short.
The key is to sum up the difference k and use the sign of sum for trading signals. When k>0 for recent days, price is increasing, so go long. When k<0, price is decreasing, so go short.
Advantage Analysis
This simple short-term trading strategy has the following advantages:
-
The indicators used are simple and easy to understand.
-
Filtering by the difference of indicators can find more accurate trading opportunities.
-
Summing up the difference can better capture short-term trends.
-
The parameters l and s can be adjusted for different cycle.
-
The logic is clear and easy to modify and optimize.
-
High capital utilization efficiency for frequent short-term trading.
Risk Analysis
There are also some risks:
-
Higher risks in short-term trading, losses are possible.
-
Improper parameters may lead to over-trading or missing opportunities.
-
Hard to adapt to trend reversal, no stop loss may lead to big losses.
-
Frequent adjustment of parameters relies heavily on trader's experience.
-
High trading frequency may increase transaction costs and slippage.
Solutions:
-
Adjust parameters properly to lower trading frequency.
-
Add trend indicators to identify reversals.
-
Optimize stop loss to control single trade loss.
-
Add auto parameter optimization to lower dependence on experience.
-
Optimize order execution model to lower transaction costs.
Optimization Directions
The strategy can be further optimized in the following aspects:
-
Optimize parameter calculation methods, like genetic algorithms, to make parameters adaptive.
-
Add more indicators and filters to improve signal quality.
-
Improve stop loss strategy, like trailing stop loss.
-
Optimize money management strategies like risk point control.
-
Optimize order execution model with trend following, slippage control etc.
-
Add backtesting and auto optimization modules.
-
Add quantitative evaluation of signal quality.
With these optimizations, this strategy can become a more comprehensive, intelligent, stable and controllable short-term trading system.
Summary
In summary, this strategy generates simple signals from indicators, with clear logic and easy implementation. With further optimizations in parameters, stop loss, money management etc., it can become a worthwhile quantitative trading strategy. But no strategy is perfect. Traders still need to apply it rationally based on personal risk preference.
[/trans]
Strategy Arguments
| Argument | Default | Description |
|---|---|---|
| v_input_1 | 170 | Length for indicator |
| v_input_2 | 18 | Length of summation |
| v_input_3 | false | Take Profit |
| v_input_4 | false | Stop Loss |
| v_input_5 | false | Trailing Stop Loss |
| v_input_6 | false | Trailing Stop Loss Offset |
Source (PineScript)
/*backtest
start: 2023-10-06 00:00:00
end: 2023-11-05 00:00:00
period: 1d
basePeriod: 1h
exchanges: [{"eid":"Futures_Binance","currency":"BTC_USDT"}]
*/

//@version=2
strategy("Indicator Integrator Strat",default_qty_type = strategy.percent_of_equity, default_qty_value = 100,currency="USD",initial_capital=662, overlay=false)

l = input(defval=170,title="Length for indicator")
s = input(title="Length of summation",defval=18)
a= sma(close,l)
r=roc(close,l)
k=close-a
sum = 0
for i = 0 to s
    sum := sum + k[i]
//plot(a,color=yellow,linewidth=2,transp=0)
//bc =  iff( sum > 0, white, teal)
//plot(sum,color=bc, transp=20, linewidth=3,style=columns)
//plot(sma(sum,3),color=white)
//hline(0)

inpTakeProfit = input(defval = 0, title = "Take Profit", minval = 0)
inpStopLoss = input(defval = 0, title = "Stop Loss", minval = 0)
inpTrailStop = input(defval = 0, title = "Trailing Stop Loss", minval = 0)
inpTrailOffset = input(defval = 0, title = "Trailing Stop Loss Offset", minval = 0)
useTakeProfit = inpTakeProfit >= 1 ? inpTakeProfit : na
useStopLoss = inpStopLoss >= 1 ? inpStopLoss : na
useTrailStop = inpTrailStop >= 1 ? inpTrailStop : na
useTrailOffset = inpTrailOffset >= 1 ? inpTrailOffset : na

////buyEntry = crossover(source, lower)
////sellEntry = crossunder(source, upper)
if sum>0
    strategy.entry("Long", strategy.long, oca_name="Long",  comment="Long")
else
    strategy.cancel(id="Long")
if sum<0
    strategy.entry("Short", strategy.short, oca_name="Short", comment="Short")
else
    strategy.cancel(id="Short")
strategy.initial_capital = 50000
plot(strategy.equity-strategy.initial_capital-strategy.closedtrades*.25/2, title="equity", color=red, linewidth=2)
hline(0)
//longCondition = sum>0
//exitlong = sum<0

//shortCondition = sum<0
//exitshort = sum>0

//strategy.entry(id = "Long", long=true, when = longCondition)
//strategy.close(id = "Long", when = exitlong)
//strategy.exit("Exit Long", from_entry = "Long", profit = useTakeProfit, loss = useStopLoss, trail_points = useTrailStop, trail_offset = useTrailOffset, when=exitlong)

//strategy.entry(id = "Short", long=false, when = shortCondition)
//strategy.close(id = "Short", when = exitshort)
//strategy.exit("Exit Short", from_entry = "Short", profit = useTakeProfit, loss = useStopLoss, trail_points = useTrailStop, trail_offset = useTrailOffset, when=exitshort)
Detail
https://www.fmz.com/strategy/431249
Last Modified
2023-11-06 14:40:26