
11 KiB
Name
平滑均线拟合策略Bollinger-Band-Fitting-Strategy
Author
ChaoZhang
Strategy Description
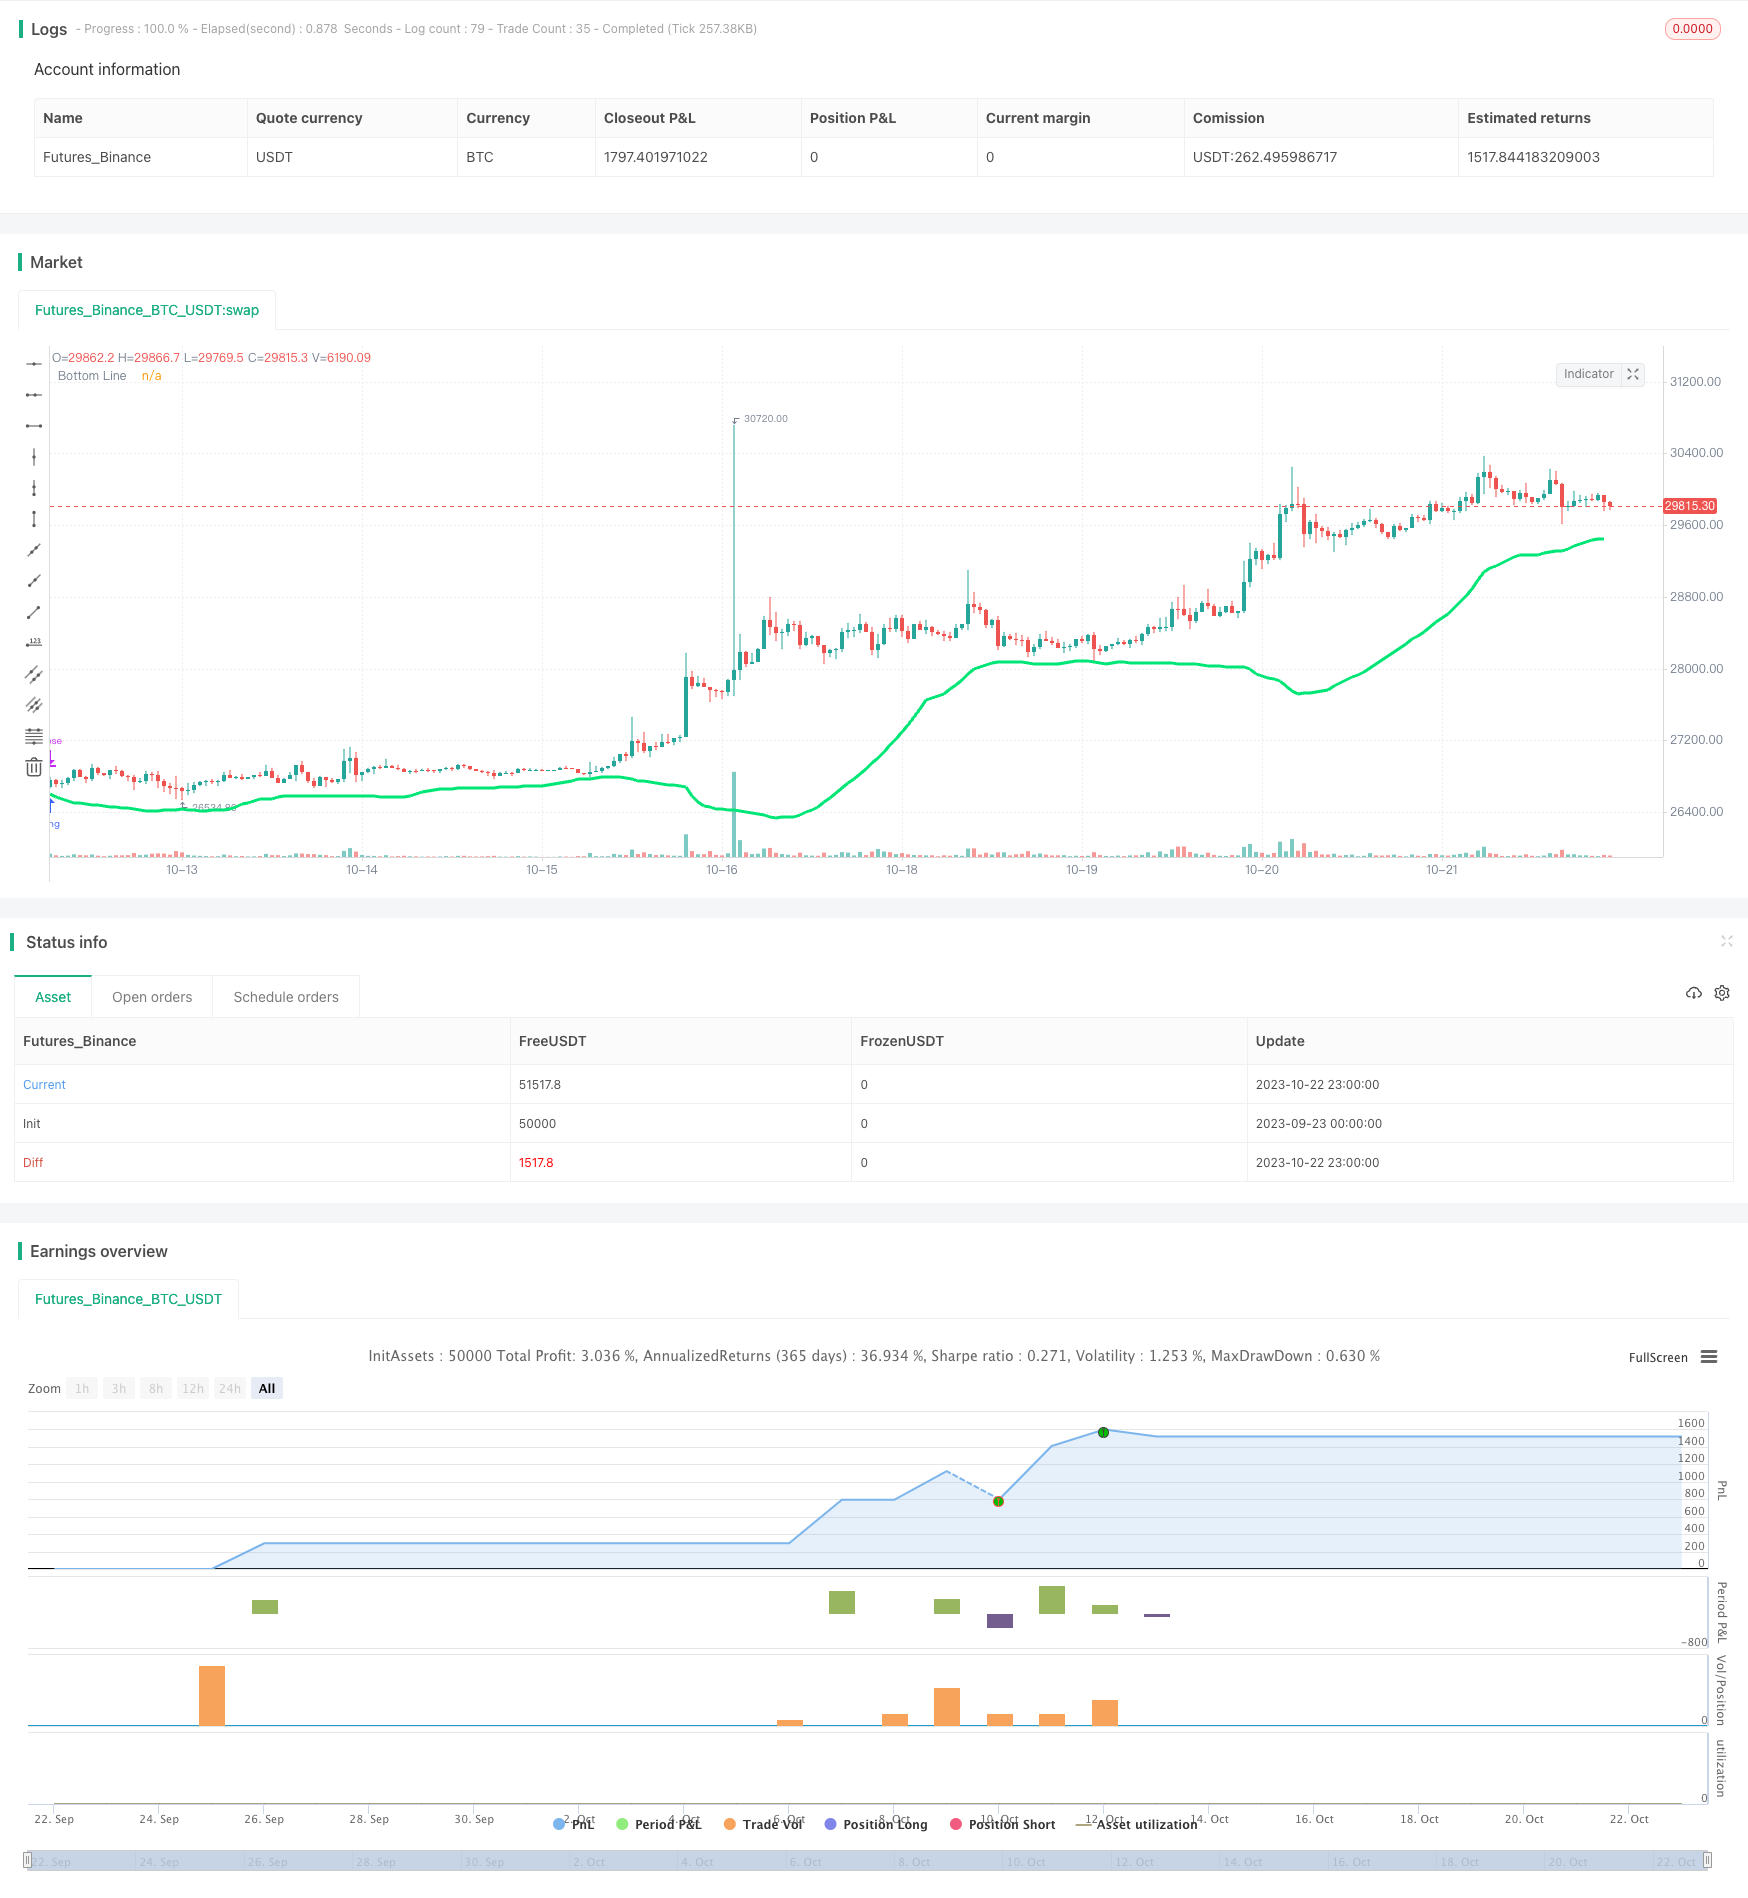
[trans]
概述
该策略利用布林带指标进行趋势判断,并结合RSI指标避免过度买入,以及蜡烛实体过滤和颜色过滤来进一步验证交易信号。总体来说,该策略的主要思想是在趋势开始阶段买入,并在趋势反转前退出,以获利收场。
原理
该策略首先利用布林带指标中的下轨线,当价格低于下轨时视为仪态头寸的机会。为避免过度买入,策略还引入RSI指标,要求RSI小于30才产生买入信号。此外,策略还设置蜡烛实体过滤,要求当前K线的实体大于过去10根K线平均实体的一半才会触发买入。最后,颜色过滤要求蜡烛为绿色(收阳),以进一步验证买入时机。
当价格上穿布林带下轨、RSI小于30、实体充分、为绿色K线时产生买入信号。而当价格收盘高于开盘、实体大于平均实体的一半时,为趋势反转信号,此时平仓止盈。
优势分析
该策略最大的优势在于能够成功判断趋势开始的时机进入场内,并在趋势反转前退出,从而获利潜力较大。具体来说,主要优势有:
-
布林带指标判断趋势方向准确。布林带通过拟合价格波动范围来判断价格走势,使用该指标能够有效判定趋势开始和结束。
-
RSI指标避免过度买入。RSI可以衡量超买超卖情况,结合RSI可以避免在价格短期调整时错买进场。
-
实体过滤增加信号的可靠性。较大的蜡烛实体代表着更强劲的突破,实体过滤可以确保买入强劲的突破。
-
颜色过滤确认买入时机。只在K线为绿色时买入,可以再次验证买入时机的正确性。
-
买入后通过蜡烛转绿判断趋势反转。交易者常说“趋势是轮流的”,通过蜡烛转绿可以及时判断到趋势反转的时机。
风险分析
该策略也存在一些风险需要注意:
-
布林带指标发出错误信号的可能。当市场震荡时,布林带也可能产生错误的突破信号。
-
未考虑止损导致亏损扩大。该策略未设置止损,如果判断错误可能导致较大亏损。
-
过滤条件过于严格错过买入时机。多个过滤条件叠加使用时,可能会错过买入机会。
-
依赖参数优化和回测效果。参数和过滤条件的设置需要优化和验证,实盘效果也需要验证。
-
蜡烛转绿判定趋势反转不稳定。K线转绿并不能完全确定趋势反转。
对应策略的风险,可以设置止损来控制损失;优化过滤条件,降低错过买入的概率;采用多种指标验证买入时机,提高成功率。此外,也需要在实盘中验证回测结果。
优化方向
该策略可以从以下几个方面进行优化:
-
优化布林带的参数,寻找最佳的参数组合。可以测试不同的周期长度、标准差倍数等。
-
测试不同的超买超卖指标替代RSI。例如KDJ、威廉指标等。
-
添加移动止损来控制风险。根据回测数据设定合理的移动止损策略。
-
优化过滤条件参数。测试不同大小的蜡烛实体过滤和周期参数。
-
尝试结合其它指标验证信号。例如量价 Confirmation等指标。
-
测试不同的反转信号判定。例如均线交叉等信号来判断趋势反转。
-
对交易品种、时间段进行测试。评估策略在不同市场中的效果。
总结
该策略整体来说具有较强的趋势跟踪能力和适应性。核心优势在于利用布林带判断趋势方向以及 RSI 和过滤条件确保买入时机。但是也存在一定的风险,需要针对性地进行优化测试。若能够验证参数和规则,有望获取较好的实盘效果。总体来说,该策略具有一定的实用价值。
||
Overview
This strategy uses the Bollinger Bands indicator for trend judgment, combined with the RSI indicator to avoid overbuying, as well as candle body filters and color filters to further validate trading signals. Overall, the main idea of this strategy is to buy at the beginning of a trend and exit before the trend reversal, in order to profit.
Principles
This strategy first uses the lower band of the Bollinger Bands indicator. When the price is below the lower band, it is considered an opportunity to open a position. To avoid overbuying, the strategy also introduces the RSI indicator, which requires the RSI to be less than 30 to generate a buy signal. In addition, the strategy sets a candle body filter that requires the body of the current candlestick to be greater than half the average body of the candlesticks over the past 10 periods in order to trigger a buy. Finally, the color filter requires the candle to be green (closing higher) to further validate the timing of the buy.
When the price breaks through the lower band of the Bollinger Bands, the RSI is less than 30, the body is sufficiently large, and the candle is green, a buy signal is generated. When the closing price is higher than the opening price and the body is greater than half of the average body, it is a trend reversal signal indicating closing the position.
Advantage Analysis
The biggest advantage of this strategy is that it can successfully determine the beginning of a trend and enter the market, and exit before the trend reversal, thus profit potential is large. Specifically, the main advantages are:
-
The Bollinger Bands indicator accurately judges trend direction. It uses the price fluctuation range to determine price movements, so using this indicator can effectively determine the start and end of trends.
-
The RSI indicator avoids overbuying. RSI can measure overbought and oversold conditions. Using it avoids wrongly buying during temporary price corrections.
-
Entity filtering increases signal reliability. A larger candle body represents a more powerful breakthrough. Entity filtering ensures buying strong breakthroughs.
-
Color filtering confirms timing. Only buying on green candles further validates proper timing.
-
Candle turning green indicates trend reversal after buying. Traders say "trends take turns", and candle turning green can judge reversal timing.
Risk Analysis
The strategy also has some risks to note:
-
Possibility of false signals from Bollinger Bands. It may also produce false breakout signals when the market oscillates.
-
Losses enlarge without stop loss. The lack of stop loss can lead to larger losses if judgements are wrong.
-
Filtering conditions too strict miss buying opportunities. Multiple stacked filters may miss opportunities.
-
Relies on optimized backtesting results. Parameter and filter settings need optimization and verification, real trading results also need verification.
-
Candle turning green unreliable for determining reversals. It doesn't fully confirm trend reversal.
For the risks, stop loss can control losses, optimizing filters reduces missed buys, using multiple indicators verifies signals, and verifying results in live trading.
Improvement Directions
The strategy can be optimized in several aspects:
-
Optimize Bollinger Band parameters for best settings. Test different periods, standard deviation multiples, etc.
-
Test different oscillators instead of RSI. e.g. KDJ, Williams %R, etc.
-
Add trailing stop loss to control risks. Set reasonable stops based on backtest data.
-
Optimize filter condition parameters. Test different body filter sizes and periods.
-
Incorporate other indicators to confirm signals. e.g. volume-price confirmation indicators.
-
Test different reversal signals. e.g. moving average crosses to determine trend reversal.
-
Test on different products and time frames. Evaluate strategy across different markets.
Conclusion
Overall, the strategy has relatively strong trend following ability and adaptiveness. The core strengths are using Bollinger Bands to determine trend direction and using RSI and filters to ensure timing. But there are also certain risks that need targeted optimization and testing. If parameters and rules can be verified, it may achieve good results in live trading. In conclusion, the strategy has practical value worth exploring.
[/trans]
Strategy Arguments
| Argument | Default | Description |
|---|---|---|
| v_input_1 | 100 | Capital, % |
| v_input_2 | 40 | BB Period |
| v_input_3 | false | Use Body-Filter |
| v_input_4 | false | Use Color-Filter |
| v_input_5 | true | Use RSI-Filter |
| v_input_6 | false | Show Arrows |
| v_input_7 | 1900 | From Year |
| v_input_8 | 2100 | To Year |
| v_input_9 | true | From Month |
| v_input_10 | 12 | To Month |
| v_input_11 | true | From day |
| v_input_12 | 31 | To day |
Source (PineScript)
/*backtest
start: 2023-09-23 00:00:00
end: 2023-10-23 00:00:00
period: 1h
basePeriod: 15m
exchanges: [{"eid":"Futures_Binance","currency":"BTC_USDT"}]
*/

//Noro
//2018

//Donate: 3BMEXvKkuJLobJrcpMm12bKTZoCnojZTjh

//@version=2
strategy(title = "Noro's Wizard Strategy v1.1", shorttitle = "Wizard str 1.1", overlay = true, default_qty_type = strategy.percent_of_equity, default_qty_value = 100, pyramiding = 10)

//Settings
capital = input(100, defval = 100, minval = 1, maxval = 10000, title = "Capital, %")
length = input(40, defval = 40, minval = 1, maxval = 200, title = "BB Period")
usebod = input(false, defval = false, title = "Use Body-Filter")
usecol = input(false, defval = false, title = "Use Color-Filter")
usersi = input(true, defval = true, title = "Use RSI-Filter")
showar = input(false, defval = false, title = "Show Arrows")
fromyear = input(1900, defval = 1900, minval = 1900, maxval = 2100, title = "From Year")
toyear = input(2100, defval = 2100, minval = 1900, maxval = 2100, title = "To Year")
frommonth = input(01, defval = 01, minval = 01, maxval = 12, title = "From Month")
tomonth = input(12, defval = 12, minval = 01, maxval = 12, title = "To Month")
fromday = input(01, defval = 01, minval = 01, maxval = 31, title = "From day")
today = input(31, defval = 31, minval = 01, maxval = 31, title = "To day")

//Bollinger
src = low
mult = 2
basis = sma(src, length)
dev = mult * stdev(src, length)
lower = basis - dev
plot(lower, color = lime, linewidth = 3, title="Bottom Line")

//Fast RSI Filter
fastup = rma(max(change(close), 0), 7)
fastdown = rma(-min(change(close), 0), 7)
rsi = fastdown == 0 ? 100 : fastup == 0 ? 0 : 100 - (100 / (1 + fastup / fastdown))
rsif = rsi < 30 or usersi == false

//Body Filter
nbody = abs(close - open)
abody = sma(nbody, 10)
body = nbody > abody / 2 or usebod == false

//Signals
up1 = low < lower and (close < open or usecol == false) and body and rsif
exit = close > open and nbody > abody / 2

//Arrows
needar = up1 and showar
plotarrow(needar ? 1 : na)

//Trading
lot = strategy.position_size == 0 ? strategy.equity / close * capital / 100 : lot[1]

if up1
    if strategy.position_size < 0
        strategy.close_all()

    strategy.entry("Long", strategy.long, lot, when=(time > timestamp(fromyear, frommonth, fromday, 00, 00) and time < timestamp(toyear, tomonth, today, 23, 59)))

if time > timestamp(toyear, tomonth, today, 23, 59) or exit
    strategy.close_all()
Detail
https://www.fmz.com/strategy/430066
Last Modified
2023-10-24 16:52:52