
9.8 KiB
Name
布林波段双均线追踪网格策略Bollinger-Fibonacci-Grid-Tracking-Trend-Strategy
Author
ChaoZhang
Strategy Description
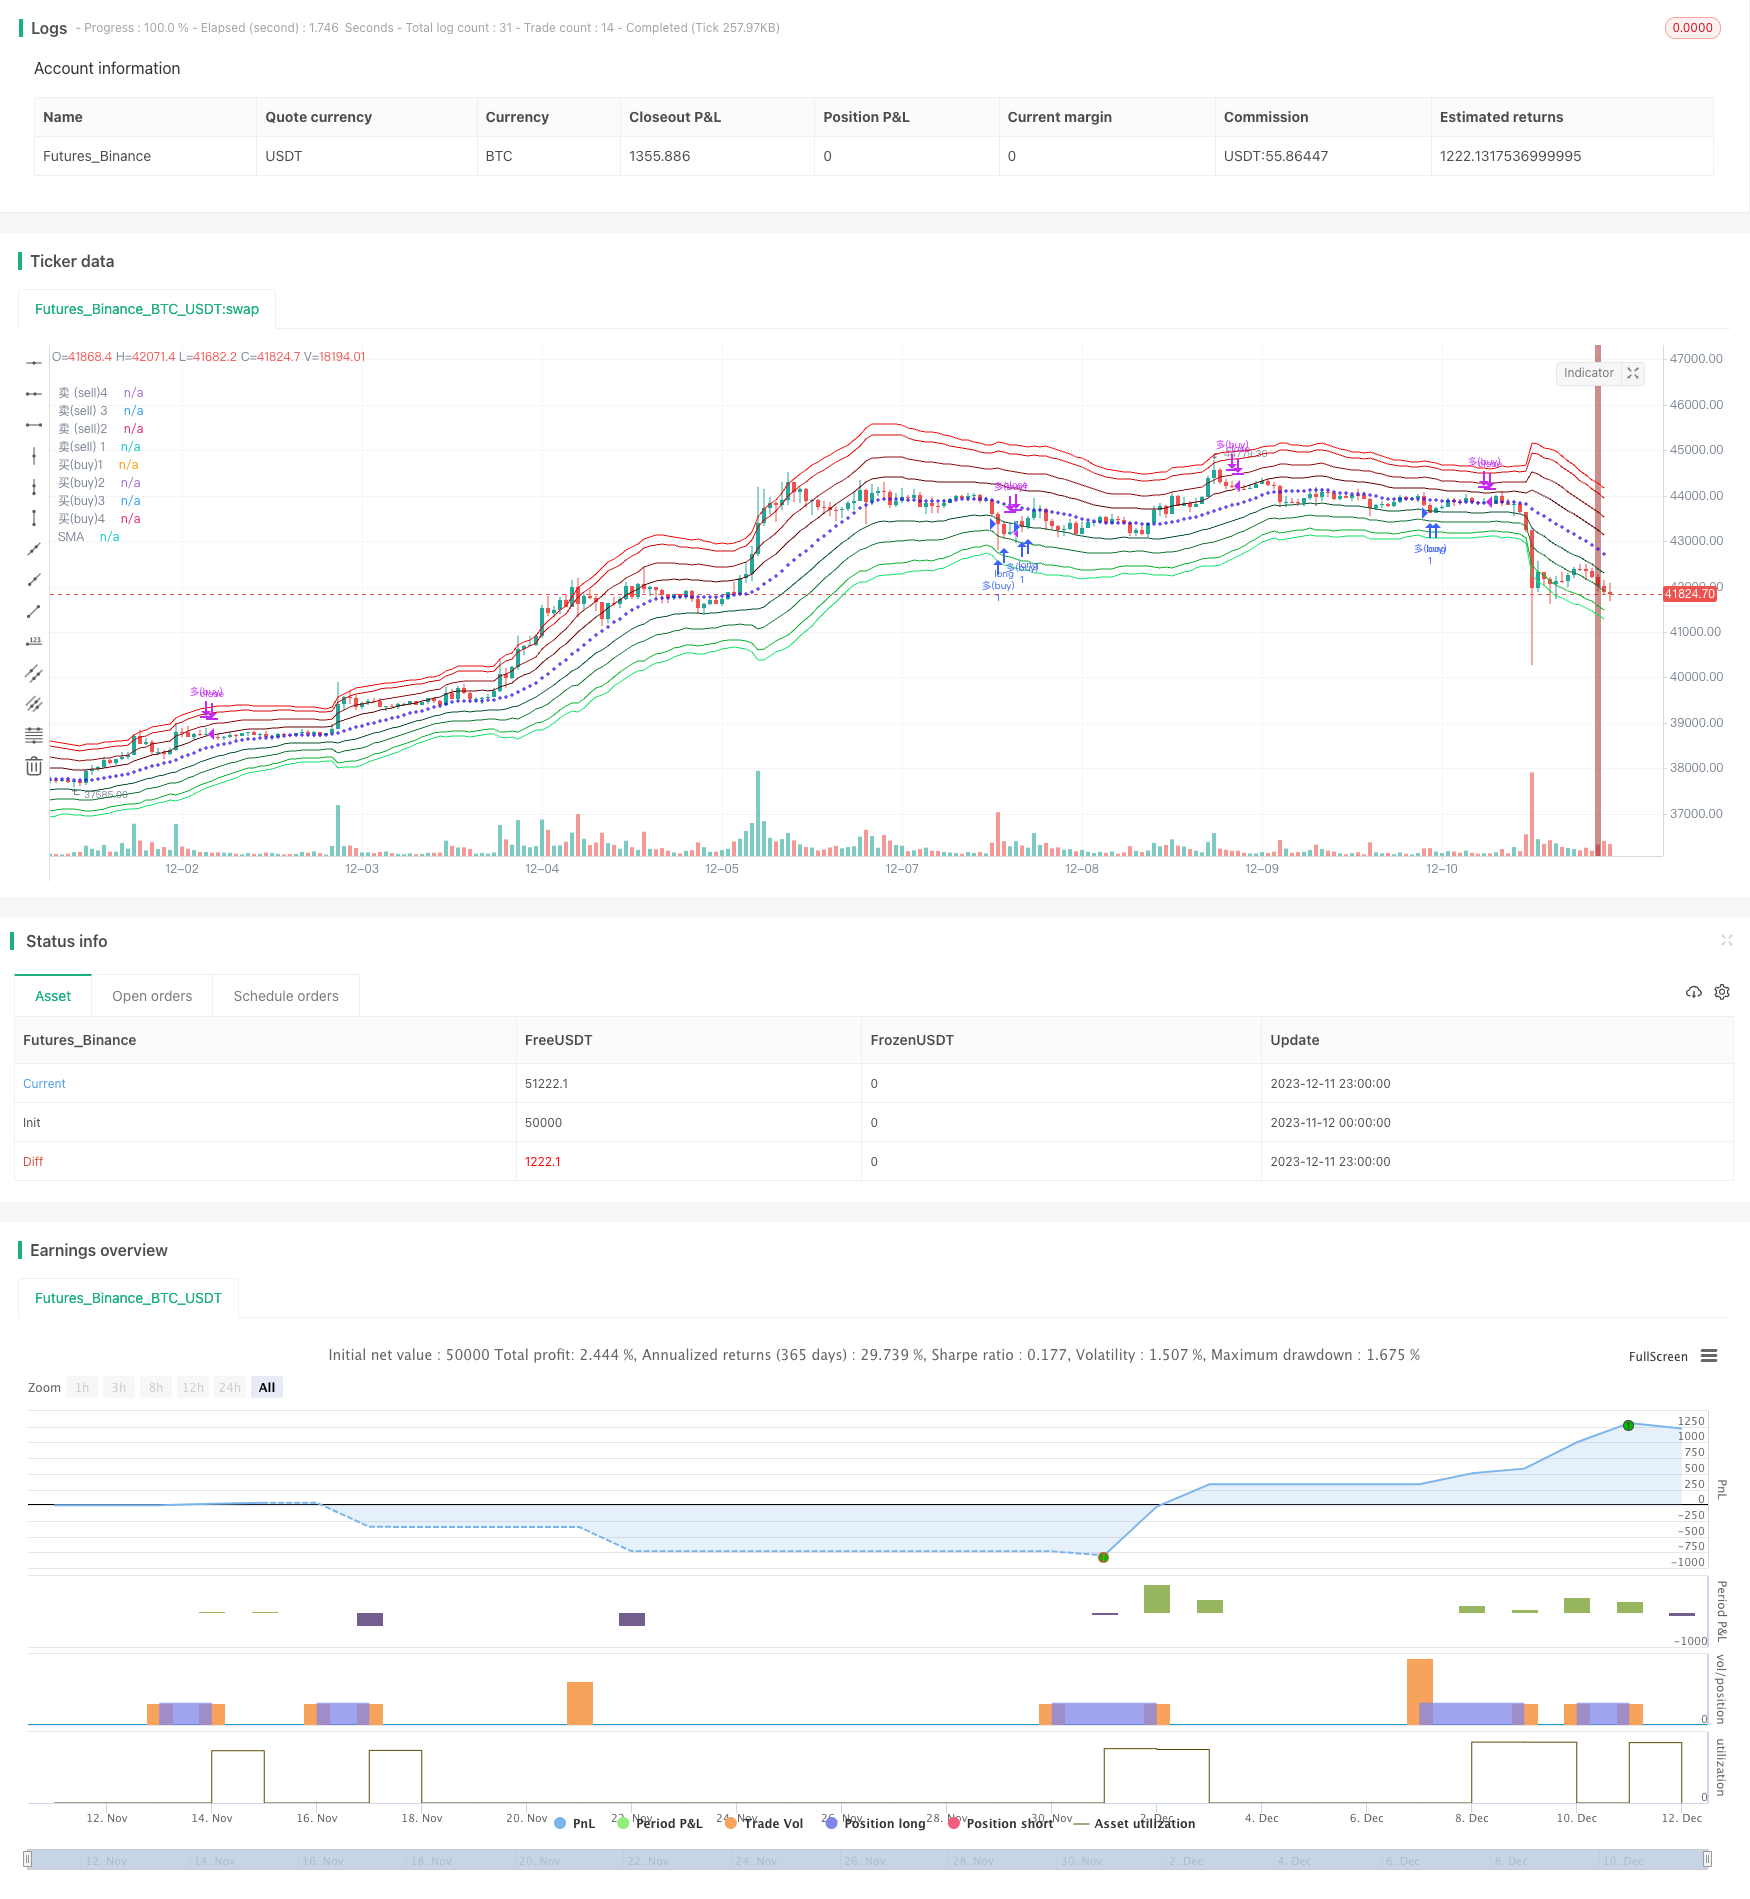 [trans]
概述
本策略运用布林通道指标绘制出基于ATR和Fibonacci回归的波段作为网格的价格通道。结合双EMA均线判断整体趋势方向,在趋势方向选择性地在布林波段价格上设置追踪止损网格,实现趋势追踪套利。
策略原理
-
使用布林通道中轴线及基于ATR和4条Fibonacci回归线绘制上下轨构建价格波段。
-
快线EMA和慢线SMA组成双均线判断整体趋势方向。快线突破慢线为多头市场,反之为空头市场。
-
在多头市场中仅做多,选择布林下轨附近价格突破通道下沿开仓做多;在空头市场中仅做空,选择布林上轨附近价格突破通道上沿开仓做空。
-
设置止损条件:出现大幅反转K线即退出当前方向仓位。
优势分析
-
使用双均线判断大级别趋势,避免逆势交易。
-
布林ATR通道网格设置了多条开仓价格,增加了开仓成功率。
-
Fibonacci回归波段设置了价格离散度,不同波段仓位数量不同,实现了资金分散。
-
实时止损条件便于快速止损,降低盈利回吐。
风险分析
-
大级别趋势判断错误,可能导致逆势亏损。可适当调整均线参数,或者增加其他指标进行辅助判断。
-
波动过大时,价格可能直接突破网格区,无法开仓。可调整波段参数,增加开仓机会。
-
止损条件较为主观,不同交易者的识别标准可能存在误差。建议测试并优化止损条件。
优化方向
-
增加apo指标进行双均线趋势判断的辅助分析。
-
使用市场波动率指标优化布林波段参数,使其更好地适应市场的动态变化。
-
调小止损幅度,并加入OTHER方式的止损条件设定,降低误差。
总结
本策略整体思路清晰,使用布林ATR通道和双均线结合实现了策略交易信号的全面综合判断,最大程度地减少了误判风险。策略优势明显,可实际应用;但细节点如参数设置和止损条件仍有优化空间,有待进一步完善。相信在不断优化中,本策略的盈利水平和稳定性都将不断提升。
||
Overview
This strategy uses the Bollinger Bands indicator to draw price channels based on ATR and Fibonacci retracements as grids. Combining with double EMA lines to determine the overall trend direction, selectively set trailing stop-loss grids at Bollinger price bands in the trend direction to achieve trend tracking arbitrage.
Strategy Principle
-
Use the middle line of the Bollinger Bands and the upper and lower rails constructed from the ATR and 4 Fibonacci retracement lines to build the price wave bands.
-
The fast EMA line and the slow SMA line form a double moving average to determine the overall trend direction. The fast line breaking through the slow line is a bull market, and vice versa is a bear market.
-
In a bull market, only go long, choose prices near the lower rail of Bollinger Bands to break through the bottom of channel to open long positions; in a bear market, only go short, choose prices near the upper rail of Bollinger Bands to break through the top of channel to open short positions.
-
Set stop loss conditions: exit current directional positions when a large reversal bar appears.
Advantage Analysis
-
Use double moving averages to determine mega-level trends to avoid counter-trend trading.
-
The Bollinger ATR channel grid sets multiple opening prices to increase the probability of opening positions successfully.
-
The Fibonacci retrace wave bands set price volatility, with different numbers of positions in different bands, achieving capital dispersion.
-
Real-time stop loss conditions facilitate quick stop losses and reduce profit retracements.
Risk Analysis
-
Errors in judging mega-level trends may lead to contrarian losses. Appropriately adjust the moving average parameters or add other indicators for auxiliary judgment.
-
When volatility is too large, prices may break through the grid area directly, unable to open positions. Adjust the wave band parameters to increase trading opportunities.
-
Stop loss conditions are more subjective, and recognition criteria may differ across traders. It is recommended to test and optimize stop loss conditions.
Optimization Directions
-
Add APO indicator for auxiliary analysis of double moving average trend judgments.
-
Use market volatility indicators to optimize Bollinger waveband parameters to better adapt to dynamic market changes.
-
Reduce the stop loss amplitude and add OTHER way to set stop loss conditions to reduce errors.
Summary
The overall idea of this strategy is clear, combining Bollinger ATR channel and double moving averages to achieve comprehensive judgment of strategy trading signals, maximizing the risk reduction of misjudgment. The advantages of the strategy are obvious and can be applied in actual trading; but there is still room for optimization in details such as parameter settings and stop loss conditions, which need to be further improved. It is believed that with continuous optimization, the profitability and stability of this strategy will continue to increase.
[/trans]
Strategy Arguments
| Argument | Default | Description |
|---|---|---|
| v_input_7 | 25 | 快线长度(fastlength) |
| v_input_8 | 200 | 慢线长度(slowlength) |
| v_input_bool_1 | true | (?回测范围backtest)启用回测时间范围限定(backtest) |
| v_input_1 | timestamp(1 Jan 2015) | 开始时间(Start) |
| v_input_2 | timestamp(1 Jan 2040) | 结束时间(finish) |
| v_input_int_1 | 20 | (?入场位entry)布林长度,(boll length) |
| v_input_3 | 1.236 | Fib 1 |
| v_input_4 | 2.382 | Fib 2 |
| v_input_5 | 3.618 | fib 3 |
| v_input_6 | 4.236 | Fib 4 |
Source (PineScript)
/*backtest
start: 2023-11-12 00:00:00
end: 2023-12-12 00:00:00
period: 1h
basePeriod: 15m
exchanges: [{"eid":"Futures_Binance","currency":"BTC_USDT"}]
*/

// This source code is subject to the terms of the Mozilla Public License 2.0 at https://mozilla.org/MPL/2.0/
// © Aayonga

//@version=5
strategy("fib trend grid@Aa", overlay=true,initial_capital=2000, default_qty_type=strategy.fixed, default_qty_value=1)

//回测时间
useDateFilter=input.bool(true,title = "启用回测时间范围限定(backtest)", group = "回测范围(backtest)")
backtesStarDate=input(timestamp("1 Jan 2015"),title = "开始时间(Start)", group = "回测范围(backtest)")
backtestEndDate=input(timestamp("1 Jan 2040"),title = "结束时间(finish)",group = "回测范围(backtest)")
inTradeWindow=true


//入场位 entry
bolllen=input.int(defval=20,minval=1,title="布林长度,(boll length)",group = "入场位(entry)")
sma=ta.sma(close,bolllen)
avg=ta.atr(bolllen)
fib1=input(defval=1.236,title="Fib 1",group = "入场位(entry)")
fib2=input(defval=2.382,title="Fib 2",group = "入场位(entry)")
fib3=input(defval=3.618,title="fib 3",group = "入场位(entry)")
fib4=input(defval=4.236,title="Fib 4",group = "入场位(entry)")
r1=avg*fib1
r2=avg*fib2
r3=avg*fib3
r4=avg*fib4
top4=sma+r4
top3=sma+r3
top2=sma+r2
top1=sma+r1
bott1=sma-r1
bott2=sma-r2
bott3=sma-r3
bott4=sma-r4


//趋势 trend

t4=plot(top4,title="卖 (sell)4",color=color.rgb(244, 9, 9))
t3=plot(top3,title = "卖(sell) 3",color=color.rgb(211, 8, 8))
t2=plot(top2,title="卖 (sell)2",color=color.rgb(146, 13, 13))
t1=plot(top1,title="卖(sell) 1",color=color.rgb(100, 3, 3))

b1=plot(bott1,title="买(buy)1",color=color.rgb(4, 81, 40))
b2=plot(bott2,title="买(buy)2",color=color.rgb(15, 117, 46))
b3=plot(bott3,title = "买(buy)3",color =color.rgb(8, 176, 42) )
b4=plot(bott4,title="买(buy)4",color=color.rgb(15, 226, 103))
plot(sma,style=plot.style_cross,title="SMA",color=color.rgb(47, 16, 225))

//趋势
LengthF=input(defval = 25,title = "快线长度(fastlength)")
LengthS=input(defval=200,title = "慢线长度(slowlength)")
emaF=ta.ema(close,LengthF)
smaS=ta.sma(close,LengthS)
longTrend=emaF>smaS
longb=ta.crossover(emaF,smaS)
bgcolor(longb ? color.new(color.green,40):na,title = "多头强势(bull trend)")
shortTrend=smaS>emaF
shortb=ta.crossunder(emaF,smaS)
bgcolor(shortb ? color.new(#951313, 40):na,title = "空头强势(bear trend)")

//pinbar
bullPinBar = ((close > open) and ((open - low) > 0.6* (high - low))) or ((close < open) and ((close - low) > 0.9 * (high - low)))
//plotshape(bullPinBar  , text ="pinbar", textcolor=color.rgb(9, 168, 144),location=location.belowbar, color=color.rgb(29, 103, 67), size=size.tiny)
bearPinBar = ((close > open) and ((high - close) > 0.7 * (high - low))) or ((close < open) and ((high - open) > 0.7 * (high - low)))
//plotshape(bearPinBar  , text ="pinbar", textcolor=color.rgb(219, 12, 12),location=location.abovebar, color=color.rgb(146, 7, 7), size=size.tiny)

buy1=ta.crossunder(close,bott1) and longTrend and close>ta.ema(close,100)
buy2=ta.crossunder(close,bott2) and longTrend and close>ta.ema(close,80)
buy3=ta.crossunder(close,bott3) and longTrend and close>ta.ema(close,80)
buy4=ta.crossunder(close,bott4) and longTrend and close>ta.ema(close,80)
buyclose=bearPinBar or ta.crossunder(close,smaS)


if buy2 or buy3 or buy4 or buy1 and inTradeWindow
    strategy.order("多(buy)",strategy.long)

if buyclose  and inTradeWindow
    strategy.close("多(buy)")

sell1=ta.crossover(close,top1) and shortTrend and close<ta.ema(close,200)
sell2=ta.crossover(close,top2) and shortTrend and close<ta.ema(close,200)
sell3=ta.crossover(close,top3) and shortTrend and close<ta.ema(close,200)
sell4=ta.crossover(close,top4) and shortTrend and close<ta.ema(close,200)
sellclose=bullPinBar or ta.crossover(close,ta.sma(close,220))

if  sell1 or sell2 or sell3 or sell4 and inTradeWindow
    strategy.order("空(sell)",strategy.short)

if sellclose  and inTradeWindow
    strategy.close("空(sell)")
Detail
https://www.fmz.com/strategy/435273
Last Modified
2023-12-13 17:12:38