
8.4 KiB
Name
布林带金叉死叉策略Bollinger-Break-Out-Strategy-with-Pyramiding
Author
ChaoZhang
Strategy Description
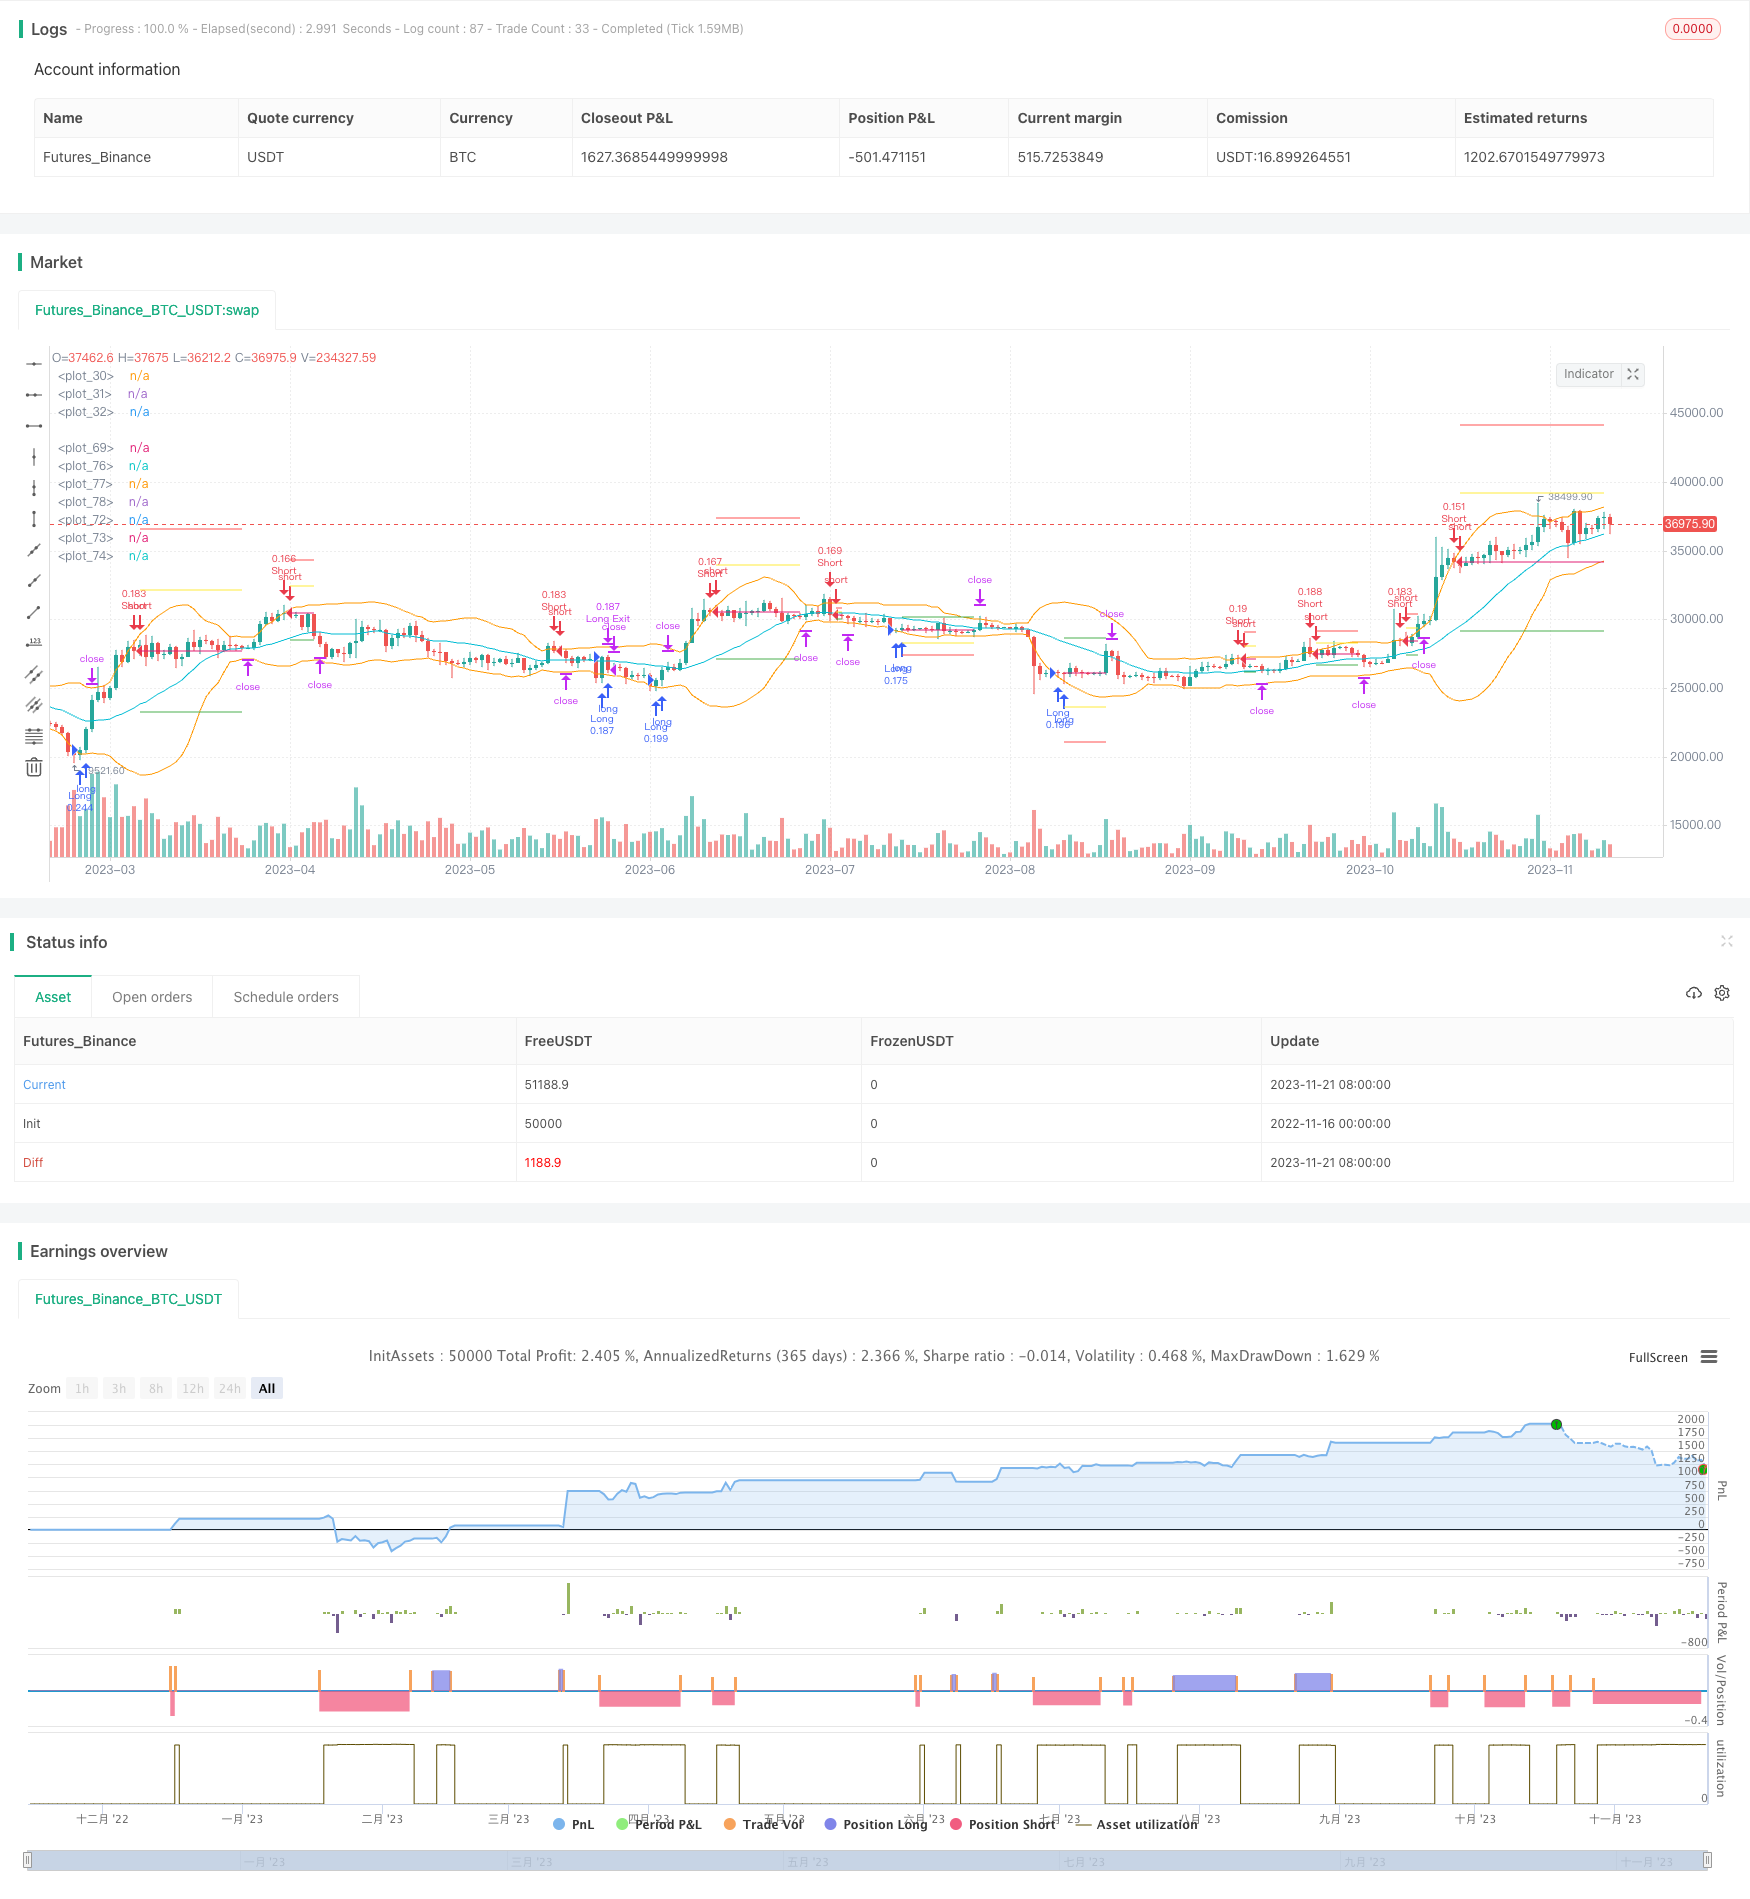 [trans]
概述
该策略是基于布林带的金叉死叉进行做多做空的策略。当价格突破布林带上轨时,做空;当价格突破布林带下轨时,做多。在持仓期间,会进行加仓以及止损追踪。
策略原理
该策略使用布林带的上中下3条轨迹。布林带中轨是n天的移动平均线,上轨是中轨+k倍的n天标准差,下轨是中轨-k倍的n天标准差。n一般为20,k一般为2。
当价格从下向上突破下轨时,表明价格开始上涨,此时做多;当价格从上向下突破上轨时,表明价格开始下跌,此时做空。
在做多做空后,会继续进行加仓。加仓的条件是在已持仓的基础上,如果价格再次触碰均线,会再次开仓做多或做空。
所有持仓的止损追踪也会实时更新。止损线会根据当前持仓的平均价格与布林带价格的差值来设定。
优势分析
该策略具有以下优势:
- 使用布林带指标,能够捕捉价格的突破,精确做多做空
- 采用金叉死叉方式,进行规则化的入场
- 持仓后会加仓,可以获得更大利润
- 实时更新止损,避免止损被冲击
风险分析
该策略也存在一些风险:
- 布林带作为指标,对市场波动较为敏感,可能会被套利
- 加仓方式增加了风险敞口,亏损会被放大
- 止损线并不绝对,还是存在被套的可能
针对这些风险,可以从以下几个方面进行优化:
- 调整布林带的参数,适应不同周期
- 优化加仓的幅度和频率
- 增加中轨作为进一步止损线
优化方向
该策略可以从以下几个方面进行优化:
- 优化布林带的参数,适应更多市场环境
- 优化加仓逻辑,平衡风险和收益
- 增加止损线,如中轨止损等
- 增加止盈策略,更主动止盈
- 结合其他指标过滤入场时机
- 优化资金管理,控制单笔风险
总结
本策略整体来说是一种典型的趋势追踪策略。它能够顺势而为,在趋势出现时获取利润。同时,也具有一定的风险,需要进一步优化和改进,适应更多市场情况,减少假突破带来的风险。
||
Overview
This strategy enters long or short positions based on breakouts of Bollinger Bands. It goes long when price breaks below lower band and goes short when price breaks above upper band. After entering positions, it continues pyramiding and updates stop loss in real-time.
Strategy Logic
The strategy uses 3 lines of Bollinger Bands - middle, upper and lower. The middle line is n-day moving average. The upper line is middle line + k * n-day standard deviation. The lower line is middle line - k * n-day standard deviation. Usually n is 20 and k is 2.
When price breaks out above upper line, it signals an downward trend and goes short. When price breaks out below lower line, it signals an upward trend and goes long.
After taking positions, the strategy keeps pyramiding, which means adding more positions in the same direction. The pyramiding entry rule is when price touches the middle line again after initial entry.
The stop loss for all positions are also updated in real-time based on the difference between current average holding price and the band price.
Advantage Analysis
The advantages of this strategy includes:
- Use Bollinger Bands to identify breakouts and trend changes accurately.
- Enter positions on golden cross and dead cross systematically.
- Earn more profit through pyramiding.
- Real-time stop loss updating to avoid being knocked out.
Risk Analysis
There are also some risks of this strategy:
- Bollinger Bands are sensitive to market volatility and may incur whipsaws.
- Pyramiding increases exposure and leverages potential loss.
- Stop loss is not guaranteed and still has the probability of being stopped out.
Some methods to tackle the risks:
- Optimize Bollinger Bands parameters for different cycles.
- Adjust pyramiding scale and frequency.
- Add middle line as further stop loss line.
Optimization Directions
The strategy can be optimized from below aspects:
- Optimize parameters of Bollinger Bands to adapt more market regimes.
- Improve pyramiding logic to balance risk-reward.
- Add more stop loss lines like middle line.
- Develop profit taking mechanism to lock profit proactively.
- Combine other indicators to filter entries.
- Enhance risk management to control loss per trade.
Conclusion
In conclusion, this is a typical trend following strategy. It rides the momentum when trend emerges and makes profit accordingly. Meanwhile, it also contains inherent risks. Further optimizations are needed to adapt more market conditions and tackle the whipsaw risk.
[/trans]
Strategy Arguments
| Argument | Default | Description |
|---|---|---|
| v_input_int_1 | 20 | bb_length |
| v_input_int_2 | 2 | bb_mult |
Source (PineScript)
/*backtest
start: 2022-11-16 00:00:00
end: 2023-11-22 00:00:00
period: 1d
basePeriod: 1h
exchanges: [{"eid":"Futures_Binance","currency":"BTC_USDT"}]
*/

//@version=5

strategy(title='Bollinger Band strategy with split, limit, stop', shorttitle='bb strategy', overlay=true,commission_type = strategy.commission.percent, commission_value = 0.01, default_qty_type = strategy.percent_of_equity, default_qty_value = 10, pyramiding = 4)


//Summary: Going Long or Short when Entering after Breaking the Bollinger Bands\
//At this time, the stop-loss, profit-taking price, and pyramiding standard\
// are determined from the difference between the position average price and the band price.

//After entering the position, if the price crosses the mid-band line, the stop loss is adjusted to the mid-band line.


//each trade, entry position size = 10% of total cash
//max pyramiding is 4
//commission = 0.01%


in_period = true


bb_length = input.int(20)
bb_mult = input.int(2)

[middle, upper, lower] = ta.bb(close,bb_length, bb_mult)
plot(middle, color=color.aqua)
plot(upper, color=color.orange)
plot(lower, color=color.orange)
long_cond = ta.crossover(close,lower)
short_cond = ta.crossunder(close,upper)

var saved_ph = 0.0
if strategy.opentrades>0 and strategy.opentrades[1]==0 and strategy.position_size > 0
    saved_ph := upper[1]
var saved_pl = 0.0
if strategy.opentrades>0 and strategy.opentrades[1]==0 and strategy.position_size < 0
    saved_pl := lower[1]

avg = strategy.position_avg_price

long_diff = saved_ph-avg
short_diff = saved_pl-avg

long_stoploss = avg - 1*long_diff
short_stoploss = avg - 1*short_diff

long_avgdown = avg - 0.5*long_diff
short_avgup = avg - 0.5*short_diff

long_profit_price = avg + 0.5*long_diff
short_profit_price = avg + 0.5*short_diff

var label _label = na
if in_period
    if long_cond and strategy.opentrades==0
        strategy.entry("Long",strategy.long)
    if long_cond and strategy.opentrades >0 and (close[1]<long_avgdown or close[2]<long_avgdown)
        strategy.entry("Long",strategy.long)

    if short_cond and strategy.opentrades==0
        strategy.entry("Short", strategy.short)
    if short_cond and strategy.opentrades>0 and (close[1]>short_avgup or close[2]>short_avgup)
        strategy.entry("Short",strategy.short)

plot(avg, style=plot.style_linebr)


plot(strategy.position_size > 0? long_profit_price: na,color=color.green, style=plot.style_linebr)
plot(strategy.position_size > 0? long_avgdown: na,color=color.yellow, style=plot.style_linebr)
plot(strategy.position_size > 0? long_stoploss: na,color=color.red, style=plot.style_linebr)

plot(strategy.position_size < 0? short_profit_price: na,color=color.green, style=plot.style_linebr)
plot(strategy.position_size < 0? short_avgup: na,color=color.yellow, style=plot.style_linebr)
plot(strategy.position_size < 0? short_stoploss: na,color=color.red, style=plot.style_linebr)

if strategy.position_size > 0
    if ta.crossover(close, middle)
        strategy.exit("Long Exit", "Long", limit=long_profit_price, stop=middle)
    else
        strategy.exit("Long Exit", "Long", limit=long_profit_price, stop=long_stoploss)
if strategy.position_size < 0
    if ta.crossunder(close, middle)
        strategy.exit("Short Exit", "Short", limit=short_profit_price, stop=middle)
    else
        strategy.exit("Short Exit", "Short", limit=short_profit_price, stop=short_stoploss)
Detail
https://www.fmz.com/strategy/432992
Last Modified
2023-11-23 14:01:57