
7.0 KiB
Name
威美均线策略WAMI-Strategy
Author
ChaoZhang
Strategy Description
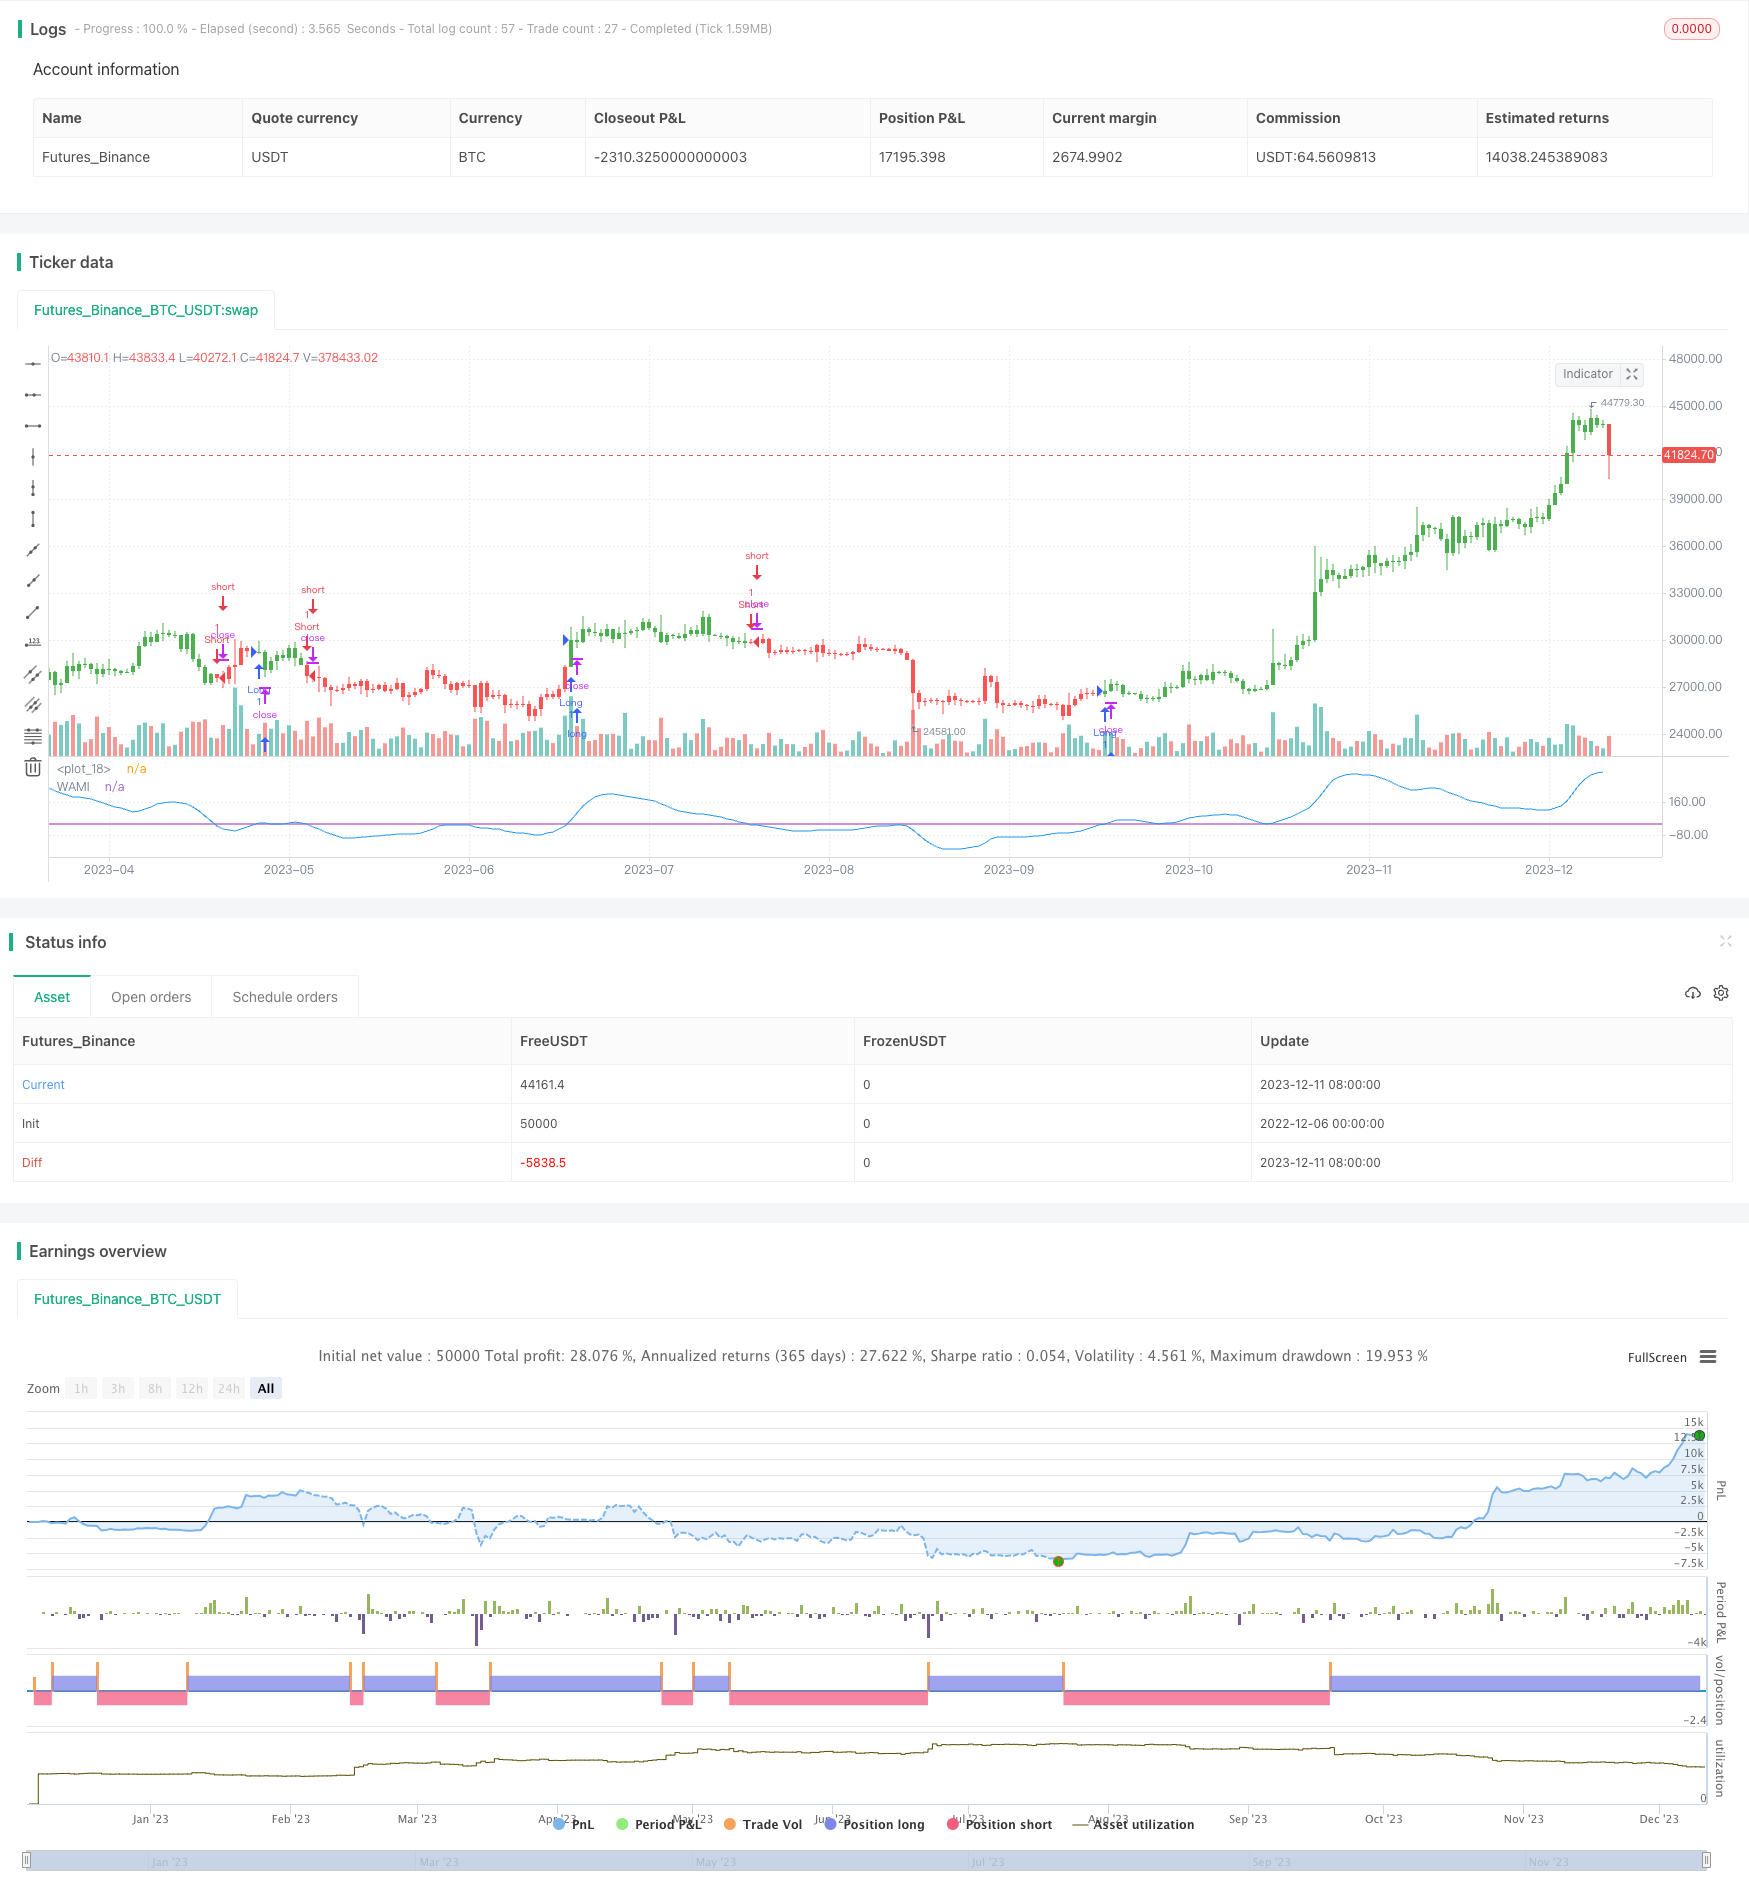 [trans]
概述
威美均线策略(WAMI Strategy)是一个基于傅里叶分析,通过迭代优化过程找到在历史市场数据中能够持续获得稳定收益的交易策略。它结合了指数移动平均线(EMA)、加权移动平均线(WMA)和动量指标(MOM),形成一个复合交易指标——威美均线(WAMI)。当威美均线高于或低于一个阈值时,该策略会发出买入或卖出信号。
策略原理
该策略的核心指标是威美均线(WAMI)。它的计算方法是:先计算价格的动量,再计算出n日加权移动平均,然后进行两次指数移动平均计算,得到最终的威美均线。其中动量指标反映价格变化速度,WMA过滤掉短期噪音,EMA平滑价格。
当威美均线上升越过指定阈值时产生买入信号,意味着市场正在形成上涨趋势;当下降越过阈值时产生卖出信号,代表进入下跌趋势。用户可以根据回测结果自行调整阈值,以达到更好的策略优化效果。
优势分析
该策略结合了趋势跟踪和超买超卖判断,能抓住中长线价格趋势的同时避免被套。相比普通移动平均线策略,威美均线提高了交易信号的质量和稳定性。
主要优势有:
- 傅里叶优化提高参数可配置性
- 双EMA滤波降低假信号
- WMA+MOM组合提高敏感性
- 可长可短,适应性强
风险分析
该策略也存在一些风险:
- 优化过程复杂,不当设置可能失败
- 大幅震荡市场中震荡率降低
- 表现与参数设置高度相关
- 趋势反转时无法快速切换
可以通过调整参数组合、设置止损、合理期望收益来降低这些风险。当市场进入剧烈震荡时,应暂停使用或减小仓位。
优化方向
该策略还可从以下几个方面进行优化:
- 测试更多参数组合寻找最优参数
- 增加成交量等辅助条件过滤entry
- 增加止损机制
- 结合其他指标判断大级别趋势
- 动态调整参数适应市场环境
总结
综上所述,威美均线策略是一个值得推荐的中长线趋势跟踪策略。它通过对价格apw量变化的深入分析,形成高质量的交易信号。在参数优化和风险控制到位的前提下,该策略可以获得稳定收益。但用户需要注意,任何策略都存在失败的可能,务必审慎评估后再投入真实资金交易。
||
Overview
The WAMI Strategy is a trading strategy based on Fourier analysis that aims to find consistent and profitable trades on historical market data through an iterative optimization process. It combines the Exponential Moving Average (EMA), Weighted Moving Average (WMA), and Momentum indicator (MOM) to form a composite trading indicator called WAMI. When the WAMI crosses above or below a threshold, the strategy will issue buy or sell signals.
Strategy Logic
The core indicator of this strategy is WAMI. Its calculation is: first compute the momentum of price, then take the n-day WMA, and finally perform EMA twice to derive the final WAMI. Among them, momentum reflects the speed of price changes, WMA filters out short-term noise, and EMA smoothes the price.
When WAMI rises above a given threshold, a buy signal is generated, implying an uptrend is forming in the market. When it falls below the threshold, a sell signal is generated, meaning a downtrend has commenced. Users can adjust the threshold based on backtest results to better optimize the strategy.
Advantage Analysis
This strategy combines trend-following and overbought-oversold analysis, which can capture medium-to-long term price trends while avoiding being trapped. Compared to plain moving average strategies, WAMI improves the quality and consistency of trading signals.
The main advantages are:
- Fourier optimization improves parameter tuning
- Double EMA filter reduces false signals
- WMA+MOM combo improves sensitivity
- Flexible for both short and long-term trading
Risk Analysis
There are also some risks with this strategy:
- Optimization process is complex, improper settings may fail
- Performance decreases in ranging markets
- Performance highly depends on parameter settings
- Slow to switch on trend reversals
These risks can be reduced by adjusting parameter combinations, setting stop loss, and having reasonable profit expectations. The strategy should be stopped or position sized down when markets become excessively volatile.
Optimization Directions
Some aspects this strategy can be further optimized on:
- Test more parameter sets to find optimum
- Add supporting conditions like volume filter for entries
- Incorporate stop loss mechanisms
- Combine with other indicators to gauge overall trend
- Dynamically adjust parameters to fit changing market environments
Conclusion
In conclusion, the WAMI Strategy is a recommended medium-to-long term trend following strategy. By thoroughly analyzing price and volume changes, it generates quality trading signals. Given proper parameter optimization and risk control, this strategy can achieve steady profits. However, users should note that any strategy may fail, so prudent evaluation is a must before committing real capital.
[/trans]
Strategy Arguments
| Argument | Default | Description |
|---|---|---|
| v_input_1 | 13 | Length_EMA |
| v_input_2 | 4 | Length_WMA |
| v_input_3 | false | Trigger |
| v_input_4 | false | Trade reverse |
Source (PineScript)
/*backtest
start: 2022-12-06 00:00:00
end: 2023-12-12 00:00:00
period: 1d
basePeriod: 1h
exchanges: [{"eid":"Futures_Binance","currency":"BTC_USDT"}]
*/

//@version=2
////////////////////////////////////////////////////////////
//  Copyright by HPotter v1.0 17/01/2017
// The WAMI-based trading lies in the application and iteration of the
// optimization process until the indicated trades on past market data
// give consistent, profitable results. It is rather difficult process
// based on Fourier analysis.
// You can to change Trigger parameter for to get best values of strategy.
//
// You can change long to short in the Input Settings
// Please, use it only for learning or paper trading. Do not for real trading.
////////////////////////////////////////////////////////////
strategy(title="WAMI Strategy", shorttitle="WAMI Strategy")
Length_EMA = input(13, minval=1)
Length_WMA = input(4, minval=1)
Trigger = input(0)
reverse = input(false, title="Trade reverse")
hline(Trigger, color=purple, linestyle=line)
xWAMI = ema(ema(wma(mom(close, 1),Length_WMA),Length_EMA),Length_EMA)
pos = iff(xWAMI > Trigger, 1,
	   iff(xWAMI < Trigger, -1, nz(pos[1], 0)))
possig = iff(reverse and pos == 1, -1,
          iff(reverse and pos == -1, 1, pos))
if (possig == 1)
    strategy.entry("Long", strategy.long)
if (possig == -1)
    strategy.entry("Short", strategy.short)
barcolor(possig == -1 ? red: possig == 1 ? green : blue )
plot(xWAMI, color=blue, title="WAMI")
Detail
https://www.fmz.com/strategy/435285
Last Modified
2023-12-13 17:42:01