
9.7 KiB
Name
多重指标组合自适应趋势策略Multi-indicator-Combination-Adaptive-Trend-Strategy
Author
ChaoZhang
Strategy Description
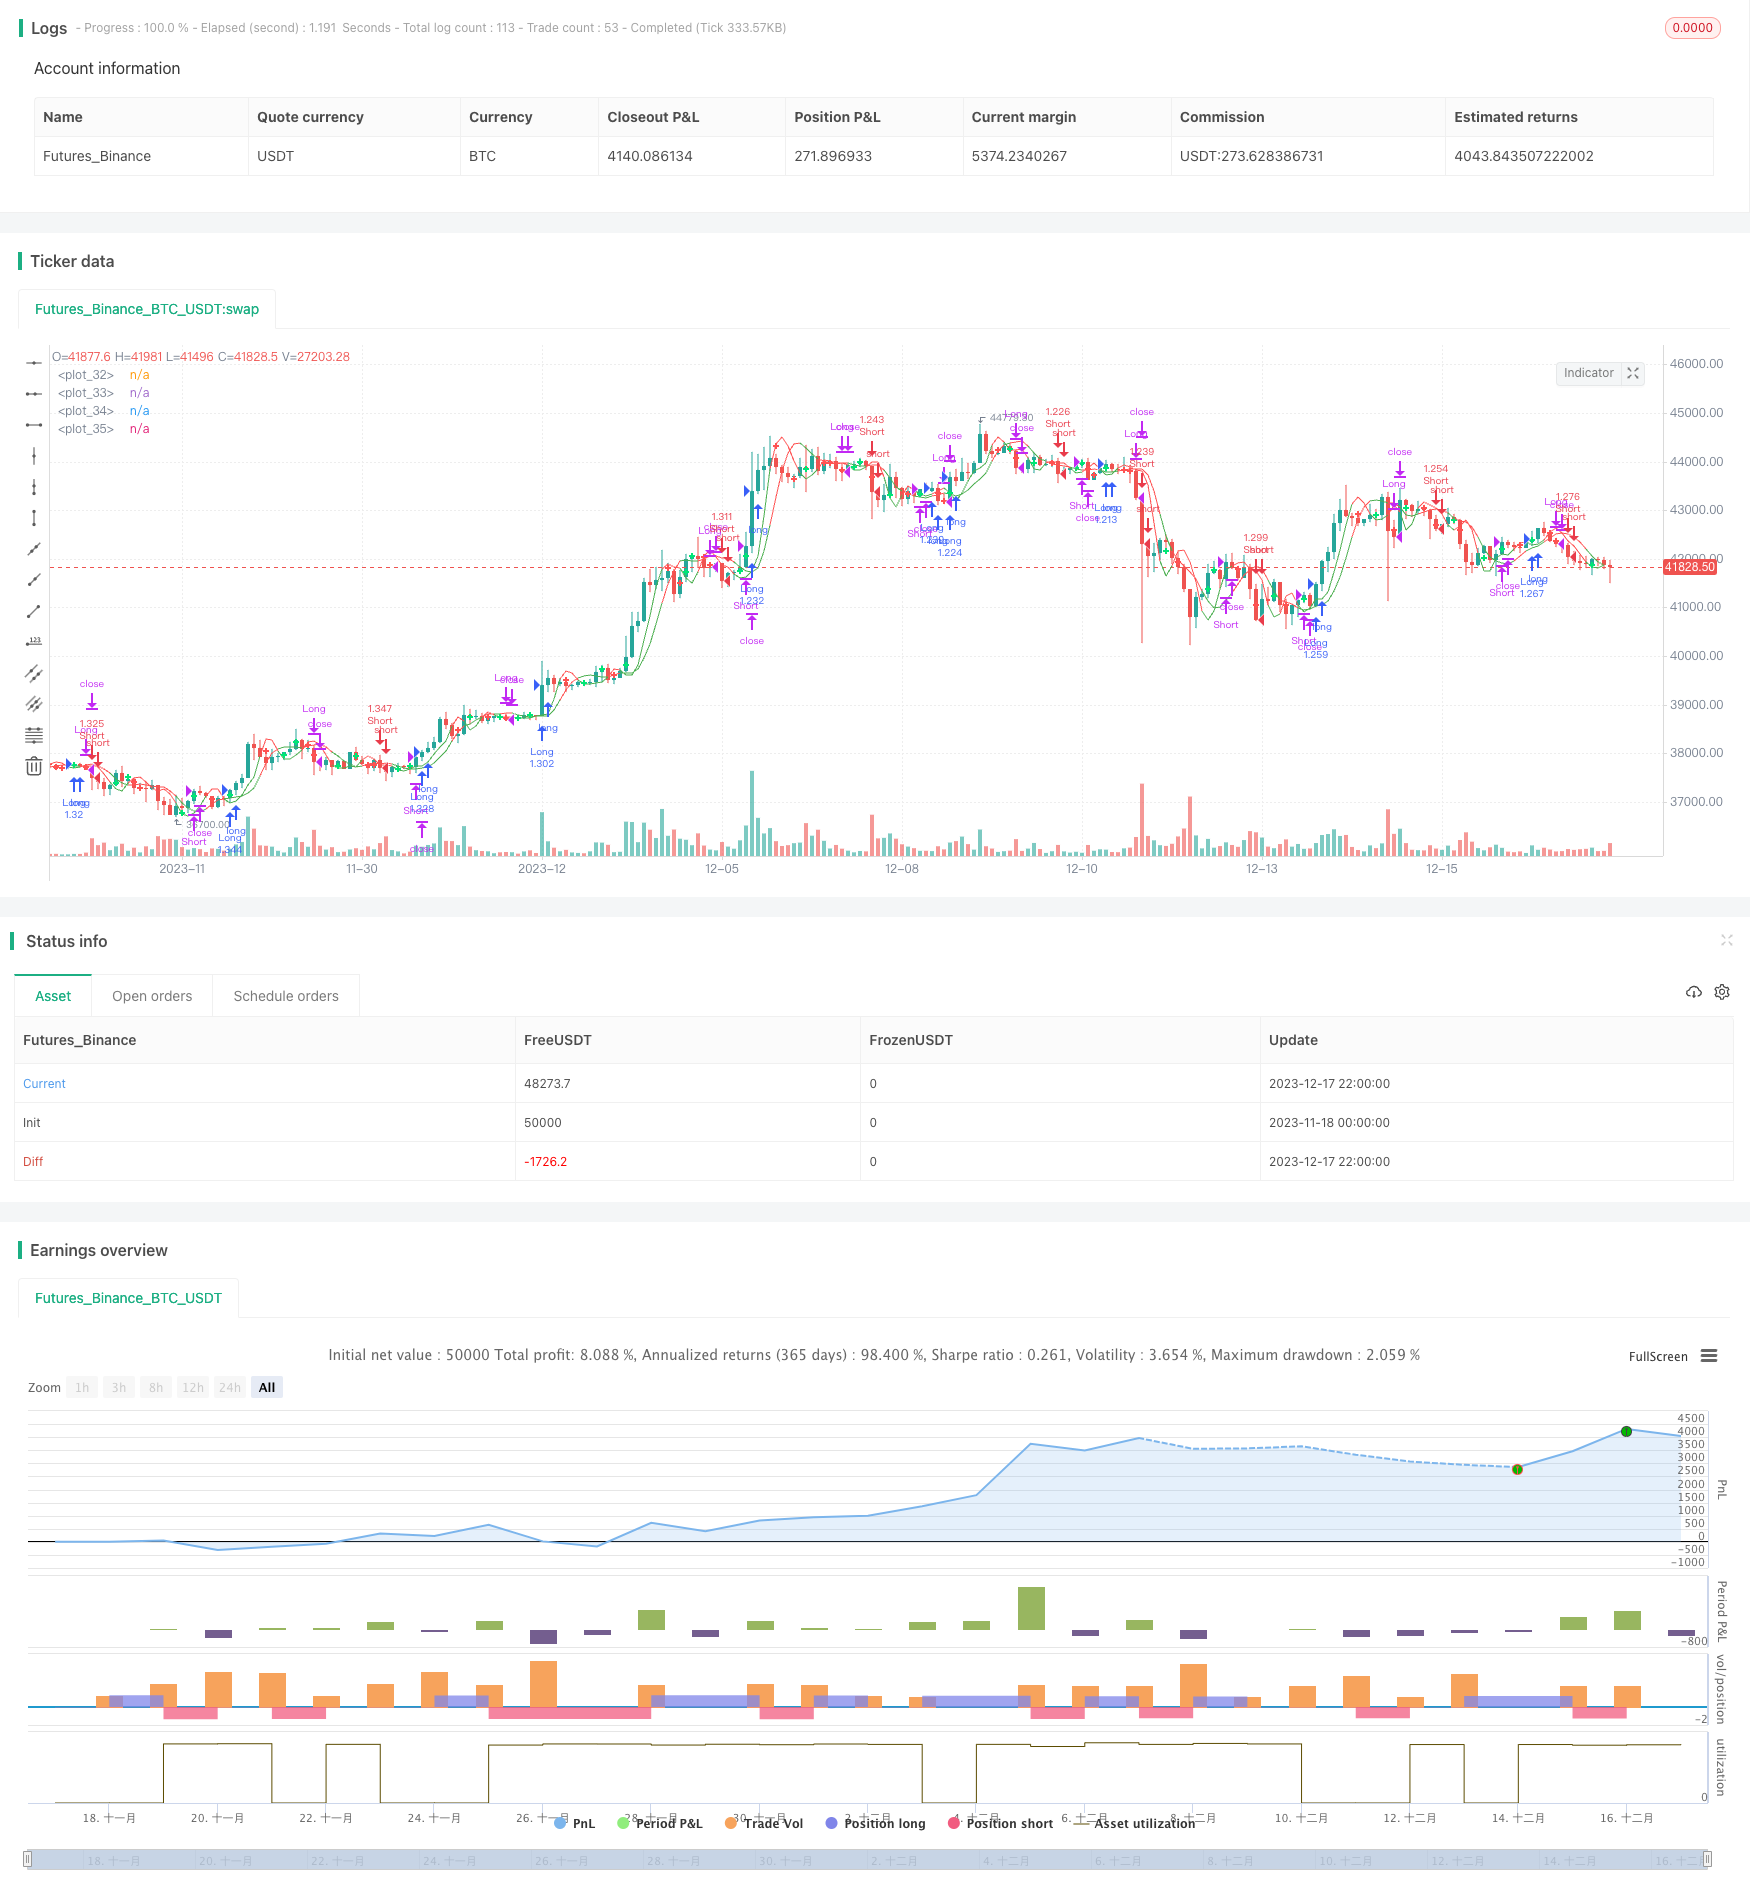 [trans]
概述
本策略通过组合使用双重Hull移动平均线指标、容量加权移动平均线指标、MACD指标和真实力度指数指标,实现对趋势的精确判断。它能够自动适应市场环境的变化,具有较强的适应性。
策略原理
该策略的核心指标是双重Hull移动平均线,它由两个参数keh和teh控制计算。这两个参数分别确定了快线和慢线的周期。快线和慢线构成金叉死叉,判断目前趋势。
辅助判断指标有容量加权移动平均线meh1。当价格高于meh1时,为看涨形势;价格低于meh1时,为看跌形势。
另一个辅助判断指标是MACD。它由快速移动平均线减去慢速移动平均线得到MACD,再用MACD的移动平均线得到讯号线。当MACD高于讯号线时为看涨形势。
最后一个辅助判断指标是TSI,它通过价格变化率的双重平滑计算得到。其绝对值大小代表价格变化的势头。在买入和卖出条件中,对TSI的讯号线进行判断,控制Entries和Exits的时机。
综合这几个指标的信号,可以准确判断趋势,并且自动调整参数,与市场达到同步。
策略优势
-
使用双重Hull移动平均线作为主要判断指标,辅以其他多个指标组合使用,可以提高判断准确性,降低假信号。
-
应用TSI指标判断入市和出市的时机,可以控制风险。
-
多种参数可以自行调整,适应性强,可以自动适应市场变化。
-
采用指标组合和参数自适应的思路,使策略稳定性好,连续盈利能力强。
风险分析
-
虽然加入了TSI指标判断时机,但gorithm使用的指标还是趋势类型,如果遇到震荡抽头市场,会增大盈亏波动。
-
参数设置不当可能导致策略失效,需要根据自己的经验合理设定参数。
-
多指标组合增加了计算量,在数据量大的股票和时间段上报错的可能性会增大,需要控制数据范围。
-
需要监控指标的计算效果,防止异常数据的干扰。
策略优化方向
-
可以测试添加其他辅助指标,如BOLL指标等,使信号更加准确可靠。
-
优化入市出市逻辑,设置止损止盈条件,控制单笔盈亏。
-
对交易品种参数进行训练和优化,使其更好地适应不同品种。
-
增加参数自适应模块,使策略参数可以根据最近交易效果自动调整。
总结
本策略集成了多种指标的优势,采用指标组合判断趋势方向,在控制风险的同时,提高了判断的准确性。通过参数优化和逻辑优化,可以使策略更好地适应市场变化,在降低连续亏损的基础上获取更大利润。本策略稳定性好,可以长期应用在股票和加密货币等品种上。
||
Overview
This strategy accurately judges the trend by combining the double Hull moving average indicator, volume weighted moving average indicator, MACD indicator and true strength index indicator. It can automatically adapt to changes in market conditions and has strong adaptability.
Strategy Principle
The core indicator of this strategy is the double Hull moving average, which is controlled by two parameters keh and teh. These two parameters determine the cycle of fast line and slow line respectively. The golden cross and dead cross formed by fast line and slow line judge the current trend.
The auxiliary judgment indicator is the volume weighted moving average meh1. When the price is higher than meh1, it is a bullish trend; when the price is lower than meh1, it is a bearish trend.
Another auxiliary judgment indicator is MACD. It is obtained by subtracting the fast moving average from the slow moving average to get MACD, and then using the moving average of MACD to get the signal line. When MACD is higher than the signal line, it is a bullish trend.
The last auxiliary judgment indicator is TSI, which is calculated by double smoothing the rate of change of price. Its absolute value magnitude represents the momentum of price change. In the buy and sell conditions, the signal line of TSI is judged to control the timing of Entries and Exits.
By combining the signals of these indicators, the trend can be accurately judged, and the parameters can be automatically adjusted to synchronize with the market.
Advantages
-
Using double Hull moving average as the main judgment indicator, combined with multiple other indicators, can improve judgment accuracy and reduce false signals.
-
Applying the TSI indicator to determine the timing of market entry and exit can control risks.
-
Multiple adjustable parameters for strong adaptability that can automatically adapt to market changes.
-
The idea of indicator combination and parameter self-adaptation makes the strategy stable with strong continuous profitability.
Risk Analysis
-
Although the TSI indicator is used to determine the timing, the indicators used in the algorithm are still trend types. If a shock and pullback market is encountered, it will increase fluctuations in profit and loss.
-
Improper parameter settings may cause strategy failure. Parameters need to be set reasonably based on experience.
-
The combination of multiple indicators increases the amount of calculation, which increases the possibility of errors in large data stocks and time periods. The data range needs to be controlled.
-
Need to monitor the calculation effect of indicators to prevent interference from abnormal data.
Optimization Direction
-
Other auxiliary indicators such as BOLL can be tested to make the signal more accurate and reliable.
-
Optimize entry and exit logic, set stop loss and take profit conditions to control single profit and loss.
-
Train and optimize parameters for different varieties to make them better suited for different varieties.
-
Increase the parameter self-adaptation module to automatically adjust the strategy parameters based on recent transaction effects.
Summary
This strategy integrates the advantages of multiple indicators and uses indicator combinations to judge trend direction. While controlling risks, it improves the accuracy of judgments. Through parameter optimization and logic optimization, the strategy can be better adapted to market changes, while reducing consecutive losses and gaining greater profits. This strategy is stable and can be used for stocks, cryptocurrencies and other varieties for long term.
[/trans]
Strategy Arguments
| Argument | Default | Description |
|---|---|---|
| v_input_1 | 7 | Double HullMA 1 |
| v_input_2 | 14 | Double HullMA 2 |
| v_input_3 | true | VWMA |
| v_input_4 | 7 | MacD fastLength |
| v_input_5 | 14 | MacD slowlength |
| v_input_6 | 3 | MacD Length |
| v_input_7 | 5 | TSI Long Length |
| v_input_8 | 3 | TSI Short Length |
| v_input_9 | 2 | TSI Signal Length |
| v_input_10 | 4 | TSI Upper Line |
| v_input_11 | -4 | TSI Lower Line |
Source (PineScript)
/*backtest
start: 2023-11-18 00:00:00
end: 2023-12-18 00:00:00
period: 2h
basePeriod: 15m
exchanges: [{"eid":"Futures_Binance","currency":"BTC_USDT"}]
*/

//@version=2
//                                                    Quad-HullMA-cross & VWMA & MacD & TSI combination  <<<<< by SeaSide420 >>>>>>
strategy("MultiCross420", overlay=true, calc_on_order_fills= true, calc_on_every_tick=true, default_qty_type=strategy.percent_of_equity, default_qty_value=100, pyramiding=0)
keh=input(title="Double HullMA 1",defval=7, minval=1)
teh=input(title="Double HullMA 2",defval=14, minval=1)
meh=input(title="VWMA",defval=1, minval=1)
meh1=vwma(close,round(meh))
n2ma=2*wma(close,round(keh/2))
nma=wma(close,keh)
diff=n2ma-nma,sqn=round(sqrt(keh))
n2ma1=2*wma(close[2],round(keh/2))
nma1=wma(close[2],keh)
diff1=n2ma1-nma1,sqn1=round(sqrt(keh))
n1=wma(diff,sqn)
n2=wma(diff1,sqn)
b=n1>n2?lime:red
c=n1>n2?green:red
n2ma3=2*wma(close,round(teh/2))
nma2=wma(close,teh)
diff2=n2ma3-nma2,sqn2=round(sqrt(teh))
n2ma4=2*wma(close[2],round(teh/2))
nma3=wma(close[2],teh)
diff3=n2ma4-nma3,sqn3=round(sqrt(teh))
n3=wma(diff2,sqn2)
n4=wma(diff3,sqn3)
fastLength = input(title="MacD fastLength", defval=7)
slowlength = input(title="MacD slowlength", defval=14)
MACDLength = input(title="MacD Length", defval=3)
MACD = ema(close, fastLength) - ema(close, slowlength)
aMACD = ema(MACD, MACDLength)
delta = MACD - aMACD
a1=plot(n1,color=c),a2=plot(n2,color=c)
plot(cross(n1, n2) ? n1 : na, style = cross, color=b, linewidth = 3)
a3=plot(n3,color=c),a4=plot(n4,color=c)
plot(cross(n3, n4) ? n1 : na, style = cross, color=b, linewidth = 3)
//a5=plot(meh1,color=c)
long = input(title="TSI Long Length",  defval=5)
short = input(title="TSI Short Length",  defval=3)
signal = input(title="TSI Signal Length",  defval=2)
linebuy = input(title="TSI Upper Line",  defval=4)
linesell = input(title="TSI Lower Line",  defval=-4)
price = close
double_smooth(src, long, short) =>
    fist_smooth = ema(src, long)
    ema(fist_smooth, short)
pc = change(price)
double_smoothed_pc = double_smooth(pc, long, short)
double_smoothed_abs_pc = double_smooth(abs(pc), long, short)
tsi_value = 100 * (double_smoothed_pc / double_smoothed_abs_pc)
closelong = n1<n2 and n3<n4 and n1>meh1
if (closelong)
    strategy.close("Long")
closeshort = n1>n2 and n3>n4 and n1<meh1
if (closeshort)
    strategy.close("Short")
longCondition = strategy.opentrades<1 and n1>n2 and MACD>aMACD and n1<meh1 and n3>n4 and ema(tsi_value, signal)>linesell
if (longCondition)
    strategy.entry("Long",strategy.long)
shortCondition = strategy.opentrades<1  and n1<n2 and MACD<aMACD and n1>meh1 and n3<n4 and ema(tsi_value, signal)<linebuy
if (shortCondition)
    strategy.entry("Short",strategy.short)
Detail
https://www.fmz.com/strategy/435834
Last Modified
2023-12-19 11:01:05