
12 KiB
Name
多重指标的量化交易策略Quantitative-Trading-Strategy-Based-on-Multiple-Indicators
Author
ChaoZhang
Strategy Description
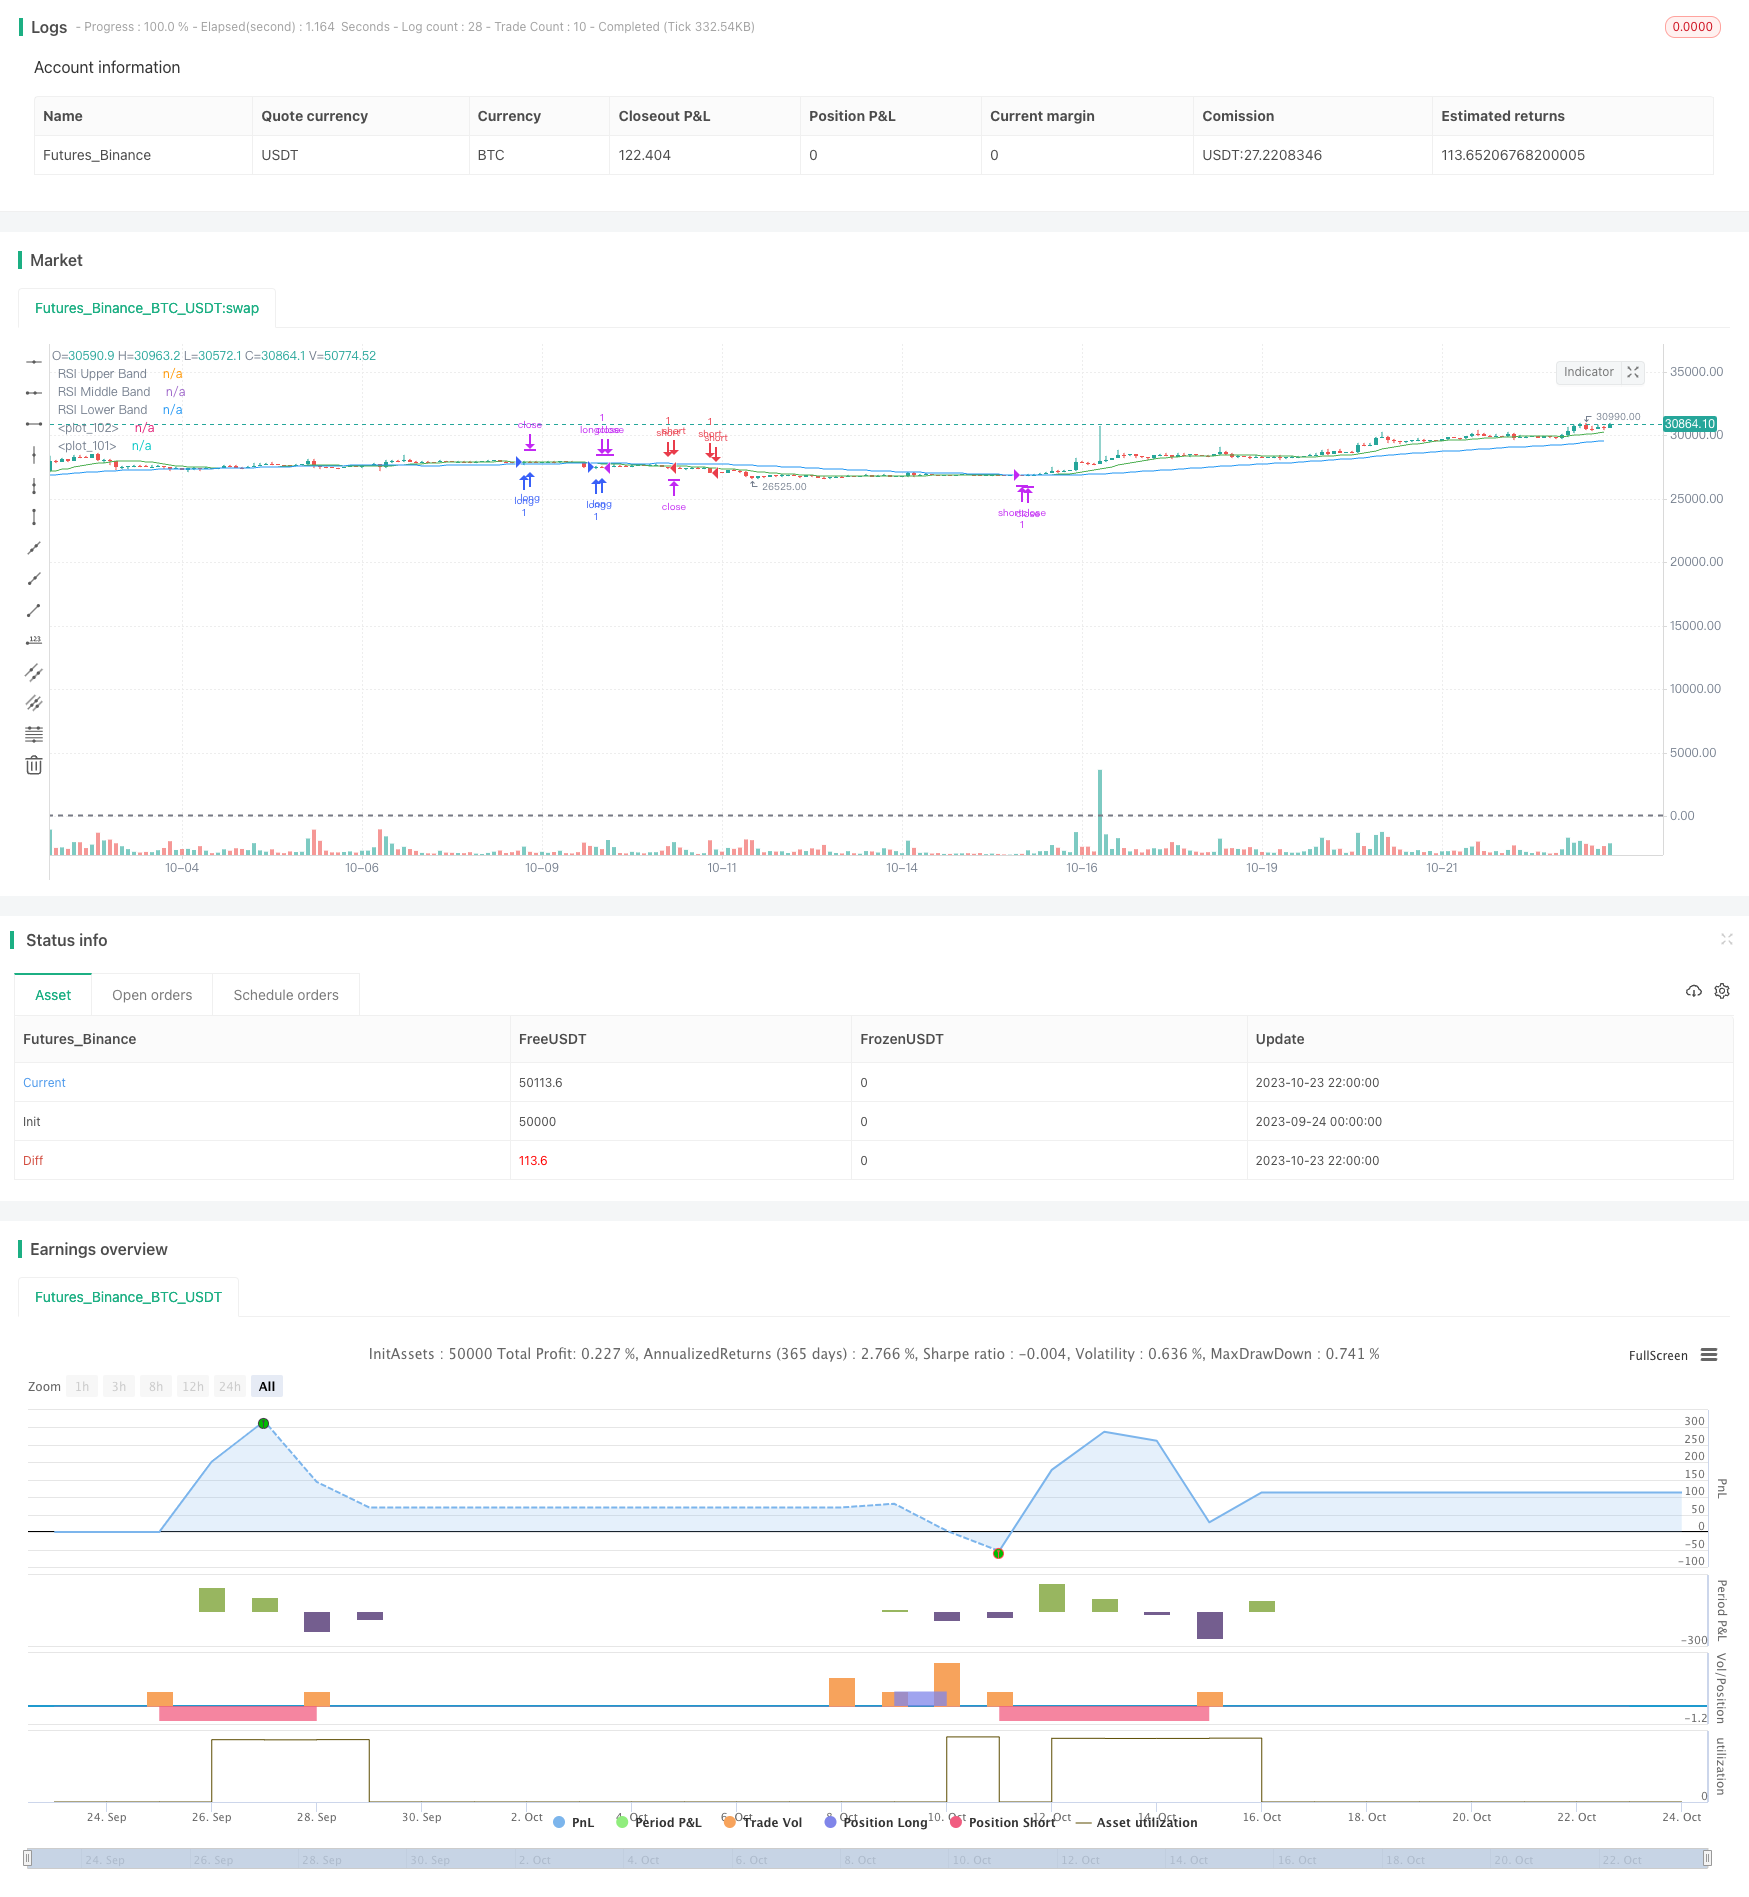
[trans]
概述
本策略运用多种技术指标相结合,制定长短双向交易决策。主要包括布林线、RSI、ADX等指标,同时结合均线判断趋势方向。
策略原理
该策略主要是通过布林线来判断价格震荡态势,布林线收窄代表价格波动降低,可能发生突破;同时结合RSI来判断超买超卖现象,RSI高于70为超买区,低于30为超卖区。当布林线收窄,RSI指标接近超买超卖区时,进行反向交易。
此外,该策略还运用ADX判断价格走势强度。当ADX较高时,代表趋势较强,此时可选择顺势交易;当ADX较低时,代表无明显趋势,此时可考虑反转交易。最后,结合均线判断长期趋势方向,若价格在上涨趋势中,可以考虑买入;若价格处于下跌趋势中,可以考虑卖出。
具体来说,当布林带收窄,RSI指标接近超买超卖区,且价格跌破下轨时,认为行情可能反弹,此时考虑做多;当布林带收窄,RSI指标接近超卖区,且价格冲破上轨时,认为行情可能下跌,此时考虑做空。此外,若ADX较高,价格在上升趋势中,可以加仓做多;若ADX较低,价格在下跌趋势中,可以加仓做空。通过组合运用多种指标,可以提高交易系统的稳定性。
优势分析
这种多指标组合策略具有以下优势:
-
综合考虑多种技术指标,提高了交易信号的准确性和稳健性。单一指标易受假突破等误导,多指标组合可以验证信号,避免错误交易。
-
既考虑趋势,也考虑震荡,能够适应不同市场情况,灵活层变。趋势交易追求大趋势,震荡交易目标小幅获利。
-
同时做多做空,可以降低单边市场的仓位风险,防范极端行情。
-
设置止损止盈点,可以 some profits and limit losses when positions go wrong.
-
通过参数优化,可以不断提升策略效果,适应市场变化。
风险分析
该策略也存在一些风险需要注意:
-
多指标组合增加了策略复杂度,参数设置不当可能降低效果。需要充分测试优化。
-
过于依赖技术指标,忽略基本面信息,可能导致交易信号不准确。指标发出假信号时需要审慎对待。
-
指标产生信号时,行情可能已发生一定变化,存在追高杀跌的风险。需要适当等待回调。
-
多空双开会增加交易频率,提高手续费成本和资金压力。需要控制仓位规模。
-
存在一定的曲线拟合风险,最好在多种市场中测试策略健壮性。
可以通过严格的止损,谨慎加仓,合理控制仓位等方法来控制风险。整体来说,该策略具有较强的实用性。
优化方向
这种策略可以考虑从以下几个方面进行优化:
-
测试不同参数组合,寻找最优参数。可以用步进法、随机搜索、遗传算法等方法进行参数优化。
-
增加更多指标,如KDJ,威廉指标等,形成指标群,提高策略稳健性。
-
优化仓位管理,通过动态仓位调整来控制风险。
-
结合机器学习算法,利用量化模型来判断价格趋势及未来走势。
-
在不同品种、时间周期、市场中测试,提高策略的适应性。
-
优化入场 timing 和出场 timing,以 Capture trends at an early stage and exit before reversal.
-
采用止盈追踪、移动止损等方法来锁定利润、控制风险。
8.加入基本面因素、市场结构判断来过滤技术指标产生的信号。
总结
本策略通过运用多种指标判断价格趋势,实现自动化交易。策略具有指标群验证、双向交易、止损止盈等优点,可以提高交易效率。但也需注意过优化、假信号等问题。通过不断优化测试,该策略可以成为一个稳定、实用的量化交易系统。它代表了量化交易策略设计的发展方向。
||
Overview
This strategy combines multiple technical indicators to make long and short trading decisions. It mainly uses Bollinger Bands, RSI, ADX and other indicators, together with moving averages to determine trend direction.
Strategy Logic
The strategy mainly uses Bollinger Bands to judge price volatility. Narrowing bands represents decreasing volatility which may lead to a breakout. RSI is used to identify overbought and oversold conditions. RSI above 70 is overbought while below 30 is oversold. When bands narrow and RSI approaches its limits, reverse trading is considered.
In addition, ADX is used to assess trend strength. High ADX represents a strong trend, favoring trend trading. Low ADX represents no clear trend, considering mean reversion. Finally, moving averages define long-term trend direction. Uptrend favors long while downtrend favors short.
Specifically, when bands squeeze, RSI nears its limits, and price breaks below lower band, a bounce is expected, go long. When bands squeeze, RSI nears its limits, and price breaks above upper band, a decline is expected, go short. Also, with high ADX, add longs in uptrend. With low ADX, add shorts in downtrend. Combining indicators improves system robustness.
Advantage Analysis
The multi-indicator strategy has these advantages:
-
Combining indicators improves accuracy and robustness. Single indicator is prone to false signals while multiple indicators verify signals and avoid bad trades.
-
Considers both trend and range trading, adaptable to different market conditions. Trend trading targets big moves. Range trading aims for small profits.
-
Longs and shorts lower directional risks and avoid extreme moves.
-
Stop loss and take profit lock in profits and limit losses when trades go wrong.
-
Parameter optimization continuously improves strategy by adapting to changing markets.
Risk Analysis
The strategy also has some risks:
-
More indicators increase complexity. Improper settings may degrade performance. Extensive testing and optimization are needed.
-
Overreliance on technicals while ignoring fundamentals may cause inaccurate signals. Indicator false signals should be treated with caution.
-
Markets may have already moved when signals emerge, posing chasing risk. Allowing pullbacks is prudent.
-
Dual direction trading increases frequency, raising costs and pressure. Position sizing needs control.
-
Curve fitting risks exist. Robustness should be tested across diverse markets.
Risks can be managed through strict stop loss, prudent position sizing, reasonable leverage etc. Overall, the strategy has strong practical value.
Enhancement Opportunities
Some ways to optimize the strategy:
-
Test different parameter sets to find optimum values using stepwise, random or genetic algorithms.
-
Add more indicators like KDJ, Williams to build a robust indicator ensemble.
-
Optimize position sizing models to dynamically manage risk.
-
Incorporate machine learning models to predict price trends and movements.
-
Test across different products, timeframes and markets to improve adaptiveness.
-
Refine entry and exit timing to capture trends early and exit before reversals.
-
Employ profit taking, trailing stops to lock in profits and limit losses.
-
Add fundamental factors and market structure analysis to filter technical signals.
Summary
This strategy automates trading by interpreting multiple indicators. It benefits from indicator cross-validation, dual direction trading, stop loss/take profit etc. Overfitting and false signals require caution. Continuous optimization and testing can transform it into a robust, practical system, representing the future of quant trading strategies.
[/trans]
Strategy Arguments
| Argument | Default | Description |
|---|---|---|
| v_input_int_1 | 15 | length1 |
| v_input_float_1 | 2 | mult1 |
| v_input_1 | 14 | ADX Smoothing |
| v_input_2 | 14 | DI Length |
| v_input_int_2 | 14 | (?RSI Settings)RSI Length |
| v_input_source_1_close | 0 | Source: close |
| v_input_string_1 | 0 | (?MA Settings)MA Type: SMA |
| v_input_int_3 | 14 | MA Length |
| v_input_float_2 | 2 | BB StdDev |
Source (PineScript)
/*backtest
start: 2023-09-24 00:00:00
end: 2023-10-24 00:00:00
period: 2h
basePeriod: 15m
exchanges: [{"eid":"Futures_Binance","currency":"BTC_USDT"}]
*/

// This source code is subject to the terms of the Mozilla Public License 2.0 at https://mozilla.org/MPL/2.0/
// © The_Bigger_Bull
//@version=5
strategy("Best TradingView Strategy", overlay=true, margin_long=0, margin_short=0)
//Bollinger Bands
source1 = close
length1 = input.int(15, minval=1)
mult1 = input.float(2.0, minval=0.001, maxval=50)
basis1 = ta.sma(source1, length1)
dev1 = mult1 * ta.stdev(source1, length1)
upper1 = basis1 + dev1
lower1 = basis1 - dev1
//buyEntry = ta.crossover(source1, lower1)
//sellEntry = ta.crossunder(source1, upper1)

//RSI
ma(source, length, type) =>
    switch type
        "SMA" => ta.sma(source, length)
        "Bollinger Bands" => ta.sma(source, length)
        "EMA" => ta.ema(source, length)
        "SMMA (RMA)" => ta.rma(source, length)
        "WMA" => ta.wma(source, length)
        "VWMA" => ta.vwma(source, length)

rsiLengthInput = input.int(14, minval=1, title="RSI Length", group="RSI Settings")
rsiSourceInput = input.source(close, "Source", group="RSI Settings")
maTypeInput = input.string("SMA", title="MA Type", options=["SMA", "Bollinger Bands", "EMA", "SMMA (RMA)", "WMA", "VWMA"], group="MA Settings")
maLengthInput = input.int(14, title="MA Length", group="MA Settings")
bbMultInput = input.float(2.0, minval=0.001, maxval=50, title="BB StdDev", group="MA Settings")

up = ta.rma(math.max(ta.change(rsiSourceInput), 0), rsiLengthInput)
down = ta.rma(-math.min(ta.change(rsiSourceInput), 0), rsiLengthInput)
rsi = down == 0 ? 100 : up == 0 ? 0 : 100 - (100 / (1 + up / down))
rsiMA = ma(rsi, maLengthInput, maTypeInput)
isBB = maTypeInput == "Bollinger Bands"

//plot(rsi, "RSI", color=#7E57C2)
//plot(rsiMA, "RSI-based MA", color=color.yellow)
rsiUpperBand = hline(70, "RSI Upper Band", color=#787B86)
hline(50, "RSI Middle Band", color=color.new(#787B86, 50))
rsiLowerBand = hline(30, "RSI Lower Band", color=#787B86)
fill(rsiUpperBand, rsiLowerBand, color=color.rgb(126, 87, 194, 90), title="RSI Background Fill")
bbUpperBand = plot(isBB ? rsiMA + ta.stdev(rsi, maLengthInput) * bbMultInput : na, title = "Upper Bollinger Band", color=color.green)
bbLowerBand = plot(isBB ? rsiMA - ta.stdev(rsi, maLengthInput) * bbMultInput : na, title = "Lower Bollinger Band", color=color.green)
fill(bbUpperBand, bbLowerBand, color= isBB ? color.new(color.green, 90) : na, title="Bollinger Bands Background Fill")

//ADX

adxlen = input(14, title="ADX Smoothing")
dilen = input(14, title="DI Length")
dirmov(len) =>
	up1 = ta.change(high)
	down1 = -ta.change(low)
	plusDM = na(up1) ? na : (up1 > down1 and up1 > 0 ? up1 : 0)
	minusDM = na(down1) ? na : (down1 > up1 and down1 > 0 ? down1 : 0)
	truerange = ta.rma(ta.tr, len)
	plus = fixnan(100 * ta.rma(plusDM, len) / truerange)
	minus = fixnan(100 * ta.rma(minusDM, len) / truerange)
	[plus, minus]
adx(dilen, adxlen) =>
	[plus, minus] = dirmov(dilen)
	sum = plus + minus
	adx = 100 * ta.rma(math.abs(plus - minus) / (sum == 0 ? 1 : sum), adxlen)
sig = adx(dilen, adxlen)


out = ta.sma(close, 14)

sma1=ta.sma(close,55)

ema200=ta.ema(close,200)


longCondition = (out>sma1) and ta.crossover(source1, lower1)

if (longCondition )
    strategy.entry("long", strategy.long)

shortCondition = (out<sma1) and ta.crossunder(source1, lower1)

if (shortCondition )
    strategy.entry("short", strategy.short)


stopl=strategy.position_avg_price-50
tptgt=strategy.position_avg_price+100
stopshort=strategy.position_avg_price+50
tptgtshort=strategy.position_avg_price-100

strategy.exit("longclose","long",trail_offset=5,trail_points=45,when=ta.crossover(sma1,out))
strategy.exit("shortclose","short",trail_offset=5,trail_points=45,when=ta.crossover(out,sma1))


//if strategy.position_avg_price<0


plot(sma1 , color=color.blue)
plot(out, color=color.green)
//plot(ema200,color=color.red)
Detail
https://www.fmz.com/strategy/430177
Last Modified
2023-10-25 18:06:44