
8.8 KiB
Name
多空力量平衡策略Bull-and-Bear-Balance-Strategy
Author
ChaoZhang
Strategy Description
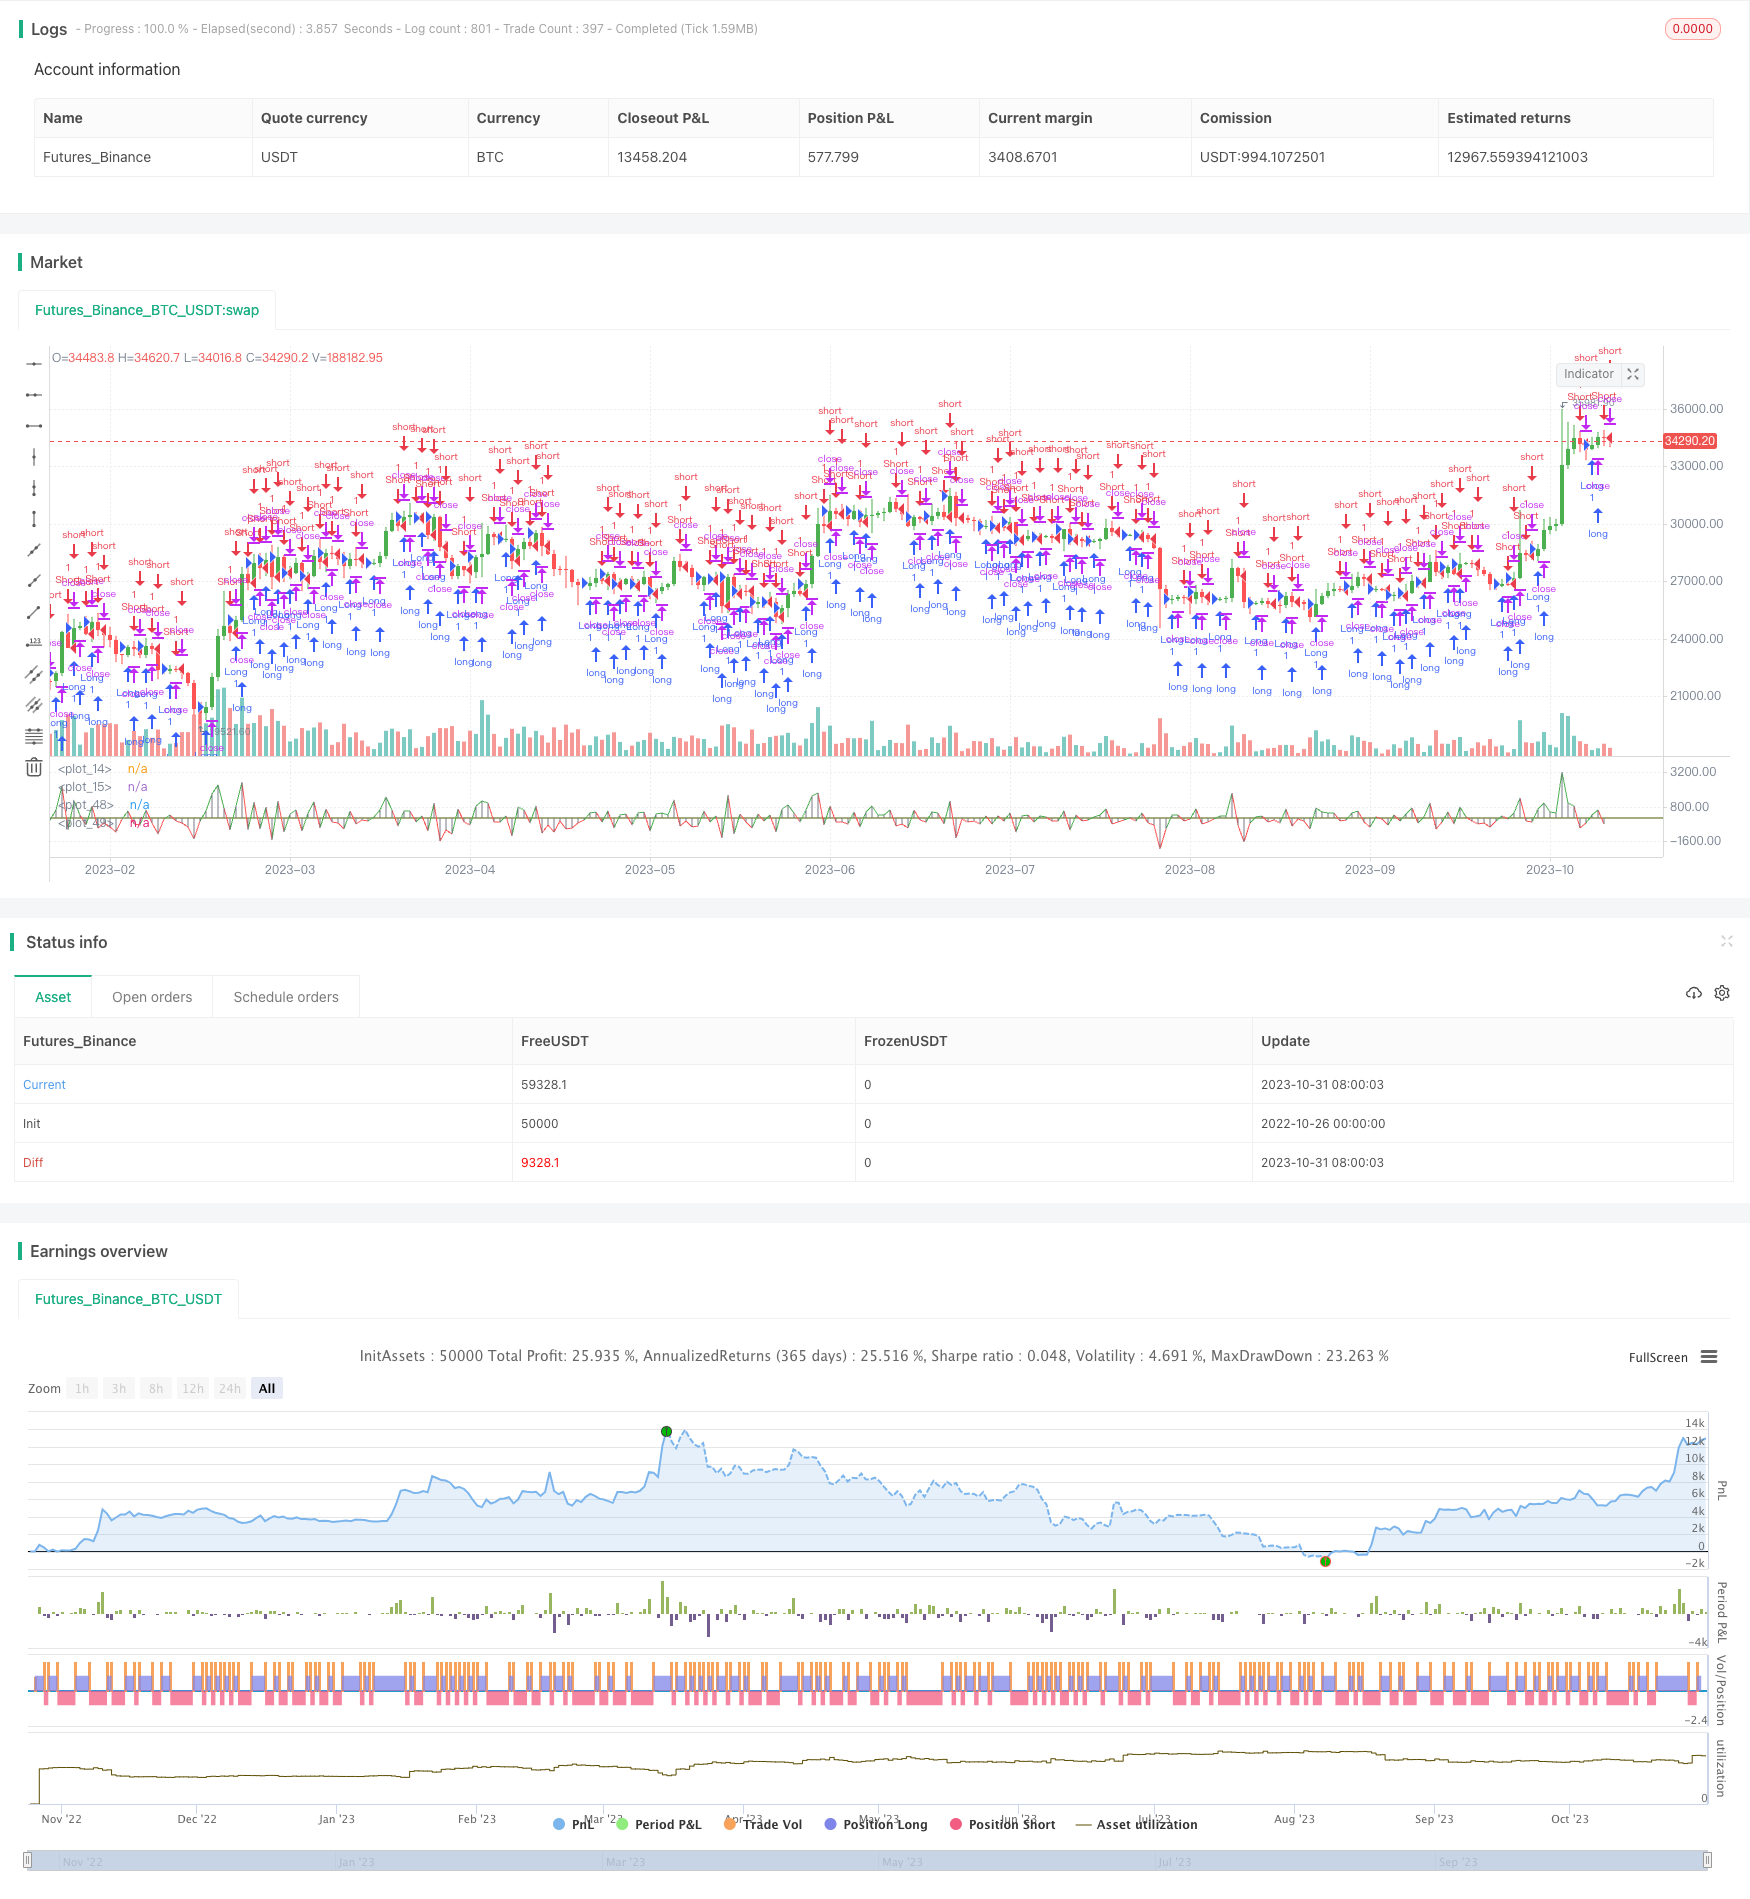 [trans]
概述
多空力量平衡策略是一种改进的趋势跟踪策略。它通过分析当前K线与前一根K线的关系,计算多空力量的平衡情况,从而判断目前的趋势方向。当多空力量失衡时,该策略会发出交易信号。其思路来源于传统的老阳线指标,但进行了改进,可以更准确地判断趋势。
策略原理
该策略的核心指标是nBBB,它反映当前K线与前一根K线的多空力量平衡情况。nBBB的计算公式如下:
nBBB = value2 - value
其中,value和value2分别计算当前K线和前一根K线的多空力量。它们的计算过程比较复杂,涉及对收盘价、开盘价、最高价、最低价的关系进行判断。但总的来说,value反映当前K线的多空力量,value2反映前一K线的多空力量。两者之差就反映了多空力量的变化情况。
当nBBB低于设置的门限SellLevel时,发出做空信号;当nBBB高于门限BuyLevel时,发出做多信号。门限可以通过参数调整。
策略优势
这种策略有以下几点优势:
-
基于K线反转的判断,能够识别较强的趋势转折点。
-
通过计算多空力量平衡,判断信号更准确可靠。
-
采用当前K线与前一K线比较的思路,可以过滤掉部分噪音,使信号更清晰。
-
可适用于不同时间周期,灵活性较强。
-
计算指标nBBB直观可视,形成的交易信号简单明确。
策略风险
该策略也存在一些风险需要注意:
-
多空力量指标nBBB可能会产生错误信号,需要结合价格实体方向、成交量等进行验证。
-
仅凭借nBBB指标决策存在一定盲区,最好辅助其他技术指标决策。
-
参数SellLevel和BuyLevel的设定会直接影响策略表现,需要谨慎测试优化。
-
行情剧烈波动时,指标发出的信号可能有滞后,需要注意判断风险。
-
该策略更适合中长线操作,短线操作可能会被套。
策略优化
该策略可以从以下几个方面进行优化:
-
优化SellLevel和BuyLevel参数,使信号更匹配实际行情。可以通过历史数据回测来确定最佳参数。
-
增加止损策略,如移动止损、震荡止损等,可以有效控制风险。
-
结合其他指标,如成交量, stochastic等进行辅助,可以提高决策准确性。
-
增加机器学习成分,利用AI技术自动优化参数,并辅助发出更准确的交易信号。
-
不同交易品种和时间周期的参数可以进行分别优化,使策略针对性更强。
总结
多空力量平衡策略通过计算多空力量变化,判断趋势转折点,是一个相对简单实用的趋势跟踪策略。它有一定的优势,但也存在风险。通过参数优化、止损策略、辅助指标等手段可以适当改进该策略,使其效果更好。总体来说,这是一个值得深入研究和运用的量化策略思路。
||
Overview
The Bull and Bear Balance Strategy is an improved trend following strategy. It analyzes the balance between bullish and bearish forces based on the relationship between the current bar and previous bar, and generates trading signals when the balance is broken. The idea comes from the traditional Elder Ray indicator but with improvements to judge trends more accurately.
Strategy Logic
The core indicator of this strategy is nBBB, which reflects the balance between bullish and bearish forces of the current bar versus the previous bar. The nBBB is calculated as:
nBBB = value2 - value
Where value and value2 calculate the bullish and bearish forces of the current bar and previous bar respectively. The calculation is quite complex, involving judgments on the relationship between close, open, high and low prices. But in general, value measures the bull/bear forces of the current bar, and value2 measures that of the previous bar. Their difference reflects the change in bull/bear balance.
When nBBB falls below the threshold SellLevel, a short signal is generated. When nBBB rises above the threshold BuyLevel, a long signal is generated. The thresholds can be adjusted through parameters.
Advantages
The main advantages of this strategy are:
-
Based on reversal signals from candlesticks, it can identify strong trend turning points.
-
By measuring bull/bear balance, the signals are more accurate and reliable.
-
Comparing current bar with previous bar filters out some noise for clearer signals.
-
Applicable to different timeframes with good flexibility.
-
The nBBB indicator is intuitive and signals are simple and clear.
Risks
Some risks to note:
-
nBBB may generate false signals, requiring price confirmation.
-
Relying solely on nBBB has blind spots, better to incorporate other indicators.
-
SellLevel and BuyLevel parameters directly impact performance and need careful optimization.
-
Signals may lag during extreme volatility, requiring risk assessment.
-
More suitable for mid/long-term, short-term may get whipsawed.
Enhancements
Some ways to enhance the strategy:
-
Optimize SellLevel and BuyLevel based on historical backtests for best fit.
-
Incorporate stop loss mechanisms like trailing stop loss to control risks.
-
Add other indicators like volume, stochastic etc. to improve decision accuracy.
-
Introduce machine learning to auto-optimize parameters and generate better signals.
-
Separate parameter optimization for different products and timeframes.
Conclusion
The Bull and Bear Balance Strategy judges trend reversals by measuring changes in bull/bear force, making it a relatively simple and practical trend following strategy. It has certain advantages but also risks. With parameter optimization, stop losses, additional indicators etc., it can be improved further. Overall it presents an interesting quantitative approach worth deeper research and application.
[/trans]
Strategy Arguments
| Argument | Default | Description |
|---|---|---|
| v_input_1 | -15 | SellLevel |
| v_input_2 | 15 | BuyLevel |
| v_input_3 | false | Trade reverse |
Source (PineScript)
/*backtest
start: 2022-10-26 00:00:00
end: 2023-11-01 00:00:00
period: 1d
basePeriod: 1h
exchanges: [{"eid":"Futures_Binance","currency":"BTC_USDT"}]
*/

//@version=2
////////////////////////////////////////////////////////////
//  Copyright by HPotter v1.0 03/02/2017
//    This new indicator analyzes the balance between bullish and
//    bearish sentiment.
//    One can cay that it is an improved analogue of Elder Ray indicator.
//    To get more information please see "Bull And Bear Balance Indicator"
//    by Vadim Gimelfarb.
////////////////////////////////////////////////////////////
strategy(title = "Bull And Bear Balance Strategy")
SellLevel = input(-15, step=0.01)
BuyLevel = input(15, step=0.01)
reverse = input(false, title="Trade reverse")
hline(SellLevel, color=red, linestyle=line)
hline(BuyLevel, color=green, linestyle=line)
value =  iff (close < open ,
          iff (close[1] > open ,  max(close - open, high - low), high - low),
           iff (close > open,
             iff(close[1] > open, max(close[1] - low, high - close), max(open - low, high - close)),
              iff(high - close > close - low,
               iff (close[1] > open, max(close[1] - open, high - low), high - low),
                 iff (high - close < close - low,
                  iff(close > open, max(close - low, high - close),open - low),
                   iff (close > open, max(close[1] - open, high - close),
                     iff(close[1] < open, max(open - low, high - close), high - low))))))

value2 = iff (close < open ,
          iff (close[1] < open ,  max(high - close[1], close - low), max(high - open, close - low)),
           iff (close > open,
             iff(close[1] > open,  high - low, max(open - close[1], high - low)),
              iff(high - close > close - low,
               iff (close[1] < open, max(high - close[1], close - low), high - open),
                 iff (high - close < close - low,
                  iff(close[1] > open,  high - low, max(open - close, high - low)),
                   iff (close[1] > open, max(high - open, close - low),
                     iff(close[1] < open, max(open - close, high - low), high - low))))))
nBBB = value2 - value
nBBBc = nBBB < 0 ? red : green
pos = iff(nBBB < SellLevel, -1,
	   iff(nBBB >= BuyLevel, 1, nz(pos[1], 0)))
possig = iff(reverse and pos == 1, -1,
          iff(reverse and pos == -1, 1, pos))
if (possig == 1)
    strategy.entry("Long", strategy.long)
if (possig == -1)
    strategy.entry("Short", strategy.short)
barcolor(possig == -1 ? red: possig == 1 ? green : blue )
plot(nBBB, style=line, linewidth=1, color=nBBBc)
plot(nBBB, style=histogram, linewidth=1, color=gray)
Detail
https://www.fmz.com/strategy/430899
Last Modified
2023-11-02 17:12:40