
9.3 KiB
Name
多模型组合蜡烛形态策略Multi-model-Candlestick-Pattern-Combination-Strategy
Author
ChaoZhang
Strategy Description
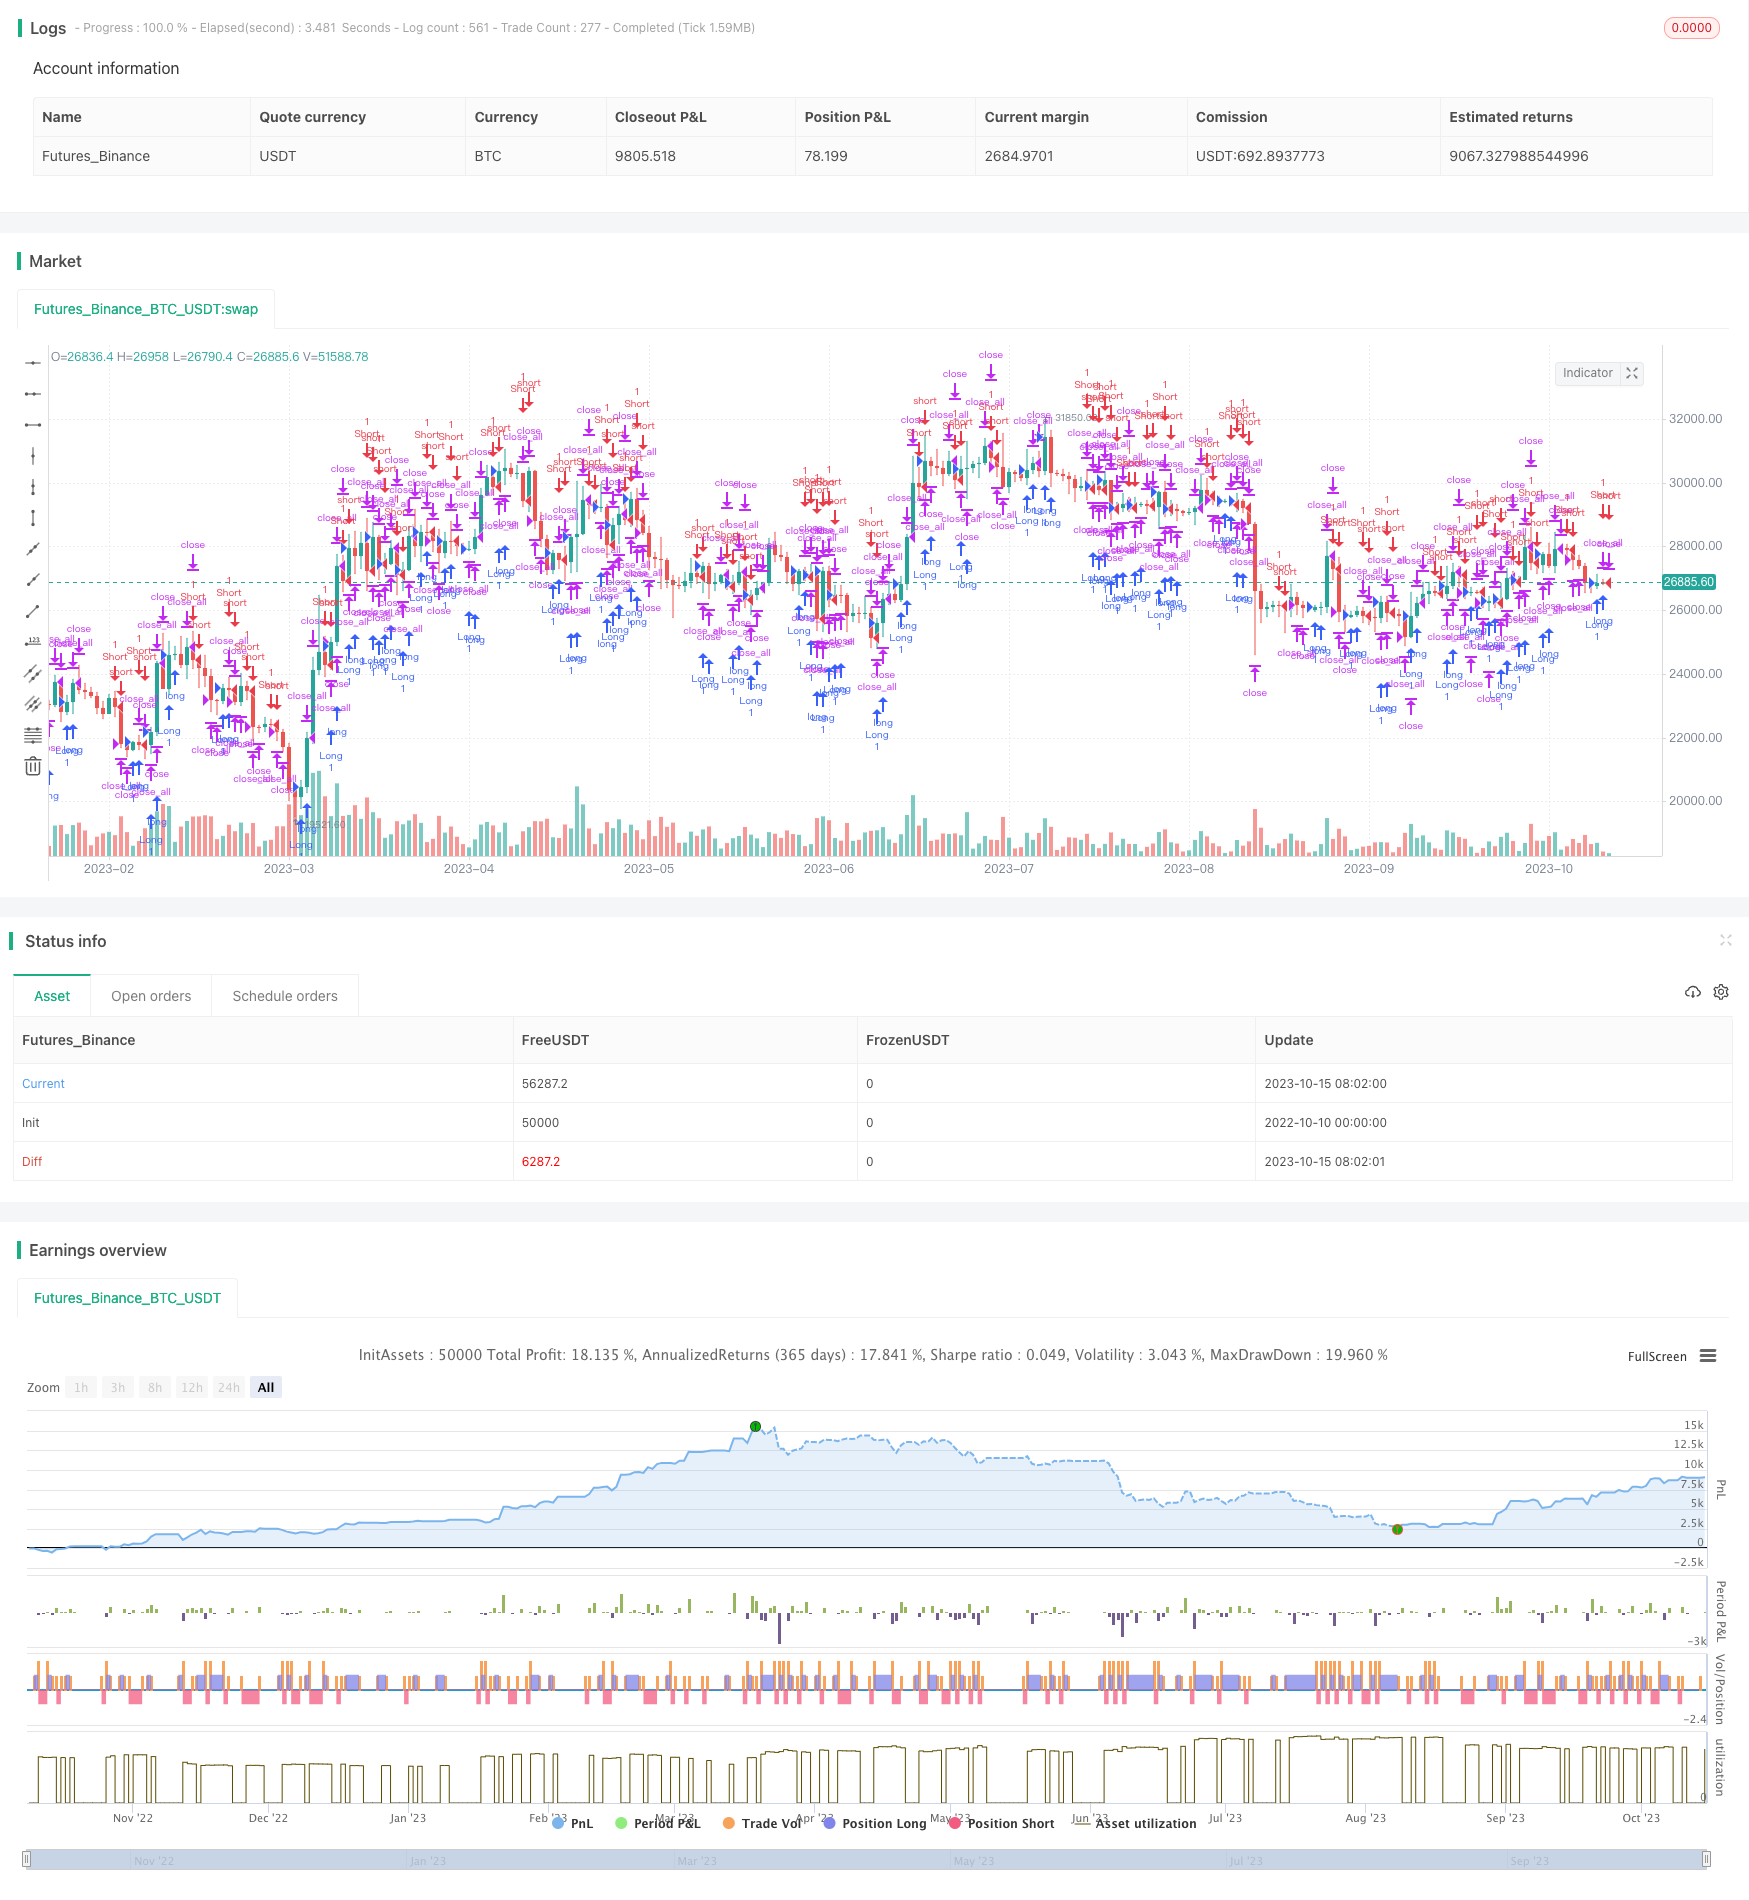
[trans]
概述
这个策略通过组合使用多种蜡烛形态模型来进行股票交易。它结合了包裹线模型、空心蜡烛模型和十字星模型,可以在不同的市场条件下捕捉交易机会。
原理
该策略的核心逻辑是构建若干蜡烛形态判断规则,然后综合这些规则来产生交易信号。
首先,它定义了一些基础变量来描述蜡烛线的属性,如蜡烛实体大小body,开盘价open,收盘价close等。
然后,它根据蜡烛的收盘价与开盘价的关系,定义了3个trading bar类型:1代表涨,-1代表跌,0代表不涨不跌。
在此基础上,构建了3个蜡烛形态判断规则:
-
包裹线模型(Engulfing Pattern):当前K线包住上一K线,产生买入或卖出信号。
-
空心蜡烛模型(Harami Pattern): 上一K线包住当前K线,产生买入或卖出信号。
-
十字星模型(Harami Cross Pattern):空心蜡烛与十字星的组合,产生买入或卖出信号。
根据这些蜡烛形态规则,可以确定买入和卖出的时机。并结合一些附加条件,如交易时间范围限制,来过滤掉不符合要求的交易信号。
交易部分中,会先判断持仓情况,如果与蜡烛信号方向相反,会先平仓,然后再按照信号方向开仓。
优势
-
多种形态结合,稳定性强。单一形态可能受特定市场环境影响较大,组合使用形态可以提高稳定性。
-
同方向形态确认,综合判断,避免误判。不同的形态模型从不同角度判断趋势,可以相互验证信号。
-
参数可调整,适应性强。用户可以自由组合选择不同的形态模型,调整交易时间范围等参数,灵活应对市场变化。
-
完善的交易逻辑。结合持仓判断与止损退出逻辑,可以有效控制风险。
风险
-
多参数组合增加复杂度。需要测试各个参数的组合匹配性,不当的参数组合可能降低效果。
-
shape参数设置依赖经验。形态参数如实体大小是否合适需要积累经验来调整。
-
单边持仓带来的风险。仅做多或仅做空会限制获利空间。可以通过参数设置同时做多做空。
-
可能错过趋势反转点。此策略以形态识别为主,无法有效判断趋势反转。可以结合其他指标来判断时机。
优化
-
增加止损策略,以降低单边持仓带来的风险。
-
结合其他技术指标,判断大趋势走向,避免逆势交易。如MACD, Bollinger Band等。
-
测试不同品种的参数偏好,建立适合不同品种的形态组合。
-
增加机器学习算法,通过AI来辅助参数优化和形态识别。
总结
该策略通过综合运用多种蜡烛形态的优势,构建了一个相对稳定和可靠的短线交易系统。但部分参数设置和风险控制还需要进一步优化,以适应更复杂的市场环境。整体来说,该策略思路合理,在积累足够经验和数据的基础上,通过机器学习等手段进行智能优化,前景广阔。
||
Overview
This strategy combines multiple candlestick pattern models to trade stocks. It incorporates engulfing pattern, harami pattern and harami cross pattern to capture trading opportunities in different market conditions.
Principle
The core logic of this strategy is to build several candlestick pattern recognition rules and then generate trading signals by combining these rules.
Firstly, it defines some basic variables to describe candlestick properties like the candle body size, open price, close price etc.
Then based on the relationship between the closing price and opening price, it defines 3 types of trading bar: 1 for rising, -1 for falling and 0 for no change.
On this basis, 3 candlestick pattern recognition rules are constructed:
-
Engulfing Pattern: current candle engulfs the previous one, generating buy or sell signals.
-
Harami Pattern: previous candle engulfs the current one, generating buy or sell signals.
-
Harami Cross Pattern: combination of Harami and Doji, generating buy or sell signals.
According to these candlestick patterns, the timing of buy and sell can be determined. Some additional conditions are combined to filter out invalid signals, like trading time range limit.
The trading logic checks existing position first. If contradicting with signal direction, it will close current position first, then open new position according to signal.
Advantages
-
Combination enhances stability. Single pattern is prone to specific market conditions. Combination can improve reliability.
-
Confirmation improves accuracy. Different patterns verify each other. False signals can be avoided.
-
Flexibility. Users can freely combine models and adjust parameters for different market dynamics.
-
Risk control. Stop loss and position handling logic manages risks effectively.
Risks
-
Complexity. More parameters means more complexity. Improper combination may undermine performance.
-
Parameter tuning requires expertise. How to set proper pattern parameters needs experience.
-
One-side holding risk. Long or short only limits profit potential. Allow both long and short can help.
-
Missing reversal points. Focusing on patterns loses sight of trend reversal signals. Adding other indicators can help identify potential reversal points.
Enhancement
-
Add stop loss to reduce holding risk.
-
Incorporate other technical indicators to determine overall trend, avoiding trading against major trend. E.g. MACD, Bollinger Band etc.
-
Test model parameters across different products, establish optimal parameter sets fitting each product.
-
Introduce machine learning to help optimize parameters and pattern recognition using AI.
Conclusion
This strategy constructs a relatively stable short-term trading system by combining multiple candlestick patterns. But parameter tuning and risk control still need improvement to adapt more complex markets. Overall it has solid logic and has great potential after accumulating enough data and experience, and leveraging machine learning for intelligent optimization.
[/trans]
Strategy Arguments
| Argument | Default | Description |
|---|---|---|
| v_input_1 | true | Long |
| v_input_2 | true | Short |
| v_input_3 | true | Model Engulfing |
| v_input_4 | true | Model Harami |
| v_input_5 | true | Model Harami Cross |
| v_input_6 | 1900 | From Year |
| v_input_7 | 2100 | To Year |
| v_input_8 | true | From Month |
| v_input_9 | 12 | To Month |
| v_input_10 | true | From day |
| v_input_11 | 31 | To day |
| v_input_12 | false | Reversive trading |
Source (PineScript)
/*backtest
start: 2022-10-10 00:00:00
end: 2023-10-16 00:00:00
period: 1d
basePeriod: 1h
exchanges: [{"eid":"Futures_Binance","currency":"BTC_USDT"}]
*/

//Noro
//2018

//@version=3
strategy(title = "Noro's CandleModels Tests", shorttitle = "CandleModels tests", overlay = true, default_qty_type = strategy.percent_of_equity, default_qty_value = 100, pyramiding = 0)

//Settings
needlong = input(true, defval = true, title = "Long")
needshort = input(true, defval = true, title = "Short")

eng = input(true, defval = true, title = "Model Engulfing")
har = input(true, defval = true, title = "Model Harami")
harc = input(true, defval = true, title = "Model Harami Cross")

fromyear = input(1900, defval = 1900, minval = 1900, maxval = 2100, title = "From Year")
toyear = input(2100, defval = 2100, minval = 1900, maxval = 2100, title = "To Year")
frommonth = input(01, defval = 01, minval = 01, maxval = 12, title = "From Month")
tomonth = input(12, defval = 12, minval = 01, maxval = 12, title = "To Month")
fromday = input(01, defval = 01, minval = 01, maxval = 31, title = "From day")
today = input(31, defval = 31, minval = 01, maxval = 31, title = "To day")
rev = input(false, defval = false, title = "Reversive trading")

//Body
body = abs(close - open)
abody = sma(body, 10)

//MinMax Bars
min = min(close, open)
max = max(close, open)

//Signals
bar = close > open ? 1 : close < open ? -1 : 0
doji = body < abody / 10
up1 = eng and bar == 1 and bar[1] == -1 and min <= min[1] and max >= max[1]
dn1 = eng and bar == -1 and bar[1] == 1 and min <= min[1] and max >= max[1]
up2 = har and bar == 1 and bar[1] == -1 and min >= min[1] and max <= max[1]
dn2 = har and bar == -1 and bar[1] == 1 and min >= min[1] and max <= max[1]
up3 = harc and doji and bar[1] == -1 and low >= min[1] and high <= max[1]
dn3 = harc and doji and bar[1] == 1 and low >= min[1] and high <= max[1]
exit = ((strategy.position_size > 0 and bar == 1) or (strategy.position_size < 0 and bar == -1)) and body > abody / 2 and rev == false

//Trading
if up1 or up2 or up3
    if strategy.position_size < 0
        strategy.close_all()

    strategy.entry("Long", strategy.long, needlong == false ? 0 : na, when=(time > timestamp(fromyear, frommonth, fromday, 00, 00) and time < timestamp(toyear, tomonth, today, 23, 59)))

if dn1 or dn2 or dn3
    if strategy.position_size > 0
        strategy.close_all()

    strategy.entry("Short", strategy.short, needshort == false ? 0 : na, when=(time > timestamp(fromyear, frommonth, fromday, 00, 00) and time < timestamp(toyear, tomonth, today, 23, 59)))

if time > timestamp(toyear, tomonth, today, 23, 59) or exit
    strategy.close_all()
Detail
https://www.fmz.com/strategy/429490
Last Modified
2023-10-17 15:53:06