
10 KiB
Name
多时间段动量反转策略Momentum-Reversal-Multi-Timeframe-Strategy
Author
ChaoZhang
Strategy Description
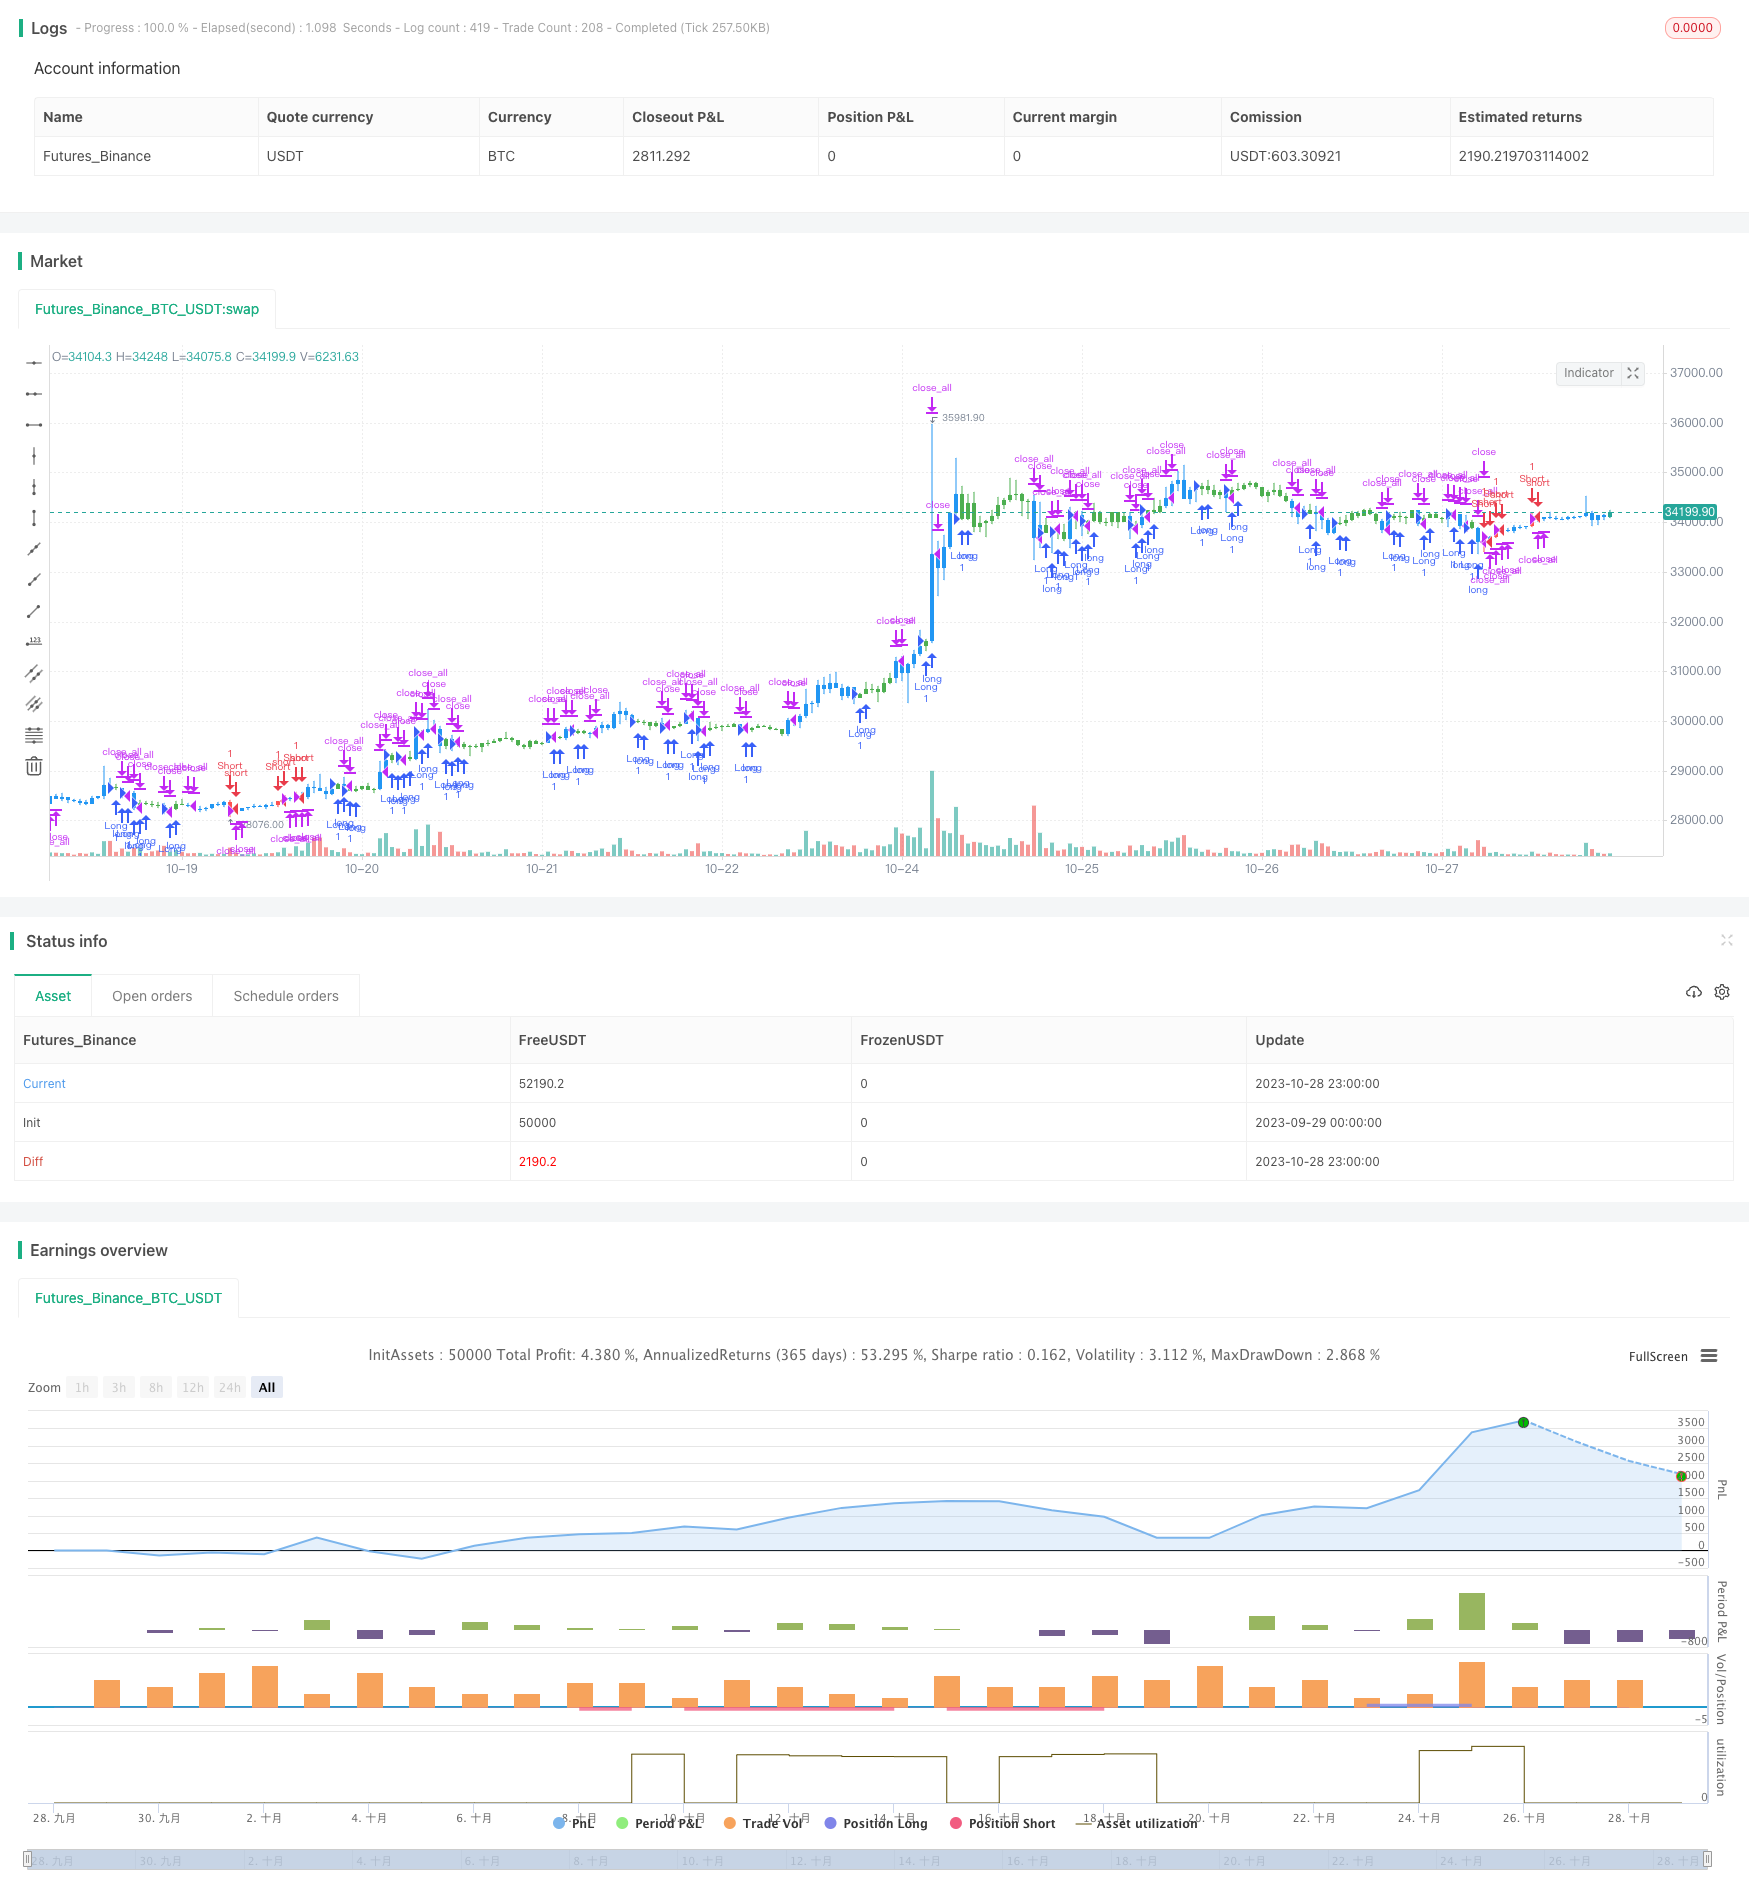
[trans]
概述
本策略结合不同时间段的动量指标,实现在多个时间尺度判断市场趋势反转的能力。策略利用Stochastic oscillator判断短期趋势反转点,并结合较长周期的(最高价-最低价)/收盘价指标判断中长期趋势,实现在多个时间维度判断趋势反转的能力。
策略原理
策略由两部分组成:
- 123反转策略
该部分通过Stochastic oscillator的快线和慢线交叉来判断短期趋势反转。具体来说,如果收盘价较前一日收高,且Stochastic的快线低于慢线且快线低于50,则做多;如果收盘价较前一日收低,且Stochastic的快线高于慢线且快线高于50,则做空。该策略利用Stochastic判断短期超买超卖状态,实现短线反转交易。
- (最高价-最低价)/收盘价指标
该指标反映当前K线的波动性。指标值较大时表示当前波动加大,可能反转;指标值较小时表示当前波动减弱,趋势可能持续。策略利用该指标的SMA值判断中长线趋势反转。
综合两个指标,可以在短期和中长期同时判断趋势反转,实现多时间尺度的交易策略。
策略优势
-
组合多个时间段指标,提高准确率
策略同时利用短期和中长期指标,可以确保反转信号的可靠性,避免单一指标造成的假信号。
-
灵活的指标参数设定
Stochastic oscillator和(最高价-最低价)/收盘价指标的参数都可以根据市场调整,使策略更具灵活性。
-
简单明了的策略结构
策略以Stochastic为核心,辅以中长期趋势判断,结构简单清晰,易于理解和修改。
-
可扩展性强
策略框架简单通用,可方便地引入更多指标,构建多因子模型。
风险分析
-
趋势市场表现可能不佳
策略以反转为主,在持续趋势市场中表现可能不佳。应适当调整参数以适应趋势市场。
-
需关注指标发出假信号的风险
在异常市场情况下,Stochastic 和 (最高价-最低价)/收盘价指标可能发出错误信号,需要防范假信号风险。
-
指标参数设置需要经验
Stochastic 和 (最高价-最低价)/收盘价指标的参数需要根据市场情况优化,否则可能影响策略表现。
-
须适当控制仓位规模
策略为反转策略,盈亏波动可能较大,需要控制好仓位和风险。
策略优化方向
-
引入更多指标构建多因子模型
可在现有框架下引入更多因子,如成交量、其它反转指标等,构建多因子模型。
-
增加止损机制
可设定移动止损或时间止损,有效控制单笔交易的损失。
-
参数优化
可以通过更系统的方法如遗传算法等手段对参数进行优化。
-
增加机器学习
应用机器学习算法训练判断趋势反转的模型可能进一步提高准确率。
-
结合情感分析
引入社交数据等非结构化数据的情感分析,辅助预测反转点。
总结
本策略整合短期和中期两个时间维度的指标来实现多时间段判断趋势反转,是一个非常好的反转策略框架。具有指标参数灵活、结构简单、扩展性强等优点。下一步可以从引入更多因子、参数优化、止损以及机器学习等方面进行改进,使策略的盈利能力和风险控制能力进一步提升。总体来说,该策略思路新颖,值得深入研究与应用。
||
Overview
This strategy combines momentum indicators across different timeframes to identify trend reversal at multiple time scales. It uses the Stochastic oscillator to spot short-term reversals and the (Highest-Lowest)/Close indicator for medium-to-long term trends, enabling reversal detection in multiple time dimensions.
Strategy Logic
The strategy consists of two components:
- 123 Reversal
It uses Stochastic fast line crossing below slow line along with price reversal patterns to identify short-term trend reversals. Specifically, it goes long when price closes higher than previous close and Stochastic fast line crosses below slow line and below 50; it goes short when price closes lower than previous close and Stochastic fast line crosses above slow line and above 50. This part aims to capture mean-reversion setups based on overbought/oversold readings.
- (Highest-Lowest)/Close Indicator
This indicator measures the volatility of the current bar. Higher values suggest increased volatility and potential reversals, while lower values indicate decreased volatility and trend continuation. The strategy uses SMA of this indicator to identify medium-to-long term trend reversals.
Combined together, the two components enable the strategy to detect reversals across short and medium-to-long timeframes.
Advantages
-
Improved accuracy with multi-timeframe indicators
Using both short and medium-to-long term indicators ensures signal reliability and avoids false signals.
-
Flexible indicator parameters
Parameters of both Stochastic and (H-L)/C can be adjusted for market regimes, making the strategy robust.
-
Simple and intuitive logic
With Stochastic as the core and a trend filter, the framework is simple and easy to understand.
-
Extensibility
The simple framework allows easy incorporation of more indicators to build multifactor models.
Risks
-
May underperform in persistent trend
The mean-reversion nature makes it less ideal for strong trending markets. Parameters could be tuned to adapt.
-
Risk of false signals
Stochastic and (H-L)/C may give off wrong signals in abnormal markets. Risks of false signals need to be managed.
-
Indicator tuning requires expertise
Parameters have to be optimized for changing markets, otherwise performance may suffer.
-
Appropriate position sizing needed
As a reversal strategy, prudent risk management on position sizing is important.
Enhancement Opportunities
-
More factors in multifactor model
Additional factors like volume, other reversal indicators can be added to create multifactor models.
-
Implement stop loss
Stop loss on time or moving basis could help control single trade loss.
-
Parameter optimization
More systematic parameter tuning methods like genetic algorithms can be explored.
-
Machine learning
ML algorithms may help improve reversal prediction accuracy.
-
Sentiment analysis
Incorporating alternative data like social sentiment could assist in predicting reversals.
Conclusion
This strategy combines short and medium-term indicators to identify reversals across timeframes. It has advantages like flexible parameters, simple structure, extensibility. Next steps could include more factors, stop loss, parameter optimization, machine learning to further improve profitability and risk management. Overall, this is an innovative strategy worth researching and applying.
[/trans]
Strategy Arguments
| Argument | Default | Description |
|---|---|---|
| v_input_1 | 14 | Length |
| v_input_2 | true | KSmoothing |
| v_input_3 | 3 | DLength |
| v_input_4 | 50 | Level |
| v_input_5 | 4 | Look Back |
| v_input_6 | false | % change |
| v_input_7 | 13 | SMA Length |
| v_input_8 | false | Trade reverse |
Source (PineScript)
//@version=3
////////////////////////////////////////////////////////////
//  Copyright by HPotter v1.0 23/05/2019
// This is combo strategies for get
// a cumulative signal. Result signal will return 1 if two strategies
// is long, -1 if all strategies is short and 0 if signals of strategies is not equal.
//
// First strategy
// This System was created from the Book "How I Tripled My Money In The
// Futures Market" by Ulf Jensen, Page 183. This is reverse type of strategies.
// The strategy buys at market, if close price is higher than the previous close
// during 2 days and the meaning of 9-days Stochastic Slow Oscillator is lower than 50.
// The strategy sells at market, if close price is lower than the previous close price
// during 2 days and the meaning of 9-days Stochastic Fast Oscillator is higher than 50.
//
// Second strategy
//  This histogram displays (high-low)/close
//  Can be applied to any time frame.
//
// WARNING:
// - For purpose educate only
// - This script to change bars colors.
////////////////////////////////////////////////////////////
Reversal123(Length, KSmoothing, DLength, Level) =>
    vFast = sma(stoch(close, high, low, Length), KSmoothing)
    vSlow = sma(vFast, DLength)
    pos = 0.0
    pos := iff(close[2] < close[1] and close > close[1] and vFast < vSlow and vFast > Level, 1,
	         iff(close[2] > close[1] and close < close[1] and vFast > vSlow and vFast < Level, -1, nz(pos[1], 0)))
	pos

HLCHist(input_barsback, input_percentorprice, input_smalength) =>
    xPrice = (high-low)/close
    xPriceHL = (high-low)
    xPrice1 = iff(input_percentorprice, xPrice * 100, xPriceHL)
    xPrice1SMA = sma(abs(xPrice1), input_smalength)
    pos = 0.0
    pos := iff(xPrice1SMA[input_barsback] > abs(xPrice1), 1,
    	   iff(xPrice1SMA[input_barsback] < abs(xPrice1), -1, nz(pos[1], 0)))
    pos

strategy(title="Combo Backtest 123 Reversal & (H-L)/C Histogram", shorttitle="Combo", overlay = true)
Length = input(14, minval=1)
KSmoothing = input(1, minval=1)
DLength = input(3, minval=1)
Level = input(50, minval=1)
//-------------------------
input_barsback = input(4, title="Look Back")
input_percentorprice = input(false, title="% change")
input_smalength = input(13, title="SMA Length")
reverse = input(false, title="Trade reverse")
posReversal123 = Reversal123(Length, KSmoothing, DLength, Level)
posHLCHist = HLCHist(input_barsback, input_percentorprice, input_smalength)
pos = iff(posReversal123 == 1 and posHLCHist == 1 , 1,
	   iff(posReversal123 == -1 and posHLCHist == -1, -1, 0))
possig = iff(reverse and pos == 1, -1,
          iff(reverse and pos == -1, 1, pos))
if (possig == 1)
    strategy.entry("Long", strategy.long)
if (possig == -1)
    strategy.entry("Short", strategy.short)
if (possig == 0)
    strategy.close_all()
barcolor(possig == -1 ? red: possig == 1 ? green : blue )
Detail
https://www.fmz.com/strategy/430545
Last Modified
2023-10-30 10:42:54